A Comprehensive Guide to MSC Exosome Characterization: Mastering NTA, Western Blot, and TEM for Therapeutic Development
This article provides a detailed guide for researchers and drug development professionals on the essential characterization techniques for Mesenchymal Stem Cell (MSC)-derived exosomes.
A Comprehensive Guide to MSC Exosome Characterization: Mastering NTA, Western Blot, and TEM for Therapeutic Development
Abstract
This article provides a detailed guide for researchers and drug development professionals on the essential characterization techniques for Mesenchymal Stem Cell (MSC)-derived exosomes. It covers the foundational principles of exosome biology, standard operating procedures for Nanoparticle Tracking Analysis (NTA), Western Blot, and Transmission Electron Microscopy (TEM), and addresses common troubleshooting and optimization challenges. Furthermore, it explores advanced validation strategies and comparative analyses of these techniques, emphasizing their critical role in ensuring the identity, purity, safety, and potency of MSC exosomes for therapeutic applications, in line with current regulatory considerations and MISEV guidelines.
The Building Blocks: Understanding MSC Exosomes and the Imperative for Rigorous Characterization
Biological Foundations of MSC Exosomes
Mesenchymal stem cell-derived exosomes (MSC-Exos) are nanoscale extracellular vesicles (30-150 nm in diameter) produced within multivesicular bodies (MVBs) and released into the extracellular space through the fusion of MVBs with the plasma membrane [1] [2]. These vesicles are secreted by MSCs sourced from various tissues including bone marrow, umbilical cord, adipose tissue, and placental tissue [1] [3]. Unlike their parent cells, exosomes lack nuclei, thus preventing neoplastic transformation, and exhibit higher stability, easier production, and longer preservation capabilities [1].
Exosomes function as vital information carriers, facilitating intercellular communication through their complex cargo, which includes proteins, lipids, cell surface receptors, enzymes, cytokines, transcription factors, and nucleic acids [1]. The biogenesis of exosomes occurs via exocytosis, with the endosomal sorting complex required for transport (ESCRT) playing a crucial role in driving their formation [1]. Their molecular composition includes common exosomal markers such as tetraspanins (CD63, CD9, CD81), heat shock proteins, and Alix, while their lipid composition is typically conserved and cell type-specific [1] [2].
The therapeutic effects of MSCs were initially attributed to their differentiation potential; however, recent investigations indicate that their paracrine activity, particularly through exosome secretion, governs their principal efficacy [3] [2]. Studies have demonstrated that exosomes alone can recapitulate the biological potential of MSCs, making them promising candidates for cell-free regenerative medicine approaches that circumvent the safety concerns associated with whole-cell therapies [3].
Therapeutic Applications and Mechanisms
MSC-Exos have demonstrated remarkable therapeutic potential across a broad spectrum of disease models through their ability to transfer functional cargo and modulate recipient cell behavior. The tables below summarize their key application areas and the molecular mechanisms involved in their therapeutic actions.
Table 1: Key Therapeutic Application Areas of MSC-Exos
| Application Area | Specific Conditions/Models | Observed Effects |
|---|---|---|
| Neurological Disorders | Stroke, Parkinson's disease, Alzheimer's disease, Traumatic brain injury [1] [3] | Neuroprotection, reduced inflammation, promoted neurogenesis and functional recovery [1] [3] |
| Cardiovascular Diseases | Myocardial infarction, Ischemia/reperfusion injury [1] [3] [4] | Inhibited apoptosis, stimulated angiogenesis, improved cardiac function [1] [3] |
| Immunomodulation & Autoimmune Diseases | Graft-versus-host disease (GvHD), Rheumatoid arthritis, Multiple sclerosis, Type 1 diabetes [3] | Modulation of T-cell responses, suppression of inflammatory cytokines, induction of regulatory immune cells [3] |
| Tissue Repair & Regeneration | Cutaneous wound healing, Bone repair, Liver and Kidney diseases (e.g., Acute kidney injury) [1] [3] [4] | Enhanced angiogenesis, reduced fibrosis, promoted proliferation of tissue-specific cells, dampened oxidative stress [1] [3] |
| Oncology | Breast cancer, Tumor microenvironment [4] [5] | Drug delivery, potential modulation of tumor growth and metastasis (context-dependent) [4] [5] |
| Other Inflammatory/Degenerative Conditions | Acute respiratory distress syndrome (ARDS/COVID-19), Osteoarthritis, Premature ovarian failure (POF) [1] [3] [6] | Suppression of NLRP3-mediated pyroptosis, reduction of oxidative stress, restoration of tissue function and hormonal balance [1] [3] [6] |
Table 2: Molecular Mechanisms and Cargo of MSC-Exos
| Mechanistic Category | Specific Molecules/Pathways Involved | Functional Outcome |
|---|---|---|
| Nucleic Acid Transfer | microRNAs (e.g., anti-inflammatory, pro-angiogenic miRNAs), mRNAs [1] [3] | Alteration of gene expression in recipient cells, promoting survival, proliferation, and differentiation [1] [3] |
| Protein & Cytokine Signaling | VEGF (angiogenesis), TGF-β (immunomodulation, fibrosis), CXCR4 [4] [5] | Direct activation or inhibition of signaling pathways that control cell growth, migration, and immune responses [4] [5] |
| Inflammasome Regulation | Suppression of NLRP3 inflammasome activation, reduction of IL-1β and IL-18 [6] | Inhibition of pyroptosis (inflammatory cell death), reduction of systemic inflammation [6] |
| Oxidative Stress Response | Reduction of reactive oxygen species (ROS), upregulation of antioxidant factors [6] | Protection of cells from oxidative damage and apoptosis [6] |
| Immune Cell Modulation | Inhibition of IFN-γ secretion by T cells, interaction with dendritic cells and B cells [3] [5] | Shift from pro-inflammatory to anti-inflammatory immune environment [3] [5] |
The therapeutic profile of MSC-Exos can vary depending on their cellular origin. For instance, exosomes from adipose tissue demonstrate superior angiogenic capability, while those from bone marrow exhibit potent immunomodulatory effects, such as inhibiting IFN-γ secretion by T cells [3]. Furthermore, MSC-Exos can be engineered or loaded with exogenous chemicals, biomolecules, drugs, or RNAs to enhance their targeting and therapeutic efficacy, functioning as intelligent drug delivery systems [1] [5].
Experimental Workflow for Exosome Isolation and Characterization
A critical component of MSC exosome research involves standardized methodologies for their isolation and characterization. The following diagram and subsequent protocol detail the core workflow from cell culture to functional analysis.
Diagram Title: MSC Exosome Isolation and Characterization Workflow
Detailed Protocol: Exosome Isolation via Ultracentrifugation
Principle: Differential ultracentrifugation (DUC) separates exosomes from other components in the cell culture supernatant based on their size, shape, and density using progressively increasing centrifugal forces [2]. This method is considered the gold standard for exosome isolation and accounts for approximately 56% of all methods used by researchers [2].
Materials:
- Source: Mesenchymal Stem Cells (e.g., from bone marrow, umbilical cord)
- Equipment: Ultracentrifuge, swinging-bucket rotors (e.g., Type 70 Ti, 90 Ti), high-speed centrifuge, microcentrifuge, 0.22 μm pore size filters
- Reagents: Phosphate-buffered saline (PBS), protease inhibitors
Procedure:
- Cell Culture and Conditioning: Culture MSCs until they reach 70-80% confluence. Replace the standard growth medium with serum-free medium to eliminate contaminating bovine exosomes. Condition cells for 24-48 hours [2].
- Harvesting Supernatant: Collect the conditioned medium into centrifuge tubes.
- Removal of Cells and Debris:
- Centrifuge at 300 × g for 10 minutes to pellet and remove live cells.
- Transfer the supernatant to new tubes and centrifuge at 2,000 × g for 20 minutes to remove dead cells.
- Transfer the supernatant again and centrifuge at 10,000 × g for 30 minutes to pellet larger vesicles and cellular debris.
- Filtration: Carefully filter the supernatant through a 0.22 μm pore filter to remove remaining particles and microvesicles [2].
- Ultracentrifugation: Transfer the filtered supernatant to ultracentrifuge tubes. Pellet the exosomes by ultracentrifugation at 100,000 - 120,000 × g for 70 minutes at 4°C [2].
- Washing: Resuspend the crude exosome pellet in a large volume of PBS (e.g., 30-35 mL) to wash away contaminating proteins. Perform a second ultracentrifugation step under the same conditions (100,000 - 120,000 × g for 70 minutes) [2].
- Resuspension and Storage: Carefully discard the supernatant and resuspend the final, purified exosome pellet in a small volume of PBS (e.g., 100-200 μL). Aliquot and store at -80°C for future use.
Notes: The DUC method is laborious and time-consuming but is applicable to large sample volumes, making its scalability feasible for clinical purposes. The outcome should be considered an enrichment of "small EVs," as some co-isolation of non-exosomal particles like serum lipoproteins can occur [2].
Detailed Protocol: Characterization of MSC-Exos (NTA, TEM, Western Blot)
Principle: Isolated exosomes must be rigorously characterized to confirm their identity, purity, and integrity. This is achieved by assessing their size distribution, morphological features, and presence of specific marker proteins.
Materials:
- Equipment: Nanoparticle Tracking Analyzer (e.g., Malvern NanoSight), Transmission Electron Microscope, Western Blot apparatus
- Reagents: PBS, Glutaraldehyde, Paraformaldehyde, SDS-PAGE gels, Primary antibodies (Anti-CD63, Anti-CD81, Anti-TSG101), Secondary antibodies, PVDF membrane
A. Nanoparticle Tracking Analysis (NTA)
- Dilution: Dilute the exosome sample in filtered PBS to achieve an ideal concentration for counting (typically 10⁸ - 10⁹ particles/mL) [6].
- Analysis: Load the sample into the NTA chamber. The instrument tracks the Brownian motion of individual particles under laser illumination.
- Data Acquisition: The software calculates the hydrodynamic diameter of each particle based on its diffusion rate, generating a report on particle size distribution and concentration [6].
B. Transmission Electron Microscopy (TEM)
- Preparation: Adhere a Formvar-carbon coated grid to a drop of the exosome suspension for 1-20 minutes.
- Fixation and Staining: Wash the grid with distilled water and negatively stain with 1-2% Uranyl Acetate solution for 1-10 minutes. Allow to air dry [6].
- Imaging: Observe the grid under the TEM at 80-120 kV. MSC-Exos should appear as cup-shaped or spherical vesicles with diameters approximately 30-150 nm [6].
C. Western Blot Analysis
- Lysis: Lyse the exosome pellet with RIPA buffer containing protease inhibitors.
- Electrophoresis and Transfer: Separate the proteins by SDS-PAGE and transfer them onto a PVDF membrane.
- Antibody Probing: Probe the membrane with positive marker antibodies (e.g., CD63, CD81, TSG101) and a negative marker antibody (e.g., Calnexin, which should be absent in pure exosome preparations) [6].
- Detection: Use chemiluminescence to detect the bound antibodies. A positive result for exosomal markers and a negative result for intracellular contaminants confirm successful isolation.
The Scientist's Toolkit: Essential Research Reagents
The table below catalogs key reagents and materials essential for conducting research on MSC-derived exosomes.
Table 3: Essential Research Reagents for MSC-Exosome Studies
| Reagent/Material | Function/Application | Examples / Key Specifications |
|---|---|---|
| Source of MSCs | Determines the biological context and potential functional bias of the derived exosomes. | Bone Marrow (BM-MSCs), Umbilical Cord (UC-MSCs), Adipose Tissue (AD-MSCs) [3] [5] |
| Serum-Free Medium | Used during the conditioning phase to collect exosome-rich supernatant free of contaminating animal-derived vesicles. | DMEM/F12, X-VIVO 15; must be exosome-depleted if containing serum [2] |
| Protease Inhibitors | Added to the conditioned medium during collection to prevent degradation of the protein cargo within exosomes. | Commercial cocktails (e.g., containing AEBSF, Aprotinin, Bestatin, etc.) [2] |
| Ultracentrifuge & Rotors | Core equipment for the differential ultracentrifugation isolation protocol. | Fixed-angle or swinging-bucket rotors capable of >100,000 × g (e.g., Type 70 Ti) [2] |
| 0.22 μm Pore Filter | Used to filter the conditioned medium prior to ultracentrifugation, removing large vesicles and debris. | PVDF or cellulose acetate membrane filters [2] |
| Antibody Panel for Characterization | Critical for confirming exosomal identity via Western Blot by detecting positive and negative markers. | Positive: Anti-CD63, Anti-CD81, Anti-TSG101; Negative: Anti-Calnexin [6] |
| NTA Instrument | For determining the size distribution and concentration of particles in the final exosome preparation. | Malvern Panalytical NanoSight series [6] |
| TEM & Staining Reagents | For visualizing the morphology and ultrastructure of isolated exosomes. | Uranyl Acetate (negative stain), Glutaraldehyde (fixative) [6] |
| ELISA Kits | For quantifying specific proteins, cytokines, or hormones in functional studies involving exosome-treated cells or animals. | Kits for IL-1β, IL-18, FSH, AMH, etc. [6] |
Signaling Pathways in MSC-Exo Mediated Therapy
A prominent mechanism by which MSC-Exos exert their therapeutic effects, particularly in inflammatory conditions, is through the modulation of key cellular signaling pathways. The following diagram illustrates the suppression of the NLRP3 inflammasome pathway, a mechanism demonstrated in a model of premature ovarian failure (POF) [6].
Diagram Title: MSC-Exo Suppression of NLRP3 Inflammasome Pathway
Pathway Description: In a cyclophosphamide (CTX)-induced POF model, the cytotoxic insult triggers oxidative stress in ovarian cells, particularly granulosa cells [6]. This stress activates the NLRP3 inflammasome, a multiprotein complex. Inflammasome activation initiates a form of inflammatory cell death known as pyroptosis, which is characterized by the cleavage of Gasdermin-D proteins and the release of potent inflammatory cytokines IL-1β and IL-18 [6]. This cascade leads to follicular atresia (death) and overall ovarian dysfunction. Treatment with MSC-Exos was shown to mitigate this damage by suppressing oxidative stress and directly inhibiting the activation of the NLRP3 inflammasome pathway, thereby preserving ovarian function and fertility [6]. This pathway exemplifies the potent anti-inflammatory and cytoprotective mechanisms harnessed by MSC-Exos.
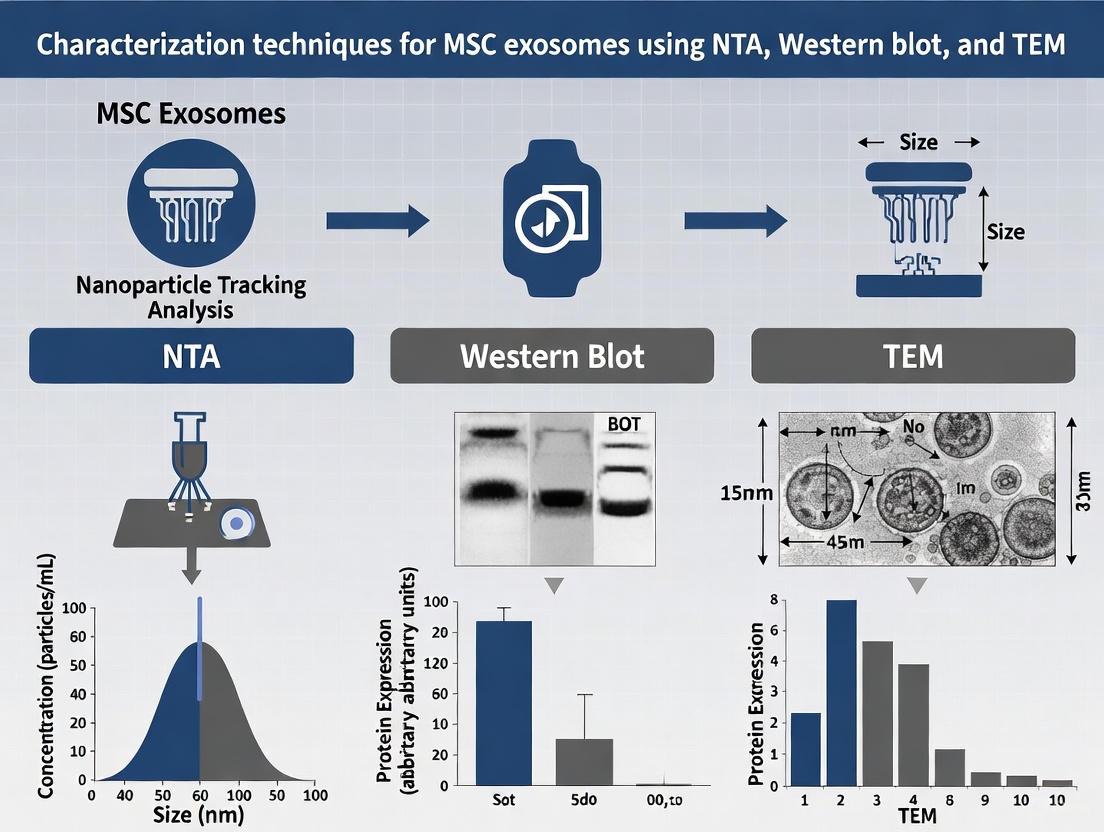
The transition of mesenchymal stem cell (MSC)-derived exosomes from research tools to clinical therapeutics hinges on rigorous and standardized characterization. These small extracellular vesicles (sEVs), typically 30-150 nm in diameter, mediate therapeutic effects via their cargo of proteins, nucleic acids, and lipids [7] [8]. However, their clinical application is constrained by significant heterogeneity in isolation methods and a lack of standardized quality control frameworks [9] [10]. This challenge necessitates a multifaceted analytical approach. Nanoparticle Tracking Analysis (NTA), Western blot, and Transmission Electron Microscopy (TEM) have emerged as the foundational "characterization trinity" that provides complementary data on exosome quantity, biochemical identity, and structural integrity. This application note delineates the distinct roles of each technique within a comprehensive characterization workflow, providing detailed protocols and quantitative benchmarks to support the reproducibility and reliability of MSC-exosome research for drug development professionals.
The Core Characterization Trinity: A Complementary Framework
The following diagram illustrates the integrated workflow and complementary nature of the three core characterization techniques:
Nanometer-Scale Metrology: Quantifying Size and Concentration
Nanoparticle Tracking Analysis (NTA) operates on the principles of light scattering and Brownian motion to provide quantitative metrology of exosome preparations. As particles in suspension undergo random movement, the rate of motion, quantified for each particle, is inversely related to its spherical diameter according to the Stokes-Einstein equation. This technique is indispensable for determining key quantitative attributes of an exosome preparation, including total particle yield, particle-to-protein ratio, and the polydispersity index (PDI), which is a critical metric of sample homogeneity [11] [7] [12].
Typical Outputs and Benchmarks: For MSC-exosomes, NTA typically reveals a mean particle size distribution peaking between 100-200 nm [11] [13]. For instance, a study on bone marrow MSC-sEVs reported a mean size of 114.16 ± 14.82 nm when cells were cultured in DMEM and 107.58 ± 24.64 nm in α-MEM [11]. Another study confirmed a heterogeneous population with a mean size of 182.9 ± 2.5 nm and a mode size of 110.0 ± 4.6 nm [13]. The polydispersity index (PDI) should ideally be below 0.3 to indicate a monodisperse population, as demonstrated in a protocol that achieved a PDI of <0.3 alongside a size of 121.3 ± 23.7 nm [14]. Particle concentration can vary significantly based on the MSC source and isolation method, with reported values ranging from 6.9 × 10^7 particles/mL for BMSC-exosomes to 1.2 × 10^8 particles/mL for umbilical cord MSC-exosomes [15].
Table 1: Representative NTA Data from MSC-Exosome Studies
| MSC Source | Isolation Method | Mean Size (nm) | Mode Size (nm) | Particle Concentration | PDI/ Homogeneity | Reference |
|---|---|---|---|---|---|---|
| Bone Marrow | Ultracentrifugation | 114.2 ± 14.8 | N/R | 3,751 ± 2,059 particles/cell | High Polydispersity | [11] |
| Bone Marrow | Ultracentrifugation | 182.9 ± 2.5 | 110.0 ± 4.6 | N/R | Heterogeneous Population | [13] |
| Umbilical Cord | Differential Centrifugation | 121.3 ± 23.7 | N/R | N/R | PDI < 0.3 (Monodisperse) | [14] |
| Adipose Tissue | Aqueous Two-Phase System | N/R | N/R | 8.0 × 10^7 particles/mL | N/R | [15] |
N/R: Not Reported
Biochemical Fingerprinting: Confirming Exosomal Identity
Western blot (Immunoblot) is the definitive technique for confirming the biochemical identity of exosome preparations. It detects specific protein markers that confirm the endosomal origin of exosomes and assesses the purity of the preparation by testing for contaminating cellular components. The presence of transmembrane proteins (CD63, CD9, CD81) and luminal proteins (TSG101, ALIX) associated with the endosomal sorting complex required for transport (ESCRT) machinery is considered a hallmark of exosomes [11] [7] [12]. Concurrently, the absence of negative markers such as calnexin (an endoplasmic reticulum protein) or cytochrome C (a mitochondrial protein) is crucial to rule out significant contamination from cellular debris [14] [13].
Key Markers and Interpretation: A valid MSC-exosome preparation should show strong positive signals for a combination of these markers. For example, a study on bone marrow MSC-sEVs confirmed the presence of CD9, CD63, and TSG101 [11]. Similarly, exosomes from various MSC sources (bone marrow, adipose tissue, umbilical cord) showed positive signals for CD63, CD81, and ALIX [15]. The absence of calnexin was demonstrated in a protocol for umbilical cord MSC-exosomes, indicating minimal contamination [14]. It is critical to note that no single positive marker is sufficient; a combination of markers is required to confidently assign an exosomal identity to the isolated vesicles.
Table 2: Essential Protein Markers for MSC-Exosome Characterization by Western Blot
| Marker Category | Specific Markers | Expected Result | Biological Significance & Rationale |
|---|---|---|---|
| Positive Markers | CD63, CD9, CD81 | Strong Positive | Tetraspanins enriched on exosome surface; confirm vesicular identity [11] [15] [12]. |
| TSG101, ALIX | Strong Positive | ESCRT-associated proteins; confirm endosomal biogenesis pathway [11] [15]. | |
| Negative Markers | Calnexin, GM130 | Absent | Organelle-specific proteins (ER & Golgi); their absence indicates minimal cell debris contamination [14]. |
| Cytochrome C | Absent | Mitochondrial protein; confirms isolation from mitochondrial contamination [13]. |
Visual Validation: Assessing Morphology and Integrity
Transmission Electron Microscopy (TEM) provides high-resolution, two-dimensional visual confirmation of exosome morphology and structural integrity. It is the only technique that directly images the vesicles, allowing researchers to confirm the classic cup-shaped or spherical morphology of exosomes, which is a result of the chemical fixation and dehydration process required for sample preparation [11] [14] [15]. Furthermore, TEM is critical for assessing the bilayer membrane structure and ensuring the vesicles are intact and not aggregated or lysed.
Typical Morphological Findings: Multiple studies consistently report the cup-shaped morphology of MSC-exosomes under TEM. For instance, BM-MSC-sEVs isolated via ultracentrifugation exhibited a distinct cup-shaped morphology [11]. This finding was replicated in exosomes derived from bone marrow, adipose, and umbilical cord MSCs, which all showed the typical cup-shaped structure [15]. A study on umbilical cord MSC-exosomes further confirmed spherical vesicles with intact bilayers [14]. These visual characteristics, combined with the size data from NTA, provide powerful evidence for the successful isolation of intact exosomes.
Detailed Experimental Protocols
Protocol for Nanoparticle Tracking Analysis (NTA)
This protocol is adapted from methodologies described across multiple studies [11] [16] [13].
1. Sample Preparation:
- Thaw frozen exosome samples on ice if previously stored at -80°C.
- Dilute the sample in filtered (0.1 µm) 1x PBS to achieve an ideal concentration for instrument reading. The target is 20-100 particles per frame [16], which typically corresponds to a final particle concentration between 1 × 10^7 to 1 × 10^9 particles/mL.
- Avoid vortexing; mix gently by pipetting to prevent damage to vesicles or foam formation.
2. Instrument Setup and Measurement (e.g., Malvern NanoSight NS300):
- Prime the system with filtered PBS to flush the flow cell.
- Use a syringe pump to ensure a constant flow during measurement.
- Configure the instrument with a 532 nm laser and camera level adjusted to visualize particles as sharp, distinct points of light.
- Capture three to five independent videos of 60 seconds each per sample.
- Maintain consistent temperature (e.g., 25°C) throughout the measurement, as temperature directly influences the calculated particle size via the Brownian motion calculation.
3. Data Analysis:
- Use the integrated NTA software (e.g., NTA 3.4) to analyze all captured videos.
- Report the mean particle size, mode particle size, and particle concentration.
- Calculate the polydispersity index (PDI) or assess the width of the size distribution histogram to evaluate sample homogeneity.
Protocol for Western Blot Analysis
This protocol synthesizes standard practices from cited research for confirming exosomal markers [11] [14] [15].
1. Sample Preparation and Lysis:
- Lyse a volume of exosome sample containing 10-30 µg of total protein (quantified by BCA or micro-BCA assay) in RIPA buffer supplemented with protease inhibitors [16].
- Incubate on ice for 30 minutes to ensure complete lysis.
- Centrifuge briefly to pellet any insoluble material.
2. Gel Electrophoresis and Transfer:
- Load the lysate onto a 4-20% gradient SDS-polyacrylamide gel.
- Include a pre-stained protein molecular weight ladder.
- Separate proteins by electrophoresis at a constant voltage (e.g., 120 V) until the dye front reaches the bottom of the gel.
- Transfer proteins from the gel to a PVDF or nitrocellulose membrane using a wet or semi-dry transfer system.
3. Immunoblotting:
- Block the membrane with 5% non-fat milk or BSA in TBST for 1 hour at room temperature.
- Incubate with primary antibodies diluted in blocking buffer overnight at 4°C.
- Common primary antibodies: Anti-CD63 (1:1000), Anti-CD9 (1:1000), Anti-TSG101 (1:1000), Anti-Alix (1:1000), Anti-Calnexin (1:1000).
- Wash the membrane 3 times for 5 minutes each with TBST.
- Incubate with an appropriate HRP-conjugated secondary antibody (e.g., anti-mouse or anti-rabbit, 1:5000) for 1 hour at room temperature.
- Perform detection using a chemiluminescent substrate and image with a digital imager.
Protocol for Transmission Electron Microscopy (TEM)
This protocol is based on standardized procedures for exosome imaging [11] [14] [15].
1. Sample Adsorption and Fixation:
- Adsorb 10-20 µL of purified exosome suspension onto a Formvar/carbon-coated copper grid for 1-20 minutes.
- Gently wick away excess liquid with filter paper.
- Negative Stain: Apply a drop of 1-2% uranyl acetate solution to the grid for 1-2 minutes. Wick away the excess stain and allow the grid to air-dry completely.
- Alternative Positive Stain & Fixation: Some protocols first fix the adsorbed vesicles with 2.5% glutaraldehyde, followed by negative staining [14].
2. Imaging and Analysis:
- Image the prepared grids using a TEM operated at an accelerating voltage of 80-100 kV.
- Capture images at various magnifications (e.g., from low-mag overviews to high-mag details of individual vesicles at 110,000x magnification) [13].
- Identify and document vesicles with the characteristic cup-shaped morphology and intact lipid bilayers.
The Scientist's Toolkit: Essential Reagent Solutions
Table 3: Key Research Reagents and Materials for MSC-Exosome Characterization
| Item | Function/Application | Examples & Specifications |
|---|---|---|
| NanoSight NS300 | NTA instrument for particle size and concentration analysis. | Malvern Panalytical system with 532 nm laser and syringe pump for constant flow [16]. |
| Micro BCA Protein Assay Kit | Colorimetric quantification of total exosomal protein content for Western blot normalization. | Thermo Fisher Scientific kit; requires sample lysis before use [16]. |
| Anti-Tetraspanin Antibodies | Primary antibodies for detecting exosomal surface markers in Western blot. | Mouse or rabbit monoclonal anti-CD63, anti-CD9, anti-CD81 [11] [15]. |
| Anti-ESCRT Antibodies | Primary antibodies for detecting luminal/exosomal pathway markers. | Anti-TSG101, Anti-Alix [11] [15]. |
| Chemiluminescent Substrate | HRP substrate for visualizing antibody-bound proteins on Western blots. | ECL or SuperSignal Western Blotting Substrates. |
| Formvar/Carbon Grids | TEM support film for adsorbing and visualizing exosomes. | 200-400 mesh copper grids [14]. |
| Uranyl Acetate | Negative stain for contrast enhancement of exosomes in TEM. | 1-2% aqueous solution, pH ~4.5 [14]. |
| Filtered PBS | Diluent for exosome samples for NTA and other assays. | Phosphate Buffered Saline, 0.1 µm filtered to remove particulate background [16]. |
The synergistic application of NTA, Western blot, and TEM forms an indispensable, non-redundant framework for the rigorous characterization of MSC-derived exosomes. This "characterization trinity" provides a comprehensive profile encompassing physical dimensions, biochemical signature, and structural morphology. As the field advances toward clinical applications, adhering to this multi-parametric standard, supplemented by the detailed protocols and benchmarks provided here, is paramount. It ensures the quality, consistency, and authenticity of exosome preparations, thereby solidifying the foundational data required for robust preclinical research and successful clinical translation in regenerative medicine and drug development.
The Minimal Information for Studies of Extracellular Vesicles (MISEV) guidelines, established by the International Society for Extracellular Vesicles (ISEV), provide a critical framework for standardizing extracellular vesicle (EV) research to ensure rigor, reproducibility, and reliability. The most current version, MISEV2023, represents the culmination of a three-year process incorporating feedback from over 1000 researchers worldwide [17]. These guidelines are particularly vital for research involving mesenchymal stem cell-derived small extracellular vesicles (MSC-sEVs), where characterization techniques such as Nanoparticle Tracking Analysis (NTA), Western blot, and Transmission Electron Microscopy (TEM) play essential roles in establishing EV identity, purity, and functionality [11] [17] [7].
MISEV2023 organizes its recommendations into several key domains: nomenclature and communication of concepts; collection and pre-processing; EV separation and concentration; EV characterization; technique-specific reporting; and functional studies, including EV release and uptake [17]. Adherence to these domains ensures that MSC-exosome research meets the highest standards of scientific validity, especially important for applications in drug development and therapeutic interventions where characterization directly impacts clinical translation [7].
Quantitative Characterization of MSC-sEVs
Comprehensive characterization of MSC-sEVs requires quantitative assessment across multiple physical and biochemical parameters. The following table summarizes the key quantitative data obtained from standard characterization techniques, providing a framework for reporting essential metrics.
Table 1: Key Quantitative Parameters for MSC-sEV Characterization
| Characterization Method | Measured Parameter | Typical Range for MSC-sEVs | Reporting Requirements |
|---|---|---|---|
| Nanoparticle Tracking Analysis (NTA) | Particle size distribution | 30–150 nm [7] | Mean/median size, mode, concentration (particles/mL) [11] |
| Particle concentration | Varies by isolation method (e.g., TFF yields higher than UC) [11] | Total yield, particles/cell ratio [11] | |
| Western Blot | Presence of transmembrane/luminal proteins | Positive for CD9, CD63, TSG101 [11] | Confirmatory images for ≥3 positive protein markers [11] [17] |
| Presence of negative markers | Negative for calnexin [11] | Evidence of purity from co-isolating contaminants [17] | |
| Transmission Electron Microscopy (TEM) | Morphological assessment | Cup-shaped morphology [11] | Representative images showing bilayer membrane structure [11] [17] |
| Functional Assay | Cell viability rescue | e.g., Increase from ~38% to ~54% after H₂O₂ damage [11] | Specific assay conditions, statistical significance of results [11] |
Experimental Protocol: Integrated Characterization of MSC-sEVs
This protocol details the sequential characterization of MSC-sEVs using NTA, Western blot, and TEM, following MISEV2023 principles [11] [17].
I. Sample Preparation and Isolation
- Cell Culture: Culture bone marrow-derived MSCs (BM-MSCs) in α-MEM supplemented with 10% human platelet lysate (hPL) under xeno-free, GMP-compliant conditions. Use cells between passages 3-6 [11].
- EV Collection: Harvest conditioned medium from 80-90% confluent cultures. Centrifuge at 2,000 × g for 20 minutes to remove cells and debris, followed by filtration through a 0.22 µm filter [11] [7].
- EV Isolation (Two Methods):
- Ultracentrifugation (UC): Pellet EVs from the clarified supernatant at 100,000 × g for 70 minutes at 4°C. Resuspend the pellet in sterile PBS [11] [7].
- Tangential Flow Filtration (TFF): Concentrate and purify EVs using a TFF system with an appropriate molecular weight cutoff (e.g., 100-500 kDa). TFF demonstrates statistically higher particle yields compared to UC [11].
II. Nanoparticle Tracking Analysis (NTA)
- Instrument Calibration: Calibrate the NTA instrument using standardized polystyrene beads (e.g., 100 nm) according to manufacturer specifications.
- Sample Preparation: Dilute the isolated EV suspension in sterile, particle-free PBS to achieve an optimal concentration of 10⁸–10⁹ particles/mL for analysis.
- Data Acquisition: Capture five videos of 60 seconds each per sample, with consistent detection threshold and camera settings across all samples.
- Data Analysis: Report the mean, median, mode particle size, and the total particle concentration. The expected size range for MSC-sEVs is 30-150 nm [11] [7].
III. Western Blot Analysis
- Protein Extraction: Lyse EVs in RIPA buffer supplemented with protease inhibitors. Determine protein concentration using a compatible assay (e.g., BCA assay).
- Gel Electrophoresis and Transfer: Load 10-20 µg of protein per lane onto a 4-12% Bis-Tris polyacrylamide gel. Separate proteins via electrophoresis and transfer to a PVDF membrane.
- Antibody Probing: Probe the membrane with the following antibodies to confirm EV identity and purity:
- Detection: Use appropriate HRP-conjugated secondary antibodies and a chemiluminescent substrate to visualize protein bands. Report representative images for all markers [11].
IV. Transmission Electron Microscopy (TEM)
- Sample Preparation: Adsorb 10 µL of EV suspension onto a Formvar-carbon coated copper grid for 1 minute. Wick away excess liquid with filter paper.
- Negative Staining: Stain with 2% uranyl acetate solution for 1 minute. Wick away excess stain and allow the grid to air-dry completely.
- Imaging: Observe the grid under a transmission electron microscope at an accelerating voltage of 80 kV. Capture images at various magnifications. MSC-sEVs should exhibit a characteristic cup-shaped morphology due to dehydration during preparation [11].
Essential Research Reagent Solutions
Successful characterization of MSC-exosomes relies on a defined set of high-quality reagents and materials. The following table catalogs the essential solutions required for these experiments.
Table 2: Essential Research Reagent Solutions for MSC-sEV Characterization
| Reagent/Material | Function/Application | Specific Example/Note |
|---|---|---|
| α-MEM Culture Medium | Supports the expansion of BM-MSCs and production of sEVs. | Superior cell morphology and proliferative capacity compared to DMEM [11]. |
| Human Platelet Lysate (hPL) | Xeno-free supplement for MSC culture medium. | Preferred over fetal bovine serum (FBS) to avoid contamination with foreign EVs [11]. |
| Size Exclusion Chromatography (SEC) Columns | Isolation of EVs based on hydrodynamic volume. | Provides good separation of EVs from soluble proteins; often combined with other methods like AEC [7]. |
| Antibody Panels (CD9, CD63, TSG101) | Detection of EV-enriched transmembrane and cytosolic proteins via Western blot. | Confirms EV identity; ≥3 positive markers are recommended [11] [17]. |
| Calnexin Antibody | Detection of an endoplasmic reticulum protein as a negative control in Western blot. | Its absence demonstrates minimal contamination by cellular components [11]. |
| Uranyl Acetate | Negative stain for visualization of EV morphology by TEM. | Provides high-contrast imaging of the vesicle's lipid bilayer [11]. |
Workflow Visualization
The following diagram illustrates the logical workflow for the isolation and characterization of MSC-sEVs, integrating the key steps and decision points outlined in the protocols above.
MISEV-Compliant Reporting Framework
Core Reporting Requirements
Adherence to MISEV2023 mandates specific reporting details across all aspects of EV research. The following table provides a checklist of essential elements that must be documented in publications and reports.
Table 3: MISEV-Compliant Reporting Checklist for MSC-sEV Studies
| Reporting Category | Specific Element to Report | MISEV2023 Guidance |
|---|---|---|
| Cell Source | Donor characteristics, tissue source, culture conditions (medium, supplements, passage number) [11]. | Pre-analytical variables significantly impact EV properties [17]. |
| EV Separation | Detailed isolation protocol (e.g., UC g-force/time, TFF membrane specs, SEC column type) [11] [7]. | The method must be described in sufficient detail for others to replicate [17]. |
| EV Characterization | Quantitative NTA data (size, concentration), WB images for ≥3 positive and ≥1 negative markers, TEM images showing morphology [11]. | Identity (markers), quantity (concentration), and purity (lack of contaminants) must be established [17]. |
| Function Assessment | Assay conditions, cell type used, dose (µg/mL), duration, and outcome measures (e.g., % cell viability) [11]. | Functional studies should use appropriate controls and standardized assays where possible [17]. |
Integrating these characterization techniques within the MISEV2023 framework ensures that data on MSC-exosomes is robust, interpretable, and comparable across laboratories. This structured approach is fundamental for advancing the field and accelerating the translation of MSC-sEV research into reliable clinical applications [11] [17] [7].
The therapeutic efficacy of Mesenchymal Stem Cell-derived exosomes (MSC-exos) is intrinsically linked to their physical and biochemical properties. This application note details the critical characterization techniques—Nanoparticle Tracking Analysis (NTA), Western Blot, and Transmission Electron Microscopy (TEM)—that researchers must employ to reliably connect exosome attributes to biological function. We provide standardized protocols and quantitative data demonstrating how isolation methods, source cell conditions, and vesicle composition directly influence therapeutic outcomes in regenerative applications, including angiogenesis, wound healing, and renal repair. Establishing robust characterization-potency correlations is essential for the advancement of reproducible MSC-exosome therapies.
Mesenchymal Stem Cell-derived exosomes are emerging as primary therapeutic agents in regenerative medicine, acting via complex paracrine signaling. Their functional potency is not a generic property but is dictated by specific and measurable physical (size, concentration) and biochemical (surface markers, cargo) characteristics. These characteristics are, in turn, influenced by a suite of factors including the MSC tissue source, culture conditions, and the exosome isolation methodology [18] [9]. Therefore, a rigorous and multi-faceted characterization pipeline is not merely a quality control step but a fundamental prerequisite for understanding and predicting therapeutic performance. This document outlines the core techniques required to build this critical link between characterization and function.
Quantitative Properties of MSC Exosomes
The following tables consolidate key quantitative data from recent studies, highlighting how specific properties correlate with enhanced functional output.
Table 1: Impact of Isolation Method on Exosome Yield and Function
| Isolation Method | Yield Compared to UC | Key Functional Improvement | Reference Model |
|---|---|---|---|
| Tangential Flow Filtration (TFF) | 92.5-fold increase [19] | Improved wound healing (23.1%) and angiogenesis (71.4%) in HCAECs [19] | Human Umbilical Cord MSC |
| Tangential Flow Filtration (TFF) | Significantly higher particle yield [11] | Enhanced ARPE-19 cell viability after H2O2-induced damage [11] | Bone Marrow MSC |
| 3D Hollow Fiber Bioreactor | 19.4-fold increase [20] | Superior therapeutic efficacy for cisplatin-induced AKI in murine model [20] | Human Umbilical Cord MSC |
Table 2: Influence of MSC Source and Culture on Exosome Proteome and Efficacy
| MSC Source / Culture Condition | Proteomic / Functional Profile | Therapeutic Implication | Study |
|---|---|---|---|
| Bone Marrow (BM) | Proteins enriched for superior regeneration ability [18] | Targeted regenerative applications [18] | Proteomic Analysis [18] |
| Adipose Tissue (AT) | Proteins prominent in immune regulation [18] | Immunomodulatory therapies [18] | Proteomic Analysis [18] |
| Umbilical Cord (UC) | Proteins significant in tissue damage repair [18] | Enhanced wound healing and repair [18] | Proteomic Analysis [18] |
| Culture in α-MEM vs. DMEM | Higher particle yield per cell (4,318 vs. 3,751 particles/cell) [11] | Optimized production yield [11] | sEV Production Optimization [11] |
Core Characterization Techniques and Protocols
Nanoparticle Tracking Analysis (NTA)
Purpose: To determine the size distribution and concentration of exosome particles in a suspension.
Experimental Protocol:
- Sample Preparation: Dilute the isolated exosome sample in filtered (0.22 µm) phosphate-buffered saline (PBS) to a concentration within the ideal detection range of 10^7–10^8 particles/mL [19].
- Instrument Calibration: Calibrate the NTA instrument (e.g., ZetaView QUATT, NanoSight NS300) using standardized latex beads according to the manufacturer's instructions.
- Measurement Setup:
- Data Acquisition: Record multiple videos (typically 3-11) of the particles' Brownian motion under consistent conditions.
- Data Analysis: Use the instrument's software to analyze the videos, which calculates the hydrodynamic diameter of each particle based on its movement, generating a size distribution profile and particle concentration.
Link to Function: Size can influence tissue penetration and cellular uptake mechanisms, while concentration is critical for dose standardization in therapeutic applications [20] [11].
Western Blot Analysis
Purpose: To confirm the presence of exosome-specific protein markers and assess sample purity.
Experimental Protocol:
- Protein Extraction: Lyse exosomes using RIPA or similar lysis buffer. Determine protein concentration with a BCA assay [19] [18].
- Sample Preparation: Dilute 3 parts of the exosome sample with 1 part 4X Laemmli Sample Buffer. Do not add a reducing agent (e.g., β-mercaptoethanol) when detecting common tetraspanins (CD9, CD63, CD81), as it can disrupt the antibody-epitope binding [21].
- Gel Electrophoresis: Load 20-35 µL of sample per well on a 10% polyacrylamide gel. Run SDS-PAGE at 200 V for 30-60 minutes [21].
- Membrane Transfer: Transfer proteins from the gel to a PVDF membrane using a wet (100 V, 60 min) or semi-dry (10 V, 30 min) transfer system [21].
- Blocking and Antibody Incubation:
- Block the membrane with 5% BSA in PBST (PBS with 0.2% TWEEN 20) for 1 hour at room temperature [21].
- Incubate with primary antibodies (see Table 4 for recommendations) diluted in blocking buffer for 1 hour at room temperature or overnight at 4°C.
- Wash membrane 3 times for 5 minutes each with Wash Buffer.
- Incubate with HRP-conjugated secondary antibodies (e.g., Goat anti-mouse HRP, 1:5000 dilution) for 1 hour at room temperature [21].
- Detection: Wash the membrane and incubate with a chemiluminescent substrate (e.g., Clarity Western ECL substrate). Image the blot using a chemiluminescence imager [21].
Link to Function: Surface markers (CD9, CD63, CD81) confirm exosome identity. Cargo proteins (e.g., TSG101) and the absence of negative markers (e.g., Calnexin from endoplasmic reticulum) confirm purity and can indicate functional potential [18] [5].
Transmission Electron Microscopy (TEM)
Purpose: To visualize the morphology and ultrastructure of exosomes.
Experimental Protocol:
- Sample Preparation: Apply a 20 µL drop of purified exosome suspension to a carbon-film coated copper grid (200 mesh) and allow to adhere for 10-20 minutes [19] [22].
- Negative Staining: Wick away excess liquid with filter paper. Carefully add a drop of 2% uranyl acetate solution to the grid for negative staining. Incubate for 1-5 minutes [22] [20].
- Rinsing: Wick away the stain and gently rinse by applying a drop of distilled water, which is immediately wicked away. Repeat once.
- Drying: Allow the grid to air-dry completely in a clean environment.
- Imaging: Insert the grid into the TEM (e.g., Hitachi H-7600) and image at an accelerating voltage of 80 kV [19].
Link to Function: Confirms the presence of a lipid bilayer and the classic "cup-shaped" morphology of intact exosomes, verifying structural integrity which is essential for cargo protection and cellular interactions [18] [20].
Integrated Workflow and Therapeutic Mechanism
The following diagram illustrates the integrated workflow from exosome production and characterization to its downstream therapeutic mechanism, linking the physical and biochemical properties to functional efficacy.
Diagram 1: The characterization-to-function pipeline. Defined exosome properties, established through rigorous characterization, dictate cellular uptake and subsequent intracellular signaling, leading to specific functional outcomes and overall therapeutic efficacy. BUN: Blood Urea Nitrogen; SCR: Serum Creatinine; GFR: Glomerular Filtration Rate [19] [20] [23].
The Scientist's Toolkit: Essential Research Reagents
Table 4: Key Reagents for MSC Exosome Characterization
| Reagent / Kit | Function / Application | Example Product / Clone |
|---|---|---|
| CD81 Antibody | Detection of exosome surface marker via WB [19] [18] | Anti-Human CD81, Clone 5A6 [21] |
| CD63 Antibody | Detection of exosome surface marker via WB [19] [18] | Anti-Human CD63, Clone H5C6 [21] |
| CD9 Antibody | Detection of exosome surface marker via WB [19] [18] | Anti-Human CD9, Clone HI9a [21] |
| TSG101 Antibody | Detection of exosome biogenesis marker (MVB pathway) via WB [18] | N/A |
| Exosome-depleted FBS | Cell culture supplement to reduce contaminating bovine exosomes [19] [24] | Thermo Fisher Scientific [24] |
| SEC Columns | Isolation of highly pure exosomes based on size [21] | Extracellular Vesicle SEC Columns [21] |
| TFF System | Large-scale, high-yield exosome isolation [19] | Repligen TFF System [19] |
| Laemmli Sample Buffer | Denaturing and loading samples for SDS-PAGE [21] | 4X Laemmli Sample Buffer (Bio-Rad) [21] |
A Step-by-Step Protocol for MSC Exosome Analysis with NTA, Western Blot, and TEM
Within the framework of research on characterization techniques for mesenchymal stem cell (MSC)-derived exosomes, Nanoparticle Tracking Analysis (NTA) has emerged as a critical methodology for the precise determination of particle size, distribution, and concentration [9] [11]. This application note details a standardized NTA protocol specifically optimized for the characterization of MSC-derived small extracellular vesicles (sEVs), including exosomes, which typically range from 30-150 nm in diameter [15]. The accurate quantification of these vesicles is paramount for establishing dose-effect relationships in therapeutic applications, where studies have revealed that administration routes such as nebulization achieve efficacy at approximately 10⁸ particles, significantly lower than intravenous routes [9].
The protocol outlined herein integrates NTA within a comprehensive characterization workflow that includes Western blot analysis for specific surface markers (CD9, CD63, TSG101) and transmission electron microscopy (TEM) for morphological validation [11] [15]. This multi-technique approach ensures rigorous characterization of MSC-sEVs, which is essential for advancing their clinical translation as cell-free therapeutic agents with immunomodulatory and regenerative properties [9] [11].
Experimental Workflow and Signaling Pathways
The complete characterization of MSC-exosomes involves an integrated workflow from isolation through multiple analytical techniques to functional validation. The following diagram illustrates this comprehensive experimental pathway:
MSC-exosomes exert their therapeutic effects through modulation of key intracellular signaling pathways. The following diagram illustrates the mechanisms by which MSC-exosomes, particularly those derived from bone marrow and umbilical cord, mitigate inflammation in target cells:
Detailed NTA Methodology
Sample Preparation and Instrument Setup
Prior to analysis, MSC-sEV samples must be properly prepared to ensure accurate measurement. Isolated sEVs should be diluted in deionized water or an appropriate buffer; typical dilutions range from 50,000× for concentrated samples [25]. The instrument requires proper initialization:
- Instrument Power-On: Turn on the NTA instrument (e.g., NanoSight NS300) and secure the flow chamber by tightening the four beige screws [26].
- Flow Chamber Installation: Place the glass chamber into the machine and engage the red lever to lock it in position [26].
- System Flushing: Using a new 1 mL syringe, flush the system with 1 mL of distilled water 2-3 times until no particles are visible on the screen [26]. Attach the syringe to the injection port and secure it properly.
Data Acquisition and Analysis
The measurement process involves both real-time visualization and automated analysis:
- Camera Activation: Navigate to 'Capture' and select 'Start Camera' to initialize the imaging system [26].
- Sample Injection: Draw the prepared sample into a 1 mL syringe, attach to the injection port, and select 'infuse' in the syringe pump control interface [26].
- Measurement Initiation: Once the sample volume reaches 300-400 µL in the syringe, begin the analysis [26].
- Parameter Setting: Select the appropriate standard operating procedure (SOP), specify the file destination, and input sample information including creator name, diluent factor, and sample description [26].
- Data Export: After measurement completion, export results as PDF files for further analysis and record-keeping [26].
Advanced concentration scanning technology represents a significant improvement over traditional NTA methods by performing a continuous microscopy scan throughout the entire measurement cell, providing more accurate concentration determination without additional calibration [27]. This method detects particles within a predefined measurement volume independent of the detection volume influenced by laser and camera settings, resulting in stable concentration values across different sensitivity settings [27].
Post-Measurement Cleaning Protocol
Proper instrument maintenance is essential for reproducible results:
- Sample Disposal: Expel remaining sample into waste and dispose of the syringe appropriately [26].
- System Flushing: Using a new syringe, flush the system with 1 mL of distilled water and repeat once to ensure complete removal of residual particles [26].
- Final Cleaning: After all samples are analyzed, flush the chamber with a total of 3 mL distilled water [26].
- Chamber Maintenance: Clean the glass chamber with ethanol, turn off the instrument, and close the software [26].
Quantitative Data Presentation
Table 1: Comparative Characterization of MSC-derived Exosomes from Different Tissue Sources
| Characterization Parameter | BMSC-Exos | ADSC-Exos | UMSC-Exos | Measurement Technique |
|---|---|---|---|---|
| Particle Concentration | 6.9 × 10⁷ particles/mL | 8.0 × 10⁷ particles/mL | 1.2 × 10⁸ particles/mL | NTA [15] |
| Size Distribution | 30-150 nm | 30-150 nm | 30-150 nm | NTA/TEM [15] |
| Specific Markers | CD63, CD81, ALIX positive | CD63, CD81, ALIX positive | CD63, CD81, ALIX positive | Western Blot [15] |
| Morphology | Cup-shaped | Cup-shaped | Cup-shaped | TEM [15] |
| Therapeutic Efficacy | Superior anti-inflammatory effects | Moderate effects | Superior anti-inflammatory effects | Functional assays [15] |
Clinical Dosing Information for MSC-Derived Vesicles
Table 2: Clinically Relevant Dosing Information for MSC-Derived Extracellular Vesicles
| Administration Route | Therapeutic Dose Range | Key Clinical Applications | Notes |
|---|---|---|---|
| Nebulization/Aerosolized Inhalation | ~10⁸ particles | Respiratory diseases, including COVID-19 | Achieves therapeutic effects at significantly lower doses than intravenous routes [9] |
| Intravenous Infusion | >10⁸ particles | Various systemic conditions | Requires higher doses than nebulization for efficacy [9] |
| Intravitreal Injection | Preclinical evaluation | Retinal diseases (e.g., retinitis pigmentosa) | Clinical trials ongoing (NCT05413148) [11] |
Research Reagent Solutions
Table 3: Essential Materials and Reagents for MSC-exosome Characterization
| Reagent/Equipment | Specific Function | Protocol Application |
|---|---|---|
| NanoSight NS300 Instrument | Particle size and concentration analysis | Core measurement system for NTA [25] |
| α-MEM with hPL | MSC culture medium | Optimal for BM-MSC growth and sEV yield [11] |
| Tangential Flow Filtration (TFF) | sEV isolation | Higher particle yields compared to ultracentrifugation [11] |
| CD9, CD63, TSG101 Antibodies | Exosomal marker detection | Western blot confirmation of sEV identity [11] |
| Transmission Electron Microscope | Morphological analysis | Validation of cup-shaped sEV morphology [15] |
| 100 nm Polystyrene Standards | Instrument calibration | Quality control for NTA measurements [27] |
The characterization of mesenchymal stem cell (MSC)-derived exosomes is a critical step in validating their identity, purity, and suitability for downstream therapeutic applications. Among the various analytical techniques, Western blot analysis stands as a cornerstone method for detecting specific protein markers that confirm the exosomal nature of isolated vesicles while assessing potential contamination from non-exosomal cellular components. This protocol details the optimized procedures for Western blot analysis of MSC-derived exosomes, framed within a comprehensive characterization workflow that includes Nanoparticle Tracking Analysis (NTA) and Transmission Electron Microscopy (TEM).
Exosomes, a subtype of small extracellular vesicles (sEVs) with sizes typically ranging from 30-200 nm, are released by nearly all cell types, including MSCs [28] [29]. These lipid bilayer-enclosed structures carry molecular cargo (proteins, nucleic acids, and lipids) from their parent cells and play crucial roles in intercellular communication [21] [13]. The protein composition of exosomes includes characteristic markers that reflect their endosomal origin and biogenesis pathway, which can be detected through Western blot to verify successful isolation [30] [28].
Exosomal Markers: Theoretical Framework
The Western blot characterization of exosomes relies on detecting both positive markers (proteins enriched in or specific to exosomes) and negative markers (proteins excluded from properly purified exosomal preparations). This dual approach confirms both the presence of exosomes and the absence of contaminating components.
Positive Exosomal Markers
Positive exosomal markers include transmembrane proteins involved in exosome biogenesis and intraluminal proteins associated with the endosomal pathway. Tetraspanins (CD9, CD63, CD81) are transmembrane proteins highly enriched in exosome membranes that participate in cargo sorting and membrane fusion events [21] [29]. ESCRT pathway-associated proteins (ALIX, TSG101) are involved in the endosomal sorting complex required for transport machinery that drives intraluminal vesicle formation [30] [28]. Heat shock proteins (HSP70, HSP90) are chaperones involved in protein folding and stress responses that are commonly detected in exosomes [28].
Negative Markers for Purity Assessment
Negative markers indicate contamination from non-exosomal cellular compartments and should be absent in purified exosome preparations. Calnexin is an endoplasmic reticulum (ER) resident protein that should not be present in properly isolated exosomes [30] [28]. Cytochrome C is a mitochondrial protein whose presence indicates contamination from mitochondrial compartments or apoptotic bodies [13]. Albumin is a major plasma protein whose detection suggests contamination from serum components in culture media or biofluids [28].
Table 1: Key Protein Markers for Exosomal Characterization by Western Blot
| Marker Type | Protein | Localization | Function | Presence in Exosomes |
|---|---|---|---|---|
| Positive Markers | CD9, CD63, CD81 | Transmembrane | Tetraspanins; membrane organization and cargo sorting | Enriched |
| ALIX | Intraluminal | ESCRT-associated; vesicle budding | Present | |
| TSG101 | Intraluminal | ESCRT-I component; vesicle formation | Present | |
| HSP70 | Intraluminal | Molecular chaperone; stress response | Present | |
| Negative Markers | Calnexin | ER membrane | ER protein folding | Absent |
| Cytochrome C | Mitochondria | Electron transport chain | Absent | |
| Albumin | Secretory protein | Plasma protein | Absent |
Materials and Reagents
Research Reagent Solutions
Table 2: Essential Reagents for Western Blot Analysis of Exosomes
| Reagent/Category | Specific Examples | Function/Application |
|---|---|---|
| Lysis/Sample Buffer | 4X Laemmli Sample Buffer (Bio-Rad #1610747) | Denatures proteins for SDS-PAGE |
| Reducing agents (2-mercaptoethanol, DTT) | Reduces disulfide bonds (note: avoid for some tetraspanins) | |
| Gel Electrophoresis | 4-15% Mini-PROTEAN TGX Precast Gels (Bio-Rad) | Separates proteins by molecular weight |
| Tris/Glycine/SDS Running Buffer | Provides conductive medium for electrophoresis | |
| Transfer System | PVDF Membrane (Bio-Rad) | Immobilizes proteins for antibody probing |
| Transfer Buffer (Tris-Glycine with methanol) | Facilitates protein transfer from gel to membrane | |
| Blocking & Antibodies | EveryBlot Blocking Buffer (Bio-Rad #12010020) or 5% BSA in PBST | Reduces nonspecific antibody binding |
| Primary Antibodies (Anti-CD63, CD9, CD81, ALIX, TSG101, Calnexin) | Binds specific exosomal marker proteins | |
| HRP-conjugated Secondary Antibodies | Binds primary antibody for detection | |
| Detection | Clarity Western ECL Substrate (Bio-Rad #1705061) | Chemiluminescent substrate for HRP |
| SuperSignal West Atto (Thermo Fisher #A38555) | High-sensitivity chemiluminescent substrate |
Experimental Protocol
Sample Preparation
Resuspend isolated exosomes in residual liquid from the isolation process and adjust to desired volume (e.g., EVs isolated from 1 mL of plasma can be adjusted to a final volume of 250 μL). Use low-binding tubes to minimize EV loss [21].
Prepare sample buffer mixture: Dilute 3 parts exosome sample with 1 part 4X Laemmli Sample Buffer [21].
Critical consideration for reducing agents: When blotting for tetraspanins (CD9, CD63, CD81), do not add reducing agent to the Laemmli Sample Buffer, as detection antibodies may recognize epitopes dependent on disulfide bonds. For other markers (ALIX, TSG101), add reducing agent (2-mercaptoethanol or DTT) [21].
Denature samples: Heat at 95°C for 5 minutes [21] or 15 minutes [30], then cool before loading.
SDS-PAGE and Protein Transfer
Load samples: Load desired volume (e.g., 20-35 μL) per well in a polyacrylamide gel (10% or 4-15% gradient) [21] [30].
Electrophoresis: Run SDS-PAGE at 200 V for approximately 30 minutes or until dye front reaches bottom [21].
Prepare transfer: Rinse gel twice with distilled water and incubate in cold Transfer Buffer for 15 minutes [21].
Protein transfer:
Immunoblotting
Block membrane: Incubate membrane in Blocking Buffer at room temperature for 1 hour with rocking (If using chemical blocking buffer, follow manufacturer recommendation e.g., 5 minutes for EveryBlot Blocking Buffer) [21].
Primary antibody incubation: Dilute primary antibodies in blocking buffer according to manufacturer recommendations (see Table 3 for typical concentrations). Incubate membrane with primary antibodies at room temperature for 1 hour or overnight at 4°C [21] [30].
Washing: Wash membrane 3 times for 5 minutes each with Wash Buffer (0.1% TWEEN 20 in PBS) [21].
Secondary antibody incubation: Incubate membrane with appropriate HRP-conjugated secondary antibodies diluted in blocking buffer at room temperature for 1 hour [21] [30].
Final washing: Wash membrane 3 times for 5 minutes each with Wash Buffer [21].
Detection and Imaging
Signal detection: Incubate blot with chemiluminescence substrate according to manufacturer instructions [21] [30].
Image acquisition: Capture signals using a chemiluminescence imaging system such as ChemiDoc Touch Imaging System [30].
Substrate selection: Choose appropriate chemiluminescent substrates based on sensitivity requirements (see Table 3 for recommendations) [21].
Table 3: Recommended Antibody Dilutions and Detection Conditions
| Target | Clone | Primary Antibody Concentration (μg/mL) | Secondary Antibody | Secondary Antibody Dilution | Recommended Substrate |
|---|---|---|---|---|---|
| CD9 | HI9a | 0.5 - 1.0 | Goat anti-mouse HRP | 1:5000 | Clarity Western ECL [21] |
| CD63 | H5C6 | 1.0 - 2.0 | Goat anti-mouse HRP | 1:5000 | Clarity Western ECL [21] |
| CD81 | 5A6 | 0.5 - 1.0 | Goat anti-mouse HRP | 1:5000 | Clarity Western ECL [21] |
| General | Various | 0.5 - 2.0 | Species-appropriate HRP | 1:5000 | Varies by abundance [21] |
Integrated Characterization Workflow
Western blot analysis should be performed as part of a comprehensive characterization strategy that includes complementary techniques to fully validate exosome preparations.
Expected Results and Interpretation
A successful Western blot analysis of MSC-derived exosomes should demonstrate strong signals for positive exosomal markers (CD9, CD63, CD81, ALIX, TSG101) and absence of signals for negative markers (calnexin, cytochrome C). The relative expression patterns of tetraspanins may vary depending on the MSC source and culture conditions [11].
When comparing exosomal fractions to whole cell lysates, exosomal markers should be enriched in the exosomal fraction, while negative markers such as calnexin should be present only in cell lysates [13] [28]. The following diagram illustrates the step-by-step Western blot protocol and expected results:
Troubleshooting and Technical Considerations
Weak or absent signals: Increase exosomal protein load (up to 20μg); optimize antibody concentrations; use higher sensitivity substrates; check transfer efficiency [21] [30].
High background: Increase blocking time; optimize antibody concentrations; increase wash stringency (increase TWEEN concentration to 0.1%); include additional washes [21].
Non-specific bands: Validate antibody specificity; include appropriate controls; try different antibody clones [21].
Inconsistent results between replicates: Ensure consistent sample preparation; avoid repeated freeze-thaw cycles; use fresh aliquots of reagents [21].
Contamination indicators: Presence of calnexin suggests ER contamination; cytochrome C indicates mitochondrial contamination; albumin suggests serum contamination [13] [28].
Transmission Electron Microscopy (TEM) is a cornerstone imaging modality in the field of nanomedicine and regenerative medicine, providing high-resolution details of subcellular components within cells and tissues [31]. For researchers characterizing mesenchymal stem cell-derived exosomes (MSC-exosomes), TEM is indispensable for confirming ultrastructural morphology, a critical parameter alongside size distribution and surface markers in comprehensive exosome characterization [11] [15]. This Application Note details standardized protocols for TEM imaging of MSC-exosomes and the subsequent quantitative analysis of organelle morphology, providing a framework for generating accurate, reproducible data on exosome and cellular ultrastructure.
TEM Sample Preparation and Imaging for MSC-Exosomes
The following protocol describes the preparation, staining, and imaging of exosomes for TEM analysis to confirm their identity and purity.
Materials
- Exosome Sample: Purified MSC-exosomes in suspension.
- Grids: Copper or nickel TEM grids with Formvar/carbon support film.
- Contrast Agents: 1–2% Uranyl acetate solution or other negative stains.
- Filter Paper: Absorbent, lint-free.
- Phosphate Buffered Saline (PBS): For dilution and washing.
- Transmission Electron Microscope.
Detailed Protocol
- Grid Preparation: Glow-discharge the TEM grids immediately before use to render them hydrophilic, ensuring even sample spreading.
- Sample Application: Pipette a small volume (e.g., 5–10 µL) of the exosome suspension onto the parlo-dion film-covered surface of the TEM grid. Allow the sample to adhere for 1–10 minutes in a hydrated environment to prevent drying [11] [15].
- Staining: Without letting the grid dry, carefully wick away excess liquid using the edge of a filter paper. Immediately apply a drop of 1–2% uranyl acetate solution to the grid for 30–60 seconds to negatively stain the sample [11].
- Final Wash: Wick away the excess stain and gently wash with a drop of distilled water. Allow the grid to air-dry completely before proceeding to imaging [15].
- Imaging: Insert the grid into the TEM. Image the sample at appropriate accelerating voltages (e.g., 80–120 kV). Examine multiple grid squares to obtain a representative overview of the sample. Capture images of vesicles exhibiting the characteristic cup-shaped morphology at various magnifications [15] [32].
Table 1: Troubleshooting Guide for TEM of Exosomes
| Problem | Potential Cause | Solution |
|---|---|---|
| Poor Contrast | Insufficient staining | Increase stain concentration or incubation time. |
| Sample Aggregation | High exosome concentration or salt content | Dilute sample or desalt using size-exclusion chromatography. |
| Broken or Folded Grids | Improper handling | Use fine-tipped forceps and handle grids by the edge only. |
| No Exosomes Visible | Low exosome concentration, inefficient binding | Concentrate sample; use glow-discharged grids to improve adhesion. |
Quantitative Morphological Analysis of Organelles from TEM Images
TEM is widely used to study the ultrastructure of organelles in a variety of healthy and diseased cells and tissues [31]. Quantifying visible changes in organelle morphology, such as in mitochondria and endoplasmic reticulum (ER), is crucial for investigating metabolic disorders and other disease pathologies [31]. The following protocol outlines a standardized approach for analyzing TEM images using the open-source software ImageJ/Fiji.
Image Acquisition and Preparation
- Blinding and Randomization: To perform unbiased morphometric analysis, images should be collected and quantified in a blinded and randomized manner [31].
- Magnification: Acquire low magnification images to provide context of the whole cell, alongside higher magnification images for detailed organelle analysis [31].
- Calibration: Calibrate images in ImageJ using the scale bar from TEM micrographs to ensure all measurements are in accurate physical units (e.g., nm, µm).
Systematic ImageJ Analysis
The analysis relies on the coordinate system of the digital image, where each pixel is assigned a horizontal and vertical coordinate. Any straight line can be defined by two pixels, p1 = (x1, y1) and p2 = (x2, y2) [31]. Key morphological parameters are calculated as follows:
- Length (L): The Euclidean distance between two pixels, calculated using the Pythagorean Theorem [31].
- Formula: L(p1, p2) = √(x1 - x2)² + (y1 - y2)²
- Area:
- Rectangle: Area = L1 × L2, where L1 and L2 are the lengths of the sides.
- Circle: Area = π(LD/2)², where LD is the diameter measured by selecting two opposite pixels on the circle.
- Perimeter:
- Rectangle: Perimeter = 2 × (L1 + L2)
- Circle: Perimeter = π × L_D
- Circularity Index (Cᵢ): A measure of how circular an object is, where a value of 1.0 indicates a perfect circle.
- Formula: Cᵢ = 4π × Area / (Perimeter)²
- Volume Estimation: The surface area of substructure features can be divided by the area of the structure (SA:A) to provide an estimate of volume [31].
This analysis can be applied to assess mitochondrial length, width, area, circularity, cristae morphology, and interactions between mitochondria and the endoplasmic reticulum (ER) [31].
Key Measurements for Organelle Analysis
Table 2: Key Morphological Parameters for Organelle Analysis via TEM and ImageJ
| Organelle/Structure | Measurable Parameters | Biological Significance |
|---|---|---|
| Mitochondria | Length, width, area, circularity | Indicates metabolic state, health, and involvement in apoptosis [31]. |
| Mitochondrial Cristae | Density, morphology | Linked to efficiency of oxidative phosphorylation and apoptosis [31]. |
| Endoplasmic Reticulum (ER) | Membrane length, surface area | Reflects protein synthesis load and calcium storage capacity [31]. |
| Mito-ER Contacts (MERCs) | Number, proximity | Important for lipid transfer, calcium signaling, and apoptosis regulation [31]. |
| Exosomes/Vesicles | Diameter, morphology | Confirms exosomal identity and sample quality [11] [15] [32]. |
The Scientist's Toolkit: Essential Research Reagents and Materials
Table 3: Key Research Reagent Solutions for TEM and Western Blot Characterization
| Item | Function | Example(s) / Notes |
|---|---|---|
| Formvar/Carbon Grids | Provide a support film for holding the exosome/cell sample in the TEM vacuum. | Copper or nickel grids; often glow-discharged to increase hydrophilicity. |
| Uranyl Acetate | Negative stain that enhances contrast by scattering electrons away from the stain itself. | 1-2% aqueous solution; handle with appropriate safety precautions [11]. |
| Transfer Membrane | Immobilizes proteins after gel electrophoresis for Western blotting. | Nitrocellulose or PVDF membranes [33]. |
| Blocking Buffer | Reduces non-specific antibody binding in Western blotting. | 5% non-fat milk or commercial fluorescent blocking buffers (e.g., Blocker FL) [33]. |
| Chemiluminescent Substrate | Generates light signal upon reaction with HRP-conjugated antibodies for Western blot detection. | SuperSignal West Pico PLUS, West Femto, etc. Sensitivity varies [33]. |
| Exosomal Marker Antibodies | Confirm exosome identity via Western blot. | Antibodies against CD9, CD63, CD81, TSG101, and ALIX [11] [15]. |
This Application Note provides detailed protocols for leveraging TEM to visualize and quantify the ultrastructure of MSC-exosomes and subcellular organelles. By standardizing sample preparation, imaging, and image analysis using tools like ImageJ, researchers can generate robust, quantitative data on exosome morphology and organelle features. This rigorous approach to characterization is fundamental for correlating morphological findings with functional outcomes in MSC-exosome research, thereby advancing their therapeutic development.
The comprehensive characterization of mesenchymal stem cell-derived exosomes, often referred to more broadly as small extracellular vesicles (sEVs), is fundamental to advancing their therapeutic application. Individually, common characterization techniques provide valuable but limited insights: Nanoparticle Tracking Analysis (NTA) quantifies size and concentration, Western Blot confirms the presence of specific protein markers, and Transmission Electron Microscopy (TEM) visualizes morphology and integrity. However, no single technique can provide a complete profile of these complex nanoparticles, whose properties vary significantly based on MSC source, culture conditions, and isolation methods [11] [15]. Relying on a single method risks incomplete or misleading conclusions, potentially compromising the safety and efficacy of exosome-based therapies. This application note details a standardized, integrated workflow that synergistically combines data from NTA, Western Blot, and TEM to generate a coherent, reliable, and comprehensive profile of MSC-exosomes, thereby supporting rigorous research and robust therapeutic development.
Individual Technique Profiles: Role, Outputs, and Limitations
Nanoparticle Tracking Analysis (NTA)
NTA operates by tracking the Brownian motion of individual particles in a suspension using light scattering, allowing for simultaneous determination of particle size distribution and concentration [34] [35]. This technique is indispensable for quantifying the yield of exosome preparations, a critical parameter for dosing in therapeutic applications [11] [3].
Table 1: Characteristic Outputs and Limitations of NTA for MSC-exosome Analysis
| Profile Aspect | Typical Output for MSC-exosomes | Inherent Technique Limitations |
|---|---|---|
| Size Distribution | Peak size of 107-131 nm, with a main population of 30-150 nm [11] [15] | Cannot distinguish exosomes from similarly sized contaminants like protein aggregates [35] |
| Particle Concentration | Varies with source and isolation; e.g., 6.9e7 to 1.2e8 particles/mL for BMSC/UMSC/ADSC-exosomes [15] | Sample must be diluted to a dynamic range of ~107-109 particles/mL [34] |
| Sample Purity Indicator | High particle concentration relative to protein is an indicator of purity [36] | Provides no information on the biochemical composition or origin of the particles |
Protocol Summary:
- Sample Preparation: Dilute purified exosome sample in sterile, particle-free PBS to achieve a concentration within the instrument's optimal detection range (e.g., 107-109 particles/mL) [34] [35].
- Instrument Operation: Inject sample into the NTA viewing chamber. Ensure the system is properly calibrated with size standard beads (e.g., 100 nm). Capture multiple 30-60 second videos of particle movement.
- Data Analysis: Use the instrument's software to analyze the Brownian motion in the captured videos, which calculates the hydrodynamic diameter and concentration for each tracked particle. Report the mean, mode, and concentration.
Western Blot
Western Blot is a fundamental biochemical technique used to detect specific protein antigens within an exosome sample. It is crucial for verifying the exosomal nature of the preparation by confirming the presence of canonical markers and the absence of contaminants [11].
Table 2: Characteristic Markers for Western Blot Analysis of MSC-exosomes
| Marker Category | Specific Targets | Interpretation of Positive Result |
|---|---|---|
| Tetraspanins (Enriched Surface Markers) | CD9, CD63, CD81 [11] [15] [37] | Confirms the vesicle is of endosomal origin and belongs to the exosome/sEV category. |
| ESCRT-Associated Proteins | ALIX, TSG101 [11] [15] [37] | Indicates involvement of the endosomal sorting complex in the vesicle's biogenesis pathway. |
| Negative Markers (Exclusion Criteria) | Calnexin (endoplasmic reticulum protein), Apolipoproteins [11] | Confirms the sample is not significantly contaminated with cellular debris or non-vesicular components. |
Protocol Summary:
- Sample Lysis: Lyse exosome pellet with RIPA buffer containing protease inhibitors.
- Electrophoresis: Separate proteins by molecular weight using SDS-PAGE gel electrophoresis.
- Membrane Transfer: Transfer separated proteins from the gel onto a nitrocellulose or PVDF membrane.
- Immunodetection: Sequentially incubate the membrane with:
- Primary antibody (e.g., mouse anti-CD63, rabbit anti-TSG101).
- HRP-conjugated secondary antibody (e.g., goat anti-mouse IgG).
- Signal Visualization: Apply chemiluminescent substrate and capture the signal using a digital imager.
Transmission Electron Microscopy (TEM)
TEM provides high-resolution images that confirm the classic morphology of exosomes and assess their structural integrity. It is the only technique in the standard workflow that offers a direct visual assessment of the preparation [11] [38].
Table 3: TEM Characterization of MSC-exosomes
| Assessment Aspect | Expected Observation for Intact MSC-exosomes | Deviations and Potential Causes |
|---|---|---|
| Morphology | Cup-shaped or spherical structures with a visible lipid bilayer [11] [15] [38] | Irregular shapes or broken membranes may indicate sample degradation or preparation artifacts. |
| Size Range | Diameters typically between 30-150 nm, consistent with NTA data [15] [37] | Significant discrepancies with NTA size may indicate aggregation or instrument calibration issues. |
| Sample Purity | A field of view populated predominantly by uniformly sized vesicles. | Presence of large, irregularly shaped particles or protein aggregates suggests contamination. |
Protocol Summary (Negative Staining):
- Sample Application: Apply 3-5 µL of purified exosome suspension to a freshly glow-discharged carbon-coated Formvar grid for 1-2 minutes [38].
- Negative Staining: Wick away excess liquid with filter paper. Apply a drop of 1-2% uranyl acetate solution for 1-2 minutes to stain the background.
- Grid Drying: Wick away the stain and allow the grid to air-dry completely.
- Imaging: Observe the grid under the TEM at an accelerating voltage of 80-100 kV. Capture images at various magnifications to assess morphology and size.
The Integrated Workflow: From Data Collection to Coherent Profile
The power of this approach lies in the synergistic interpretation of data from all three techniques. The following workflow diagram and subsequent correlation guide illustrate how to build a coherent profile.
Diagram 1: Integrated sEV characterization workflow. The workflow requires congruent data from all three core techniques (NTA, Western Blot, TEM) to build a single, validated sEV profile.
Data Correlation and Interpretation Guide
A coherent profile is established when the data from all three techniques are congruent and mutually reinforcing.
Table 4: Correlation Guide for an Integrated MSC-exosome Profile
| Technique | Primary Data | Correlation with Other Techniques | Interpretation of a Coherent Profile |
|---|---|---|---|
| NTA | Peak size: ~100-130 nm; Polydispersity: Low. | Size distribution should align with diameters measured in TEM images. | Confirms a homogeneous population of nanoparticles of the expected size. |
| Western Blot | Positive for CD9, CD63, TSG101; Negative for Calnexin. | TEM confirms the particles visualized are vesicles, not aggregates. NTA concentration justifies protein load on gel. | Validates that the nanoparticles are bona fide exosomes with minimal contaminating proteins. |
| TEM | Cup-shaped vesicles with intact membranes; size ~100 nm. | Observed morphology and size range should match the identity (WB) and size (NTA) data. | Provides visual proof of a pure, structurally intact exosome preparation. |
Troubleshooting Incoherent Data
Discrepancies between techniques are not failures but opportunities to identify issues with the sample or method.
- NTA reports a larger size peak than TEM: This often indicates sample aggregation or the presence of non-vesicular contaminants (e.g., protein complexes) that are detected by NTA but can be distinguished from vesicles by TEM [35].
- Positive Western Blot markers but low NTA particle count: This suggests a low yield of exosomes, potentially with co-isolation of soluble proteins or debris that provide a strong WB signal but few intact particles.
- TEM shows irregular/broken structures: This may indicate sample degradation during isolation or storage, or an artifact from the staining process. The NTA polydispersity index is often high in such cases.
The Scientist's Toolkit: Essential Reagents and Materials
Table 5: Key Research Reagent Solutions for MSC-exosome Characterization
| Item/Category | Specific Examples & Details | Primary Function in Workflow |
|---|---|---|
| Cell Culture Media | Alpha-MEM (α-MEM), DMEM, supplemented with human platelet lysate (hPL) [11] | Culture medium for MSC expansion; α-MEM may support higher sEV yields [11]. |
| sEV Isolation Kits/Reagents | Total Exosome Isolation Kit (from plasma/serum) [38], qEV size-exclusion columns [39] | Rapid and standardized isolation of sEVs from complex biofluids or conditioned media. |
| sEV Isolation Equipment | Ultracentrifuge, Tangential Flow Filtration (TFF) system [11] | Large-scale, GMP-compatible isolation; TFF gives higher particle yields than UC [11]. |
| NTA System | NanoSight NS300 (Malvern Panalytical) [34] | Measures particle size distribution and concentration in liquid suspension. |
| TEM Stains | 1-2% Uranyl Acetate solution [38] | Negative stain contrast agent for visualizing sEV morphology under electron microscopy. |
| sEV Positive Marker Antibodies | Anti-CD63, Anti-CD9, Anti-TSG101, Anti-ALIX [11] [15] [37] | Primary antibodies for Western Blot to confirm the exosomal identity of the sample. |
| sEV Negative Marker Antibodies | Anti-Calnexin [11] | Primary antibody for Western Blot to assess contamination from cellular compartments. |
The path to successful MSC-exosome therapeutics is paved with rigorous characterization. By implementing this integrated workflow—where NTA provides quantitative metrics, Western Blot confirms biochemical identity, and TEM validates morphology—researchers can generate a coherent and defensible profile of their exosome preparations. This multi-faceted approach mitigates the limitations of any single technique, ensures reproducibility, and builds the foundational data required for preclinical development and regulatory approval. As the field advances, this core workflow can be further expanded with omics technologies and functional assays to fully elucidate the therapeutic potential of MSC-exosomes.
Solving Common Pitfalls and Enhancing Reproducibility in Exosome Characterization
Nanoparticle Tracking Analysis (NTA) has become an indispensable tool for the characterization of extracellular vesicles (EVs), including mesenchymal stem cell-derived exosomes (MSC-Exos), due to its ability to provide particle size distribution and concentration measurements in liquid suspension. However, the analysis of complex biological samples presents significant challenges, particularly concerning sample polydispersity and the presence of non-vesicular contaminants. These challenges can compromise data accuracy and reliability, especially in the context of therapeutic development where precise characterization is critical [40] [38].
This application note outlines the specific limitations of NTA when applied to polydisperse MSC-Exos preparations and provides detailed, optimized protocols to overcome these challenges. We frame these solutions within a multi-technique validation framework incorporating Western Blot and Transmission Electron Microscopy (TEM), essential for comprehensive exosome characterization as required in advanced thesis research [7] [41].
Key Challenges in NTA of MSC-Exos
The accurate analysis of MSC-Exos using NTA is hindered by several inherent technical and sample-related limitations, as detailed in the table below.
Table 1: Key Challenges in NTA of MSC-Exos and Their Implications
| Challenge | Underlying Cause | Impact on Data Quality |
|---|---|---|
| Polydisperse Samples | Presence of particles across a wide size range (e.g., 30 nm to 500 nm for MSC-EVs) [7]. | Underestimation of smaller particles due to lower scattering intensity and signal overlapping from larger particles [40]. |
| Non-Vesicular Contaminants | Co-isolation of proteins, lipoproteins, and other biological nanoparticles during extraction [7]. | Overestimation of exosome concentration; inaccurate size profiling due to inability to chemically discriminate particle types [40] [42]. |
| Detection Threshold Limitations | Dependence on light scattering properties; refractive index and particle composition affect signal [40]. | Particles with a refractive index similar to the medium (e.g., certain silica nanoparticles) may be undetectable, biasing results [43] [40]. |
Integrated Methodological Solutions
Pre-Analytical Sample Preparation
The foundation of reliable NTA data lies in obtaining a purified exosome sample. The following workflow integrates separation techniques to reduce polydispersity and contaminants prior to NTA measurement.
Detailed Protocols:
Differential Ultracentrifugation (UC):
- Principle: Sequential centrifugation at increasing speeds to pellet particles based on size and density [7].
- Protocol:
- Centrifuge culture supernatant at (2,000 \times g) for 30 min at 4°C to remove dead cells and large debris.
- Transfer supernatant to a fresh tube and centrifuge at (10,000 \times g) for 45 min at 4°C to pellet larger microvesicles and organelles.
- Transfer the resulting supernatant to ultracentrifugation tubes. Pellet exosomes by centrifuging at (\geq 100,000 \times g) for 70-120 min at 4°C.
- Critical Note: Multiple ultracentrifugation cycles can damage exosomes. Resuspend the final pellet gently in a large volume of filtered PBS (e.g., 0.22 µm filter) [7].
Size-Exclusion Chromatography (SEC):
- Principle: Separates particles based on hydrodynamic volume; larger exosomes elute before smaller proteins and contaminants [7] [38].
- Protocol:
- Pack a chromatography column with a suitable matrix (e.g., Sepharose CL-2B or Sephacryl S-400).
- Equilibrate the column with 2-3 bed volumes of filtered PBS or a compatible buffer.
- Load the sample (e.g., the resuspended UC pellet) onto the column.
- Elute with PBS and collect fractions. The first few fractions, typically turbid, contain the exosomes, followed by fractions containing soluble proteins [7].
Combined AEC-SEC for Enhanced Purity:
- Principle: A two-dimensional purification strategy leveraging differences in both surface charge and size.
- Protocol: Concentrate the sample via ultrafiltration. First, perform AEC using a column with a positively charged stationary phase to bind negatively charged exosomes. Elute with an increasing salt gradient. Then, apply the eluent to an SEC column as described above to remove salt and further separate particles by size [7].
Instrument Optimization and Data Acquisition
Optimizing NTA settings is crucial for accurate analysis, especially for polydisperse samples.
Table 2: NTA Instrument Optimization Guide for MSC-Exos
| Parameter | Challenge | Optimization Strategy |
|---|---|---|
| Camera Level | Low signal for small particles; saturation for large/ bright particles. | Start with a low level (e.g., 12-14) and increase until particle centers are clearly discernible without "blooming." |
| Detection Threshold | Influences which particles are tracked; high threshold biases against small/ dim particles. | Set to a level that captures the majority of visible particles. Manually verify that tracking boxes align with particles on screen. |
| Sample Concentration | High concentration leads to multiple scattering and particle tracking errors. | Dilute sample to achieve 20-100 particles per frame. Use filtered PBS for dilution [40]. |
| Measurement Mode | Static mode may not represent the entire sample population. | Use the flow mode (if available) to analyze a larger sample volume, improving statistical representation and reducing sampling bias [40]. |
orthogonal Validation Techniques
NTA data must be validated using orthogonal techniques that provide complementary information on exosome identity, morphology, and composition.
1. Western Blot (WB) for Protein-Specific Confirmation
- Purpose: Confirm the presence of exosome-specific marker proteins (e.g., CD63, CD81, Alix) and the absence of negative markers (e.g., calnexin) [44] [38].
- Automated Protocol (JESS Simple Western): This capillary-based system automates size separation, immunodetection, and imaging, saving time and improving reproducibility [44].
- Dilute exosome samples to 0.1-0.5 mg/mL total protein.
- Mix 3 µL of sample with a fluorescent master mix.
- Load primary antibodies against target markers (e.g., anti-CD63 at 1:50 dilution) and a housekeeping protein like GAPDH for normalization.
- The system automatically performs all subsequent steps, providing digital quantification of the results [44].
2. Transmission Electron Microscopy (TEM) for Morphological Analysis
- Purpose: Visualize exosome morphology, confirm bilayer membrane structure, and provide high-resolution size data [45] [38].
- Negative Staining Protocol:
- Glow-discharge a formvar/carbon-coated copper EM grid for 1 minute to make it hydrophilic.
- Fix the exosome sample with 2% PFA for 5 minutes.
- Apply 5-7 µL of the fixed sample to the grid and incubate for 1 minute.
- Wick away excess liquid with filter paper.
- Immediately stain with ~20 drops of filtered 1% uranyl acetate (UA) solution.
- Remove excess UA and briefly rinse with a drop of water.
- Air-dry the grid and image using a TEM at 80 kV [45].
- Automated Image Analysis: To overcome the labor-intensive nature of manual TEM analysis, use an ImageJ plugin (e.g., "EV finder") for (semi-)automated quantification of EV diameter from micrographs, which increases objectivity and throughput [38].
The Scientist's Toolkit: Research Reagent Solutions
Table 3: Essential Reagents and Kits for MSC-Exos Characterization
| Item/Category | Specific Example | Function in Workflow |
|---|---|---|
| Isolation Kit | Total Exosome Isolation Kit (from plasma/serum) [38] | Precipitation-based enrichment of EVs from biofluids; rapid, low-speed centrifugation alternative to UC. |
| Chromatography Media | Sepharose CL-2B (for SEC) [7] | Porous beads for size-based separation of exosomes from contaminating proteins. |
| Antibodies for WB/IP | Anti-CD63, Anti-L1CAM (for neuron-derived EVs) [38] | Immunological confirmation of exosome identity (WB) or subpopulation isolation (Immunoprecipitation). |
| NTA Standards | Polystyrene Nanospheres (e.g., 102 ± 3 nm) [40] | Instrument calibration and validation of NTA measurement accuracy and precision. |
| Automated WB System | JESS Simple Western (ProteinSimple) [44] | Fully automated, capillary-based Western blotting; reduces hands-on time, improves reproducibility and sensitivity. |
Optimizing NTA for the analysis of MSC-Exos requires a holistic strategy that addresses pre-analytical, analytical, and post-analytical stages. By implementing the integrated purification workflows, rigorous instrument optimization, and orthogonal validation techniques detailed in this application note, researchers can significantly improve the accuracy and reliability of their exosome characterization data. This comprehensive approach is fundamental for advancing the therapeutic development of MSC-derived exosomes, ensuring that critical quality attributes are properly defined and controlled.
In the characterization of mesenchymal stem cell (MSC) exosomes, Western blotting stands as a critical technique for confirming the presence of specific protein markers and assessing exosome purity. This technique, alongside Nanoparticle Tracking Analysis (NTA) and Transmission Electron Microscopy (TEM), forms the foundational triad for comprehensive exosome characterization [13] [46] [11]. However, the reliability of Western blot data is highly dependent on antibody specificity and optimal protocol execution. Inconsistencies, such as false positives or negatives, can compromise data interpretation and derail research progress, particularly in the high-stakes field of therapeutic exosome development [47] [48]. This application note provides detailed protocols and troubleshooting strategies to enhance the rigor and reproducibility of your Western blot experiments within MSC exosome research.
The Critical Role of Antibody Validation
The foundation of a reliable Western blot experiment is a highly specific antibody. Unfortunately, the scientific community faces a significant reproducibility crisis, with independent studies finding that over half of commercially available antibodies do not perform as advertised for their intended applications [48]. A non-specific antibody can generate misleading results, such as multiple non-specific bands, high background, or a complete lack of signal, leading to incorrect conclusions about protein expression in your MSC exosomes.
Strategies for Selecting and Validating Antibodies
- Review Application-Specific Validation Data: Always consult the manufacturer's datasheet for validation data that matches your intended application (e.g., Western blot). Reliable data should show a clear, specific band at the correct molecular weight with minimal background [48].
- Leverage Third-Party Data: Consult independent validation initiatives like YCharOS, CiteAb, and Only Good Antibodies (OGA). These resources provide unbiased assessments of antibody performance [48].
- Use Appropriate Controls: Include both positive and negative control lysates in your experiment. A positive control (e.g., lysate from cells overexpressing the target protein) confirms the protocol works. A negative control (e.g., lysate from knockout cells) checks for non-specific binding and false positives [49].
Table 1: Key Controls for Western Blot Experiments
| Control Type | Description | Purpose | Examples for MSC Exosomes |
|---|---|---|---|
| Positive Control | Lysate from a sample known to express the target protein. | Verifies the staining protocol is successful and provides expected sensitivity/specificity. | Cell lysate from the parental MSC line; purified recombinant exosomal marker protein (e.g., CD63). |
| Negative Control | Lysate from a sample known not to express the target protein. | Checks for non-specific antibody binding (false positives). | Lysate from exosome-depleted culture supernatant; lysate from cells with the target gene knocked out. |
| Loading Control | Antibody against a ubiquitously and consistently expressed protein. | Normalizes for total protein loaded across lanes. | β-actin, GAPDH, or Calnexin (negative marker for exosome purity) [47] [13]. |
The diagram below outlines a logical workflow for antibody selection and validation to ensure reliable results.
Troubleshooting False Positives and Negatives
Even with a validated antibody, technical issues can lead to inaccurate results. The table below summarizes common causes and solutions for false positives and negatives.
Table 2: Troubleshooting Guide for False Positives and Negatives
| Problem | Potential Causes | Recommended Solutions |
|---|---|---|
| False Positives / Multiple Bands | Non-specific antibody binding; protein degradation; post-translational modifications (PTMs) [47] [49]. | Use knockout-validated antibodies [48]; include protease inhibitors during sample prep [49]; review literature for known PTMs or splicing variants [49]. |
| High Background | Inadequate membrane blocking; excessive antibody concentration; overexposure during detection [49]. | Extend blocking time; optimize antibody dilution via gradient testing; incubate primary antibody at 4°C overnight; reduce exposure time [49]. |
| No or Weak Signal | Target protein not expressed or low abundance; insufficient lysis; inefficient transfer; expired reagents [49]. | Use a high-quality positive control; increase sample load; optimize lysis buffer (e.g., for membrane/nuclear proteins); check transfer efficiency with Ponceau S; use fresh detection reagents [49]. |
| Inconsistent Band Intensity | Inconsistent protein loading or transfer; uneven antibody incubation [49] [50]. | Improve protein quantification method; ensure even washing and incubation; use a fluorescent Western blot system for more accurate quantification [50]. |
The Internal Reference Trap
A major pitfall in quantitative Western blotting is the poor selection of loading controls. Housekeeping proteins like β-actin and GAPDH can change expression under certain experimental conditions, such as MSC differentiation or exosome biogenesis [47]. This "internal reference trap" can lead to normalization errors and misinterpretation of data.
- Solution: Always validate the stability of your loading control under your specific experimental conditions. Consider using multiple internal references or tissue-specific standards to ensure accurate normalization [47].
Detailed Protocol for Western Blot of MSC Exosomes
The following protocol is adapted from methodologies used in recent MSC exosome research [13] [46] [11].
Sample Preparation
- Exosome Lysis: Resuspend purified exosome pellets (isolated via ultracentrifugation or TFF [11]) in a suitable RIPA lysis buffer supplemented with a broad-spectrum protease and phosphatase inhibitor cocktail. Incubate on ice for 30 minutes.
- Protein Quantification: Determine protein concentration using a micro-Bradford or BCA assay, following the manufacturer's instructions [46] [50]. Use bovine serum albumin (BSA) to generate a standard curve.
- Sample Denaturation: Mix protein lysate with Laemmli sample buffer. A common practice is to use a 1:4 or 1:5 ratio of sample buffer to lysate. Heat the samples at 95°C for 5-10 minutes to denature the proteins.
Gel Electrophoresis and Transfer
- Gel Loading: Load an equal amount of total protein (e.g., 10-20 µg) per lane into a precast polyacrylamide gel (e.g., 10-20% Tris-HCl gel). Include molecular weight markers and appropriate controls (see Table 1).
- Counterbalancing: To account for gel-running artifacts, use a randomized block design by distributing samples from different experimental groups across the gel [50].
- Electrophoresis: Run the gel at a constant voltage (e.g., 100-120V) until the dye front reaches the bottom of the gel.
- Protein Transfer: Transfer proteins from the gel to a PVDF or nitrocellulose membrane using a wet or semi-dry transfer system. Ensure PVDF membrane is pre-soaked in methanol. Confirm transfer efficiency by staining the membrane with Ponceau S.
Immunoblotting
- Blocking: Block the membrane with 5% non-fat dry milk or BSA in TBST (Tris-Buffered Saline with 0.1% Tween-20) for 1 hour at room temperature with gentle agitation.
- Primary Antibody Incubation: Dilute the validated primary antibody in blocking buffer or TBST. Incubate the membrane with the antibody solution overnight at 4°C with gentle shaking. (Refer to the datasheet for optimal dilution).
- Washing: Wash the membrane 3-4 times for 5-10 minutes each with TBST.
- Secondary Antibody Incubation: Dilute the HRP- or fluorescently-conjugated secondary antibody in blocking buffer. Incubate the membrane for 1 hour at room temperature with gentle shaking.
- Washing: Repeat the washing step as after primary antibody incubation.
Detection and Analysis
- Detection: For chemiluminescence, incubate the membrane with an ECL substrate and image using a digital imaging system. For fluorescence, scan the membrane at the appropriate wavelengths.
- Quantification: Use imaging software (e.g., ImageJ, Image Studio Lite) to quantify band intensity. For rigorous quantification, characterize the linear range of your antibody and use statistical models that treat loading controls as covariates and technical replicates as random effects to maximize reproducibility and power [50].
The Scientist's Toolkit: Research Reagent Solutions
Table 3: Essential Materials for Western Blot Characterization of MSC Exosomes
| Reagent / Material | Function | Example & Notes |
|---|---|---|
| Positive Control Lysate | Confirms antibody specificity and protocol success. | Lysate from HEK293 cells overexpressing CD63/CD81; or parental MSC lysate. |
| Negative Control Lysate | Identifies non-specific antibody binding. | Lysate from exosome-depleted serum; or CRISPR knockout cell line for target protein. |
| Validated Antibodies | Specific detection of target and loading control proteins. | Use knockout-validated antibodies for exosomal markers (CD9, CD63, CD81, TSG101) [48]. Calnexin is used as a negative marker for exosome purity [13]. |
| Protease Inhibitors | Prevents protein degradation during sample prep. | Added to lysis buffer to maintain protein integrity and prevent artifactual bands [49]. |
| Phosphatase Inhibitors | Preserves protein phosphorylation states. | Crucial for detecting phosphorylated signaling proteins in pathway analysis. |
| Chemiluminescent/Fluorescent Substrate | Enables visualization of target proteins. | Choose based on sensitivity and linear range requirements. Fluorescent detection allows for multiplexing [51] [50]. |
Robust Western blot data is indispensable for the accurate characterization of MSC exosomes. By implementing rigorous antibody validation, incorporating essential controls, and following optimized protocols, researchers can significantly reduce false positives and negatives. This diligence enhances the reproducibility of your findings and strengthens the overall validity of your research in the rapidly advancing field of exosome biology and therapeutics.
Transmission Electron Microscopy (TEM) is an indispensable tool in the characterization of mesenchymal stem cell-derived small extracellular vesicles (MSC-sEVs), enabling researchers to visualize their morphology, size, and structural integrity at the nanoscale. This technique provides critical data that complements other analytical methods like Nanoparticle Tracking Analysis (NTA) and Western blotting, forming a comprehensive characterization pipeline essential for therapeutic development [11]. The value of TEM data, however, is profoundly dependent on the quality of sample preparation and the rigor of subsequent image analysis. Artifacts introduced during preparation can obscure true morphological features, leading to misinterpretation, while advanced quantitative analysis can unlock precise, picometer-scale measurements of structural properties [52] [53]. This document details standardized protocols for TEM sample preparation of MSC-sEVs, outlines common artifacts and their mitigation, and introduces quantitative approaches for image analysis, providing a foundational framework for researchers in the field of regenerative medicine and drug development.
Sample Preparation Protocols for MSC-sEVs
Proper sample preparation is the critical first step in obtaining reliable TEM data. The following protocols ensure high-quality, electron-transparent specimens.
Negative Staining Protocol for Rapid Morphological Assessment
Negative staining is a quick and effective method for initial morphological evaluation of MSC-sEVs. It provides high-contrast images suitable for verifying the cup-shaped morphology typical of sEVs [11].
- Objective: To rapidly visualize the size and morphology of isolated MSC-sEVs.
- Workflow:
- Glow Discharge: Place a carbon-coated Formvar grid on a glow discharge system for 30-60 seconds to render the surface hydrophilic.
- Sample Application: Pipette 5-10 µL of the MSC-sEV suspension (approximately 1-5 µg/mL protein concentration) onto the grid. Allow it to adhere for 1-2 minutes.
- Washing: Remove excess liquid with filter paper. Rinse by applying 3-5 drops of distilled water, removing excess after each drop.
- Staining: Apply 3-5 drops of 1-2% uranyl acetate solution. After 30-60 seconds, remove the excess stain completely with filter paper.
- Drying: Let the grid air-dry thoroughly in a clean, dust-free environment.
- Storage: Store the prepared grid in a grid box at room temperature until imaging.
- Key Considerations: Over-staining can obscure fine details, while under-staining results in poor contrast. Ensure the sample is free of salts and buffers that can form crystalline artifacts upon drying.
Cryo-Electron Microscopy (Cryo-EM) Protocol for Native State Visualization
Cryo-EM preserves MSC-sEVs in a vitrified, hydrated state, allowing for observation in their native conformation without chemical fixation or staining [54].
- Objective: To visualize the native structure and contents of MSC-sEVs in a hydrated state.
- Workflow:
- Vitrification: Use a vitrification device (e.g., Vitrobot). Apply 3-5 µL of MSC-sEV suspension to a quantifoil grid.
- Blotting: Blot away excess liquid with filter paper for 2-5 seconds in a chamber with high humidity ( > 90%).
- Plunging: Rapidly plunge the grid into a cryogen (liquid ethane) cooled by liquid nitrogen. This instantaneously vitrifies the sample.
- Storage and Transfer: Transfer the vitrified grid under liquid nitrogen to a cryo-TEM holder.
- Imaging: Image the sample at a temperature below -170 °C using low-dose techniques to minimize radiation damage.
- Key Considerations: Sample concentration and homogeneity are crucial. The process requires specialized equipment and expertise but provides the most structurally faithful images.
FIB-SEM for Lamella Preparation of Complex Samples
For analyzing MSC-sEVs within or interacting with larger structures or cells, Focused Ion Beam-Scanning Electron Microscopy (FIB-SEM) enables the site-specific preparation of ultra-thin lamellae for TEM analysis [53].
- Objective: To create an electron-transparent cross-section from a specific region of interest, such as a cell that has internalized MSC-sEVs.
- Workflow:
- Site Selection & Protection: Identify the region of interest using SEM imaging. Deposit a protective layer (e.g., platinum) over the site.
- Coarse Milling: Use a high-current gallium ion beam to mill away material on both sides of the protected site, creating a thin lamella ( ~1 µm thick) still attached to the bulk.
- Lift-Out & Mounting: Weld a nanomanipulator probe to the lamella, cut it free, and transfer it to a specialized TEM grid.
- Final Thinning & Polishing: Thin the lamella to electron transparency (typically <100 nm) using progressively lower ion currents. A final low-energy polish (≤5 kV) removes the damaged surface layer [53].
- Key Considerations: This method is complex and instrumentation-heavy but is unparalleled for targeted cross-sectional analysis. Ion beam damage must be minimized through careful polishing.
The following workflow summarizes the key decision points and steps in the sample preparation journey.
Common TEM Artifacts and Mitigation Strategies
Misinterpretation of TEM images can occur due to artifacts introduced during sample preparation and imaging. The table below outlines common artifacts, their causes, and corrective actions.
Table 1: Common TEM Artifacts in MSC-sEV Imaging and Mitigation Strategies
| Artifact | Appearance | Primary Cause | Corrective Action |
|---|---|---|---|
| Aggregation | Clusters of sEVs forming large, irregular clumps. | Salt concentration or buffer incompatibility during grid preparation. | Desalt sample using size-exclusion chromatography or dialysis into volatile buffers (e.g., ammonium acetate) [7]. |
| Structural Collapse | Flattened, distorted vesicles that lack a rounded morphology. | Air-drying of unstained samples; electron beam damage. | Use cryo-EM for native state preservation. For negative staining, ensure a thin, even stain layer. Employ low-dose imaging techniques [54]. |
| Precipitated Stain | Electron-dense crystals or amorphous aggregates on the grid. | Incomplete removal of excess stain or presence of salts in the buffer. | Ensure thorough washing with distilled water after sample application. Use highly purified uranyl acetate and filter if necessary. |
| Knife Marks/Scratches | Parallel lines or scratches across the image field. | Improper sectioning with an ultramicrotome (for resin-embedded samples). | Use a sharper diamond knife and optimize sectioning speed and angle. |
| Contamination | Non-biological, amorphous material or hydrocarbons on the grid surface. | Dirty forceps, grid boxes, or buildup in the TEM column. | Plasma clean grids before use. Handle grids with care and store properly. Regularly clean the TEM column [53]. |
Quantitative Image Analysis for Atomic-Resolution TEM
Beyond qualitative assessment, advanced computational analysis extracts quantitative data from TEM images with high precision. These methods synergize real and reciprocal space information.
Fourier Damping for Mapping Symmetry-Breaking Distortions
This approach is powerful for detecting and quantifying picometer-scale structural distortions, such as periodic lattice displacements, by leveraging the separation of signals in Fourier space [52].
- Objective: To measure minute atomic column displacements associated with symmetry-breaking distortions.
- Protocol:
- Acquire & Fourier Transform: Obtain a high-resolution STEM image and compute its 2D Fourier Transform (FT).
- Identify Superlattice Peaks: In the FT magnitude, identify the peaks corresponding to the symmetry-breaking distortion (superlattice peaks), which are distinct from the parent lattice peaks.
- Damp Superlattice Peaks: The amplitude of these superlattice peaks is digitally dampened to the background level, while their phase information is left unchanged.
- Generate Reference Image: Compute the inverse FT of the modified FT. This results in a high-symmetry reference image where the distortion is suppressed.
- Quantify Displacements: Compare the original and reference images. The vector between an atomic column's position in the reference image and its position in the original image defines the displacement caused by the distortion [52].
Real-Space Wave Fitting for Lattice Parameter and Strain Quantification
This method provides absolute quantification of lattice parameter variations and local strain by fitting filtered image signals in real space [52].
- Objective: To measure variations in inter-planar spacings and calculate local strain with picometer precision.
- Protocol:
- Fourier Filtering: Compute the FT of the STEM image. Apply a bandpass filter to select a specific set of lattice planes (a single Bragg peak or a small range of peaks).
- Inverse Fourier Transform: Transform the filtered FT back to real space. This generates a complex image where the wave-like signal's phase corresponds to the local atomic displacement.
- Wave Fitting: Fit a sinusoidal wave or a more complex model to the filtered signal at different locations in the image.
- Parameter Extraction: From the fitted waves, extract the local periodicity (wavelength), which directly gives the inter-planar spacing. Compare this to a reference spacing to calculate local strain [52].
Computational Contrast Enhancement for Noisy Images
For low-dose images required for radiation-sensitive biological samples, computational methods can enhance contrast without increasing the experimental dose [54].
- Objective: To improve the signal-to-noise ratio and contrast in low-dose TEM/ET images to facilitate alignment and analysis.
- Protocol (Based on WLS Filter):
- Multi-scale Decomposition: Process the input image using a Weighted Least Squares (WLS) edge-preserving filter at different scales. This decomposes the image into a base layer and detail layers.
- Detail Boosting: Apply a sigmoidal boosting function (e.g., y = 1/(1+e⁻ᵃˣ) - 0.5) to the extracted detail layers. This enhances fine features without amplifying noise.
- Image Recomposition: Combine the boosted detail layers with the original base layer to generate the final contrast-enhanced image [54]. This method has been shown to increase SNR by over 60% in simulated cryo-EM images.
The logical flow of a quantitative image analysis pipeline, integrating these techniques, is depicted below.
The Scientist's Toolkit: Research Reagent Solutions
Table 2: Essential Materials and Reagents for TEM Analysis of MSC-sEVs
| Item | Function/Description | Example Use Case |
|---|---|---|
| Carbon-Formvar Grids | EM grids with a plastic support film and a thin carbon coating, providing a stable, conductive substrate for the sample. | Standard support for negative staining and cryo-EM. |
| Uranyl Acetate (1-2%) | A heavy metal salt used as a negative stain; scatters electrons strongly, creating contrast by embedding the background. | Negative staining protocol for rapid morphological assessment of MSC-sEVs. |
| Vitrification System | Instrument (e.g., Vitrobot) for automated blotting and plunging of EM grids into cryogens to achieve vitreous ice. | Preparation of hydrated, native-state MSC-sEV samples for cryo-EM. |
| FIB-SEM System | Dual-beam instrument combining a focused ion beam for milling and an SEM for high-resolution imaging. | Site-specific preparation of thin lamellae from cells containing internalized sEVs. |
| Size-Exclusion Chromatography (SEC) Columns | Chromatography media that separates particles based on hydrodynamic volume. | Desalting and buffer exchange of MSC-sEV samples prior to grid preparation to prevent aggregation artifacts [7]. |
| Human Platelet Lysate (hPL) | Xeno-free supplement for MSC culture media; influences MSC growth and the yield of subsequently produced sEVs [11]. | Culture expansion of parental MSCs prior to sEV collection. |
| Open-Source Analysis Software (e.g., kemstem) | Python package providing implementations of algorithms for quantitative STEM image analysis, including Fourier damping and strain analysis. | Quantifying picometer-scale distortions and lattice strains in high-resolution images [52]. |
The Impact of Isolation Methods and Cell Culture Conditions on Characterization Outcomes
For researchers and drug development professionals working with mesenchymal stem cell (MSC)-derived exosomes, the journey from cell culture to characterized vesicles is fraught with technical challenges. The isolation methodology and cell culture environment directly influence critical quality attributes of exosomes, including particle concentration, size distribution, surface marker expression, and ultimately, biological function and therapeutic potency [9] [11]. This application note provides a detailed experimental framework for investigating these relationships, consolidating current best practices and quantitative insights to enhance reproducibility in exosome research.
The inherent variability in MSC-exosome profiles stems from multiple sources. While preconditioning strategies like hypoxia or cytokine exposure can modulate therapeutic miRNA content (e.g., miR-146a, miR-181a), the foundational steps of cell culture and vesicle isolation introduce significant technical variability that must be controlled to isolate biologically relevant signals [8]. Furthermore, the lack of standardized protocols across the field complicates direct comparison between studies, underscoring the need for internally consistent and well-documented experimental workflows [9] [12].
Impact of Isolation Methods on Exosome Yield and Characteristics
The choice of isolation technique is a critical determinant of the yield, purity, and physicochemical properties of harvested exosomes. A comparative evaluation of common methods reveals significant differences in performance metrics.
Table 1: Comparative Analysis of Exosome Isolation Methods
| Isolation Method | Reported Average Particle Size (nm) | Key Performance Findings | Advantages | Limitations |
|---|---|---|---|---|
| Tangential Flow Filtration (TFF) | 142.8 ± NA [55] | Significantly higher particle yield compared to Ultracentrifugation (UC) [11]. | High yield, scalable, suitable for processing large volumes of conditioned media [55]. | Requires specialized equipment. |
| Ultracentrifugation (UC) | 114.16 ± 14.82 (DMEM)107.58 ± 24.64 (α-MEM) [11] | Considered a classical method; lower yield versus TFF [11]. | Widely used and considered a gold standard; no requirement for specialized reagents. | Time-consuming, lower yield, potential for particle aggregation or damage [11]. |
| Differential Ultracentrifugation | 30-150 [56] | Most widely used method for research purposes [56]. | Accessibility, common in research settings. | Co-isolation of non-exosomal material, time-intensive [56]. |
Experimental Protocol: Comparative Isolation of MSC-Exosomes
Objective: To isolate exosomes from conditioned media of human bone marrow-derived MSCs (BM-MSCs) using TFF and UC, and compare the yield, size, and marker expression.
Materials:
- Conditioned media from BM-MSCs (Passage 4-6)
- Tangential Flow Filtration (TFF) system (e.g., Minimate TFF System)
- Ultracentrifuge with fixed-angle rotor
- Polycarbonate bottles and ultracentrifuge tubes
- Phosphate Buffered Saline (PBS), pH 7.4
- 0.22 µm PES syringe filters
Procedure for TFF Isolation [55]:
- Clarification: Centrifuge the collected conditioned medium at 300×g for 10 minutes to remove cells and debris. Filter the supernatant through a 0.22 µm filter.
- Concentration: Process the clarified medium through the TFF system with a 100 kDa molecular weight cut-off capsule. Maintain a feed flow rate of approximately 2.5 mL/min.
- Diafiltration: Concentrate the sample to approximately 20 mL, then diafilter with 5 volumes of PBS to exchange the buffer.
- Final Concentration: Further concentrate the sample to a final volume of 1-2 mL.
- Storage: Aliquot the concentrated exosomes and store at -80°C.
Procedure for UC Isolation [11]:
- Clarification: Centrifuge conditioned media at 2,000×g for 20 minutes to remove cells and debris. Transfer supernatant to fresh tubes.
- Concentration: Centrifuge the supernatant at 10,000×g for 30 minutes at 4°C to pellet larger vesicles. Filter the resulting supernatant through a 0.22 µm filter.
- Ultracentrifugation: Transfer the filtered supernatant to ultracentrifuge tubes. Pellet exosomes at 100,000×g for 70 minutes at 4°C.
- Washing: Carefully discard the supernatant and resuspend the pellet in a large volume of PBS. Perform a second ultracentrifugation at 100,000×g for 70 minutes at 4°C.
- Resuspension: Discard the supernatant and gently resuspend the final exosome pellet in 100-200 µL of PBS.
- Storage: Aliquot and store at -80°C.
Figure 1: Workflow for comparative isolation of exosomes using Tangential Flow Filtration (TFF) and Ultracentrifugation (UC).
Influence of Cell Culture Conditions on MSC-Exosomes
The culture conditions of parent MSCs significantly impact their proliferative capacity and the subsequent yield of secreted exosomes.
Table 2: Impact of Cell Culture Conditions on MSCs and Exosome Production
| Culture Parameter | Conditions Compared | Key Observations | Implications for Exosome Production |
|---|---|---|---|
| Culture Medium | α-MEM vs. DMEM(Both supplemented with 10% hPL) [11] | Higher expansion ratio and lower population doubling time in α-MEM, though not statistically significant. Average particle yield per cell was higher in α-MEM (4,318.72 ± 2,110.22) vs. DMEM (3,751.09 ± 2,058.51). | α-MEM may be superior for scalable production, yielding more vesicles per cell. |
| Cell Passage | Passage 3 to Passage 6 [11] | Cell population doubling time extended with increasing passage. No significant differences in exosome size or yield per cell between passages. | Later passages remain viable for exosome production, but slower cell growth affects total biomass. |
| Preconditioning | Hypoxia, LPS, TNF-α, IL-1β [8] | Alters miRNA cargo profile (e.g., upregulation of miR-146a, miR-181a-5p). Enhances immunomodulatory potential. | A strategy to functionally tailor exosomes for specific therapeutic applications. |
Experimental Protocol: Optimizing Culture Conditions for BM-MSCs
Objective: To culture BM-MSCs in different media and precondition them to modulate exosome secretion and cargo.
Materials:
- Bone Marrow-derived MSCs (Passage 3)
- DMEM and α-MEM culture media
- 10% Human Platelet Lysate (hPL)
- 1% Penicillin/Streptomycin
- Preconditioning agents: LPS (0.1-1 µg/mL), TNF-α (10-20 ng/mL)
- T-175 culture flasks
- CO₂ incubator (37°C, 5% CO₂)
Procedure:
- Cell Seeding: Seed BM-MSCs at a density of 3,000 cells/cm² in T-175 flasks.
- Media Comparison: Culture cells in parallel using DMEM and α-MEM, both supplemented with 10% hPL and 1% P/S.
- Cell Passaging: Monitor cells and passage upon reaching 80-90% confluency. Record population doubling times.
- Preconditioning:
- Once cells reach 70% confluency, replace the medium with fresh medium containing the preconditioning agent (e.g., 0.1 µg/mL LPS or 10 ng/mL TNF-α) [8].
- Incubate for 24-48 hours.
- Collection of Conditioned Media: For exosome isolation, collect media from preconditioned and control cells after 48 hours. Use exosome-depleted FBS or human platelet lysate during this phase to avoid bovine exosome contamination [55].
Figure 2: Experimental workflow for evaluating the impact of culture media and preconditioning on MSC-exosomes.
Essential Characterization Techniques for MSC-Exosomes
Comprehensive characterization of isolated exosomes is mandatory to confirm their identity, purity, and physicochemical properties. The Minimal Information for Studies of Extracellular Vesicles (MISEV) guidelines recommend a multimodal approach.
Nanoparticle Tracking Analysis (NTA)
Purpose: To determine the particle size distribution and concentration in the exosome preparation [11] [12].
Protocol:
- Sample Preparation: Dilute the exosome sample in sterile, particle-free PBS to achieve an ideal concentration of 10⁸-10⁹ particles/mL for analysis.
- Instrument Calibration: Calibrate the NTA instrument (e.g., Malvern NanoSight) using silica microspheres of known size (e.g., 100 nm).
- Measurement: Load the diluted sample into the instrument chamber. Record five videos of 60 seconds each from different captured positions.
- Data Analysis: Use the integrated software to calculate the mode and mean particle size, and the particle concentration. Report the total yield (particles) and normalize it to the number of parent cells or the volume of conditioned media.
Western Blotting
Purpose: To detect the presence of exosomal marker proteins and confirm the absence of contaminants [55] [57].
Protocol:
- Protein Extraction: Lyse exosomes in RIPA buffer containing protease inhibitors.
- Protein Quantification: Determine protein concentration using a BCA assay.
- Gel Electrophoresis: Load 20-30 µg of exosomal protein per lane on a 4-12% Bis-Tris protein gel. Run electrophoresis at 120-150 V.
- Membrane Transfer: Transfer proteins from the gel to a PVDF membrane.
- Antibody Probing: Incubate the membrane with primary antibodies against exosome markers: CD63 (1:1000), CD81 (1:1000), TSG101 (1:1000), and Alix (1:1000). Also, probe for a negative marker, such as Calnexin (1:1000), which should be absent in pure exosome preps.
- Detection: Incubate with appropriate HRP-conjugated secondary antibodies and develop using an enhanced chemiluminescence (ECL) substrate. Image the blot.
Transmission Electron Microscopy (TEM)
Purpose: To visualize the morphology and ultrastructure of exosomes, confirming their classic cup-shaped appearance [55] [57].
Protocol:
- Sample Adsorption: Apply 10 µL of exosome suspension to a carbon-coated copper grid for 1 minute.
- Staining: Wick away excess liquid with filter paper. Negative stain the grid with 10 µL of 2% uranyl acetate solution for 1 minute. Wick away the excess stain.
- Drying: Air-dry the grid completely.
- Imaging: Observe the grid under a transmission electron microscope operating at 80-100 kV. Capture images at various magnifications.
The Scientist's Toolkit: Key Research Reagent Solutions
Table 3: Essential Reagents and Kits for MSC-Exosome Research
| Reagent / Kit | Function / Application | Example Use Case |
|---|---|---|
| Exosome-depleted FBS | Serum supplement for cell culture that is depleted of bovine exosomes to minimize contamination of MSC-exosome preparations. | Essential for producing conditioned media for exosome isolation [55]. |
| Human Platelet Lysate (hPL) | Xeno-free supplement for MSC culture media, can be used as an alternative to FBS. | Supports scalable expansion of MSCs under GMP-compliant conditions [11]. |
| CD63, CD81, CD9 Antibodies | Primary antibodies for detection of tetraspanins, common exosome surface markers, via Western Blot or Flow Cytometry. | Critical for immunoblotting characterization of isolated vesicles [55] [57] [12]. |
| TSG101, Alix Antibodies | Primary antibodies for detection of exosome luminal and ESCRT-related markers via Western Blot. | Confirms endosomal origin of vesicles [57] [11]. |
| RNeasy Mini Kit / BCA Assay Kit | For isolating total RNA from exosomes / For quantifying total protein concentration from exosome lysates. | Standard downstream analysis of exosomal cargo (RNA, protein) [55]. |
| Collagenase Type I | Enzyme for tissue digestion to isolate primary cells, such as MSCs from epidural fat. | Initial isolation of MSCs from source tissues [55]. |
This application note establishes that isolation methods and culture conditions are non-ignorable variables in MSC-exosome research. The data demonstrates that TFF outperforms UC in particle yield, favoring scalable production, while culture in α-MEM promotes higher exosome output than DMEM. Preconditioning emerges as a powerful strategy for functionally tailoring exosomes. Adhering to the detailed protocols for isolation, culture, and—critically—multimodal characterization (NTA, Western Blot, TEM) is fundamental for generating reproducible, high-quality data. This rigorous approach is a prerequisite for advancing the therapeutic translation of MSC-exosomes, ensuring that observed biological effects are attributable to the vesicles themselves and not to methodological artifacts.
Beyond the Basics: Cross-Validation with Complementary Techniques and Clinical Translation
The comprehensive characterization of mesenchymal stem cell (MSC)-derived exosomes is a critical step in validating their identity, purity, and functionality for therapeutic applications. No single analytical method can provide a complete picture of these heterogeneous nanoparticles; instead, a multi-modal approach is required. This application note details how the triangulated data from Nanoparticle Tracking Analysis (NTA), Western Blot (WB), and Transmission Electron Microscopy (TEM) correlate and complement each other to provide a robust characterization profile. Adherence to this multi-parameter framework is essential for ensuring the reproducibility and reliability of research findings, ultimately supporting the advancement of MSC exosomes in drug development.
Individual Technique Profiles and Experimental Protocols
Nanoparticle Tracking Analysis (NTA)
Principle: NTA utilizes light scattering and Brownian motion to determine the size distribution and concentration of particles in a liquid suspension [58] [59].
Detailed Protocol:
- Sample Preparation: Thaw the MSC exosome suspension on ice. Dilute the sample in sterile, particle-free phosphate-buffered saline (PBS) to achieve a concentration within the optimal detection range of the instrument (typically 1 × 10^7 to 1 × 10^8 particles/mL) [58].
- Instrument Calibration: Calibrate the NTA instrument (e.g., ZetaView PMX120 or NanoSight LM10) using standardized latex beads of known size (e.g., 100 nm) [60].
- Measurement: Using a syringe, introduce the diluted sample into the instrument's flow cell. Set the pre-acquisition parameters to a sensitivity of 80, a shutter speed of 100, and a frame rate of 30 frames per second [60].
- Data Acquisition and Analysis: Capture video recordings of particles moving under Brownian motion at 11 distinct positions within the flow cell. The software will track each particle, calculating its hydrodynamic diameter based on its diffusion rate and deriving the particle concentration from the count [60]. Report the mode and mean size, along with the total particle concentration.
Western Blot (WB)
Principle: WB detects specific protein antigens within a complex sample, confirming the presence of characteristic exosome markers and assessing sample purity.
Detailed Protocol:
- Protein Extraction and Quantification: Lyse the exosome pellet with RIPA buffer. Quantify the total protein concentration using a bicinchoninic acid (BCA) assay kit [58] [59].
- Gel Electrophoresis: Load an equal amount of protein (e.g., 10 µg) for each sample onto a 4-20% polyacrylamide gel. Separate the proteins by electrophoresis at a constant voltage [60].
- Protein Transfer: Transfer the separated proteins from the gel to a polyvinylidene fluoride (PVDF) membrane using a wet or semi-dry transfer system.
- Immunoblotting: Block the membrane with 5% non-fat milk or Everyblot blocking buffer for 1-2 hours at room temperature [58] [60]. Incubate the membrane with primary antibodies overnight at 4°C. Common positive markers for exosomes include CD9, CD63, CD81, Flotillin-1, and TSG101 [58] [11]. A negative marker, such as Calnexin (an endoplasmic reticulum protein), should also be included to assess contamination by non-exosomal proteins [58].
- Detection: After washing, incubate the membrane with horseradish peroxidase (HRP)-conjugated secondary antibodies for 1 hour at room temperature. Use an enhanced chemiluminescence (ECL) detection system to visualize the protein bands [58].
Transmission Electron Microscopy (TEM)
Principle: TEM provides high-resolution images to confirm the morphology and ultrastructure of exosomes.
Detailed Protocol (Negative Staining):
- Sample Preparation: Dilute the exosome suspension in PBS or 0.9% NaCl [38].
- Grid Preparation: Apply 3-10 µL of the sample onto a freshly glow-discharged, carbon-coated copper grid. Allow it to adsorb for 1-10 minutes at room temperature [58] [38].
- Staining: Wick away excess liquid with filter paper. Carefully add 10 µL of a 2% uranyl acetate solution to the grid for 1 minute to negatively stain the sample [58].
- Imaging: After drying, visualize the grid using a transmission electron microscope (e.g., JEOL 1011 or Hitachi H-7650) operated at 80 kV [58] [59]. MSC exosomes should appear as cup-shaped, circular, or elliptical vesicles with a diameter of approximately 30-150 nm [58] [11].
Table 1: Key Research Reagent Solutions for MSC Exosome Characterization
| Reagent/Kit | Function | Example from Literature |
|---|---|---|
| Total Exosome Isolation Kit | Precipitates exosomes from culture supernatant or biofluids for downstream analysis. | Used for EV enrichment from plasma and serum [59] [38]. |
| Size Exclusion Chromatography (SEC) Columns | Isolates EVs based on size, reducing protein contamination. | qEV10/35nm columns used for EV isolation from lymphatic drain fluid [60]. |
| Primary Antibodies (CD9, CD63, CD81) | Detect tetraspanins, which are characteristic exosome surface markers, via Western Blot. | Antibodies from CST used to identify synovial tissue-derived exosomes [58]. |
| Dynamic Light Scattering (DLS) Instrument | Measures particle size distribution in a solution, an alternative to NTA. | Zetasizer Nano ZS used for EV size measurement [59]. |
| Human Platelet Lysate (hPL) | A xeno-free supplement for MSC culture media to produce clinical-grade exosomes. | Used as a serum supplement in BM-MSC culture [11]. |
Data Correlation and Complementary Insights
The synergy between NTA, WB, and TEM transforms individual data points into a cohesive and validated characterization dataset.
Size and Morphology: NTA and TEM
NTA and TEM offer complementary data on exosome size. NTA provides a population-averaged hydrodynamic diameter in their native state, typically showing a main peak for MSC exosomes around 100-120 nm [58] [11]. In contrast, TEM provides high-resolution, individual particle images that confirm the expected cup-shaped morphology and a size range of 30-150 nm, but on a smaller, statistically limited number of particles that may be slightly deformed due to staining and vacuum conditions [58] [11]. The correlation between the mode size from NTA and the size distribution observed by TEM validates the sample's homogeneity.
Identity and Purity: WB and NTA
Western Blot is indispensable for confirming the molecular identity of exosomes through the detection of positive protein markers (e.g., CD9, CD63, TSG101) and the absence of negative markers (e.g., Calnexin) [58] [11]. This data directly complements NTA. A high particle count from NTA coupled with strong expression of exosomal markers and low contamination in WB indicates a highly pure and authentic exosome preparation. Conversely, a high particle count with weak exosomal markers or strong Calnexin signal suggests a sample contaminated with non-exosomal particles or cellular debris, which would be overlooked by NTA alone [58].
Concentration and Integrity: NTA and TEM
While NTA excels at quantifying particle concentration, it cannot distinguish between intact exosomes and other nanoparticles of similar size, such as protein aggregates or lipoprotein particles. TEM directly addresses this limitation by visually confirming the presence of intact, lipid-bilayer vesicles. The combination of a high particle concentration (from NTA) with the visual confirmation of a high proportion of morphologically intact vesicles (from TEM) provides strong evidence for a sample with both high yield and integrity [58] [59].
Table 2: Correlation and Complementarity of NTA, Western Blot, and TEM
| Aspect | NTA Data | WB Data | TEM Data | Correlated Interpretation |
|---|---|---|---|---|
| Size | Mean/Mode diameter; size distribution profile [58]. | N/A | Direct measurement of individual particle diameter from images [58]. | Confirms population size (NTA) matches individual particle size and expected range (TEM). |
| Concentration | Particle concentration (particles/mL) [58]. | N/A | Qualitative assessment of particle density on grid. | Quantifies yield; TEM can alert to non-vesicular contaminants that inflate NTA count. |
| Morphology | N/A | N/A | Confirms cup-shaped, round, or elliptical morphology [58] [11]. | Validates the classic exosome structure. |
| Molecular Identity | N/A | Detection of positive markers (CD9, CD63, TSG101) [58] [11]. | N/A | Confirms the vesicles are exosomes and not other extracellular vesicles. |
| Purity | Can be skewed by protein aggregates or debris. | Absence of negative markers (e.g., Calnexin) [58]. | Can reveal co-isolated contaminants (e.g., protein crystals). | WB and TEM identify contaminants that NTA would count as particles. |
Integrated Experimental Workflow and Data Synthesis
A logical, sequential workflow is key to efficient and accurate exosome characterization. The following diagram synthesizes the steps from cell culture to a final, multi-technique assessment, showing how the data from each technique feeds into an overall conclusion.
For researchers and drug development professionals, relying on a single characterization method is insufficient for the rigorous analysis of MSC-derived exosomes. The techniques of NTA, Western Blot, and TEM are not interchangeable but are intrinsically complementary. Their combined application creates a powerful triangulated framework that provides quantitative data on size and concentration, qualitative assessment of morphology, and biochemical validation of identity and purity. Adopting this multi-parameter approach, as detailed in these application notes and protocols, is a fundamental prerequisite for generating high-quality, reproducible, and reliable data that will accelerate the translation of MSC exosome research into clinical therapeutics.
The transition of mesenchymal stem cell (MSC)-derived exosomes from research tools to therapeutic candidates necessitates a paradigm shift in analytical characterization. While traditional techniques like Nanoparticle Tracking Analysis (NTA), Western blot, and Transmission Electron Microscopy (TEM) provide fundamental information about size, marker expression, and morphology, they offer limited insights into molecular composition and functional potency. Proteomic profiling, Asymmetric-Flow Field Flow Fractionation coupled with Multi-Angle Light Scattering (AF4-MALS), and Size-Exclusion Chromatography with Multi-Angle Light Scattering (SEC-MALS) have emerged as critical advanced techniques that address these gaps. These methods enable researchers to deconstruct exosome heterogeneity, quantify critical quality attributes (CQAs), and establish robust batch-to-batch quality control protocols essential for clinical translation [61] [62] [63].
The integration of these orthogonal approaches provides a comprehensive characterization framework. Proteomics deciphers the protein cargo responsible for exosome function, while AF4-MALS and SEC-MALS resolve subpopulations and quantify impurities in native conditions. This application note details standardized protocols for implementing these techniques within MSC exosome research and development workflows.
Proteomic Profiling of MSC Exosomes
Principles and Applications
Proteomic characterization identifies and quantifies the protein composition of MSC exosomes, directly linking molecular cargo to biological activity. This is crucial for understanding mechanism of action, lot consistency, and stability. A key study on human umbilical cord MSC (hUC-MSC) exosomes identified 807 unique proteins across different donors and passages, with 676 proteins consistently shared across batches [61]. Bioinformatics analysis revealed enrichment in pathways including complement and coagulation cascades, platelet activation, and the synaptic vesicle cycle, the latter suggesting a potential mechanism for treating neurological conditions like Alzheimer's disease [61]. Furthermore, comparative proteomics demonstrates that the isolation method (e.g., ultracentrifugation vs. high-speed centrifugation) significantly impacts the proteomic profile, isolating distinct exosome subpopulations with different biological functions [64].
Detailed Experimental Protocol: Quantitative Proteomics
Objective: To identify and quantify the protein composition of MSC-derived exosomes and perform comparative analysis.
Materials and Reagents:
- Lysis Buffer: 8 M Urea, 2 M Thiourea, 50 mM Tris-HCl (pH 8.0)
- Reduction/Alkylation: 10 mM Dithiothreitol (DTT), 50 mM Iodoacetamide (IAA)
- Digestion: Sequencing-grade modified trypsin/Lys-C mix, 50 mM Ammonium Bicarbonate
- Desalting: C18 Solid-Phase Extraction (SPE) cartridges
- LC-MS/MS: LC system coupled to a tandem mass spectrometer (e.g., Q-Exactive HF-X, TimsTOF Pro)
Procedure:
- Exosome Solubilization: Resuspend purified exosome pellets (50-100 µg protein) in 100 µL of lysis buffer. Vortex and incubate on ice for 30 minutes.
- Protein Reduction and Alkylation: Add DTT to a final concentration of 10 mM and incubate at 37°C for 1 hour. Then, add IAA to 50 mM and incubate in the dark at room temperature for 30 minutes.
- Protein Digestion: Dilute the sample with 50 mM ammonium bicarbonate to reduce urea concentration below 2 M. Add trypsin/Lys-C mix at a 1:50 (w/w) enzyme-to-protein ratio and incubate at 37°C for 16 hours. Quench the reaction with 1% formic acid.
- Peptide Clean-up: Desalt the digested peptides using C18 SPE cartridges according to the manufacturer's instructions. Elute peptides with 50% acetonitrile/0.1% formic acid, dry in a vacuum concentrator, and reconstitute in 0.1% formic acid for MS analysis.
- LC-MS/MS Analysis:
- Chromatography: Load 1 µg of peptides onto a C18 reversed-phase nanoLC column. Separate using a gradient from 2% to 35% mobile phase B (0.1% formic acid in acetonitrile) over 120 minutes at a flow rate of 300 nL/min.
- Mass Spectrometry: Acquire data in Data-Independent Acquisition (DIA) mode. Full MS scans should be acquired at a resolution of 120,000, followed by MS2 scans with staggered isolation windows covering the 400-1000 m/z range.
- Data Processing: Process raw data using spectral library-based software (e.g., Spectronaut, DIA-NN). Search data against a human protein database. Set false discovery rate (FDR) to <1% at both peptide and protein levels.
Data Analysis: Perform label-free quantification to compare protein abundance across samples. Use bioinformatics tools (e.g., Gene Ontology, KEGG pathway analysis) for functional annotation. Statistical analysis (e.g., t-tests, ANOVA) should be applied to identify significantly differentially expressed proteins.
Table 1: Key Proteins Identified in hUC-MSC Exosomes and Their Potential Functions
| Protein Name | Abbreviation | Function in Exosomes | Therapeutic Association |
|---|---|---|---|
| Adaptor-related protein complex 2 subunit alpha 1 | AP2A1 | Synaptic vesicle cycle, endocytosis | Alzheimer's Disease [61] |
| Adaptor-related protein complex 2 subunit beta 1 | AP2B1 | Synaptic vesicle cycle, endocytosis | Alzheimer's Disease [61] |
| Tetraspanin-29 | CD63 | Exosome surface marker, cargo selection | General exosome marker [61] [22] |
| Tetraspanin-81 | CD81 | Exosome surface marker, adhesion | General exosome marker [61] [22] |
| Endoplasmin | HSP90B1 | Molecular chaperone, protein folding | Stress response, immunomodulation |
| Flotillin-1 | FLOT1 | Lipid raft component, endocytosis | Exosome biogenesis marker |
Research Reagent Solutions for Proteomics
Table 2: Essential Reagents for MSC Exosome Proteomic Workflow
| Reagent / Kit | Function / Application | Key Characteristics |
|---|---|---|
| Urea/Thiourea Lysis Buffer | Protein solubilization and denaturation | Strong chaotropic agents for efficient membrane protein extraction |
| Trypsin/Lys-C Mix | Proteolytic digestion | High sequencing-grade purity for specific cleavage |
| C18 Desalting Cartridges | Peptide clean-up | Removes salts and detergents post-digestion |
| Iodoacetamide (IAA) | Cysteine alkylation | Alkylates thiol groups to prevent reformation of disulfide bonds |
| Dithiothreitol (DTT) | Disulfide bond reduction | Reduces cysteine residues before alkylation |
| TMT or iTRAQ Reagents | Isobaric labeling for multiplexed quantitation | Enables simultaneous analysis of multiple samples in one MS run |
Diagram 1: Proteomic analysis workflow for MSC exosomes.
AF4-MALS for High-Resolution Exosome Separation
Principles and Applications
Asymmetric-Flow Field Flow Fractionation (AF4) is a gentle, chromatography-like separation technique that resolves nanoparticles based on their hydrodynamic size in solution, without a stationary phase. The separation occurs in a thin, open channel where a cross-flow field pushes particles against a semi-permeable membrane. Smaller particles, with higher diffusion coefficients, equilibrate higher in the channel where the parabolic flow is faster, and thus elute first. This makes AF4 uniquely suited for separating delicate biological nanoparticles like exosomes, minimizing shear stress and aggregation [62].
Coupling AF4 to Multi-Angle Light Scattering (MALS) allows for the simultaneous determination of multiple critical attributes from the size-resolved fractions. MALS measures the root-mean-square radius (Rg, or radius of gyration), while an inline Dynamic Light Scattering (DLS) detector can measure the hydrodynamic radius (Rh). The ratio of Rg/Rh (shape factor) provides insights into particle morphology and structure [62]. This multi-detector setup (AF4-MALS-DLS) is powerful for analyzing exosome heterogeneity, detecting subpopulations, and characterizing aggregates or co-isolated impurities like lipoproteins.
Detailed Experimental Protocol: AF4-MALS-DLS Analysis
Objective: To separate a crude MSC exosome preparation by size and determine the molar mass, size, and dispersity of each resolved population.
Materials and Instrumentation:
- AF4 System (e.g., Wyatt Technology, Postnova)
- MALS Detector (e.g., Wyatt DAWN HELEOS II)
- DLS Detector (e.g., Wyatt DynaPro Nanostar)
- UV/Vis Detector
- Separation Channel: Short channel (for 1-50 nm particles) with 10 kDa polyethersulfone (PES) membrane
- Mobile Phase: 0.1 µm filtered 25 mM Tris-HCl, 150 mM NaCl, pH 7.4 (PBS can be used as an alternative)
- Sample: 50-100 µL of MSC exosomes (0.5-1.0 mg/mL protein concentration)
Procedure:
- System Preparation: Degas and filter the mobile phase. Prime the AF4 system and equilibrate the channel at initial conditions for at least 30 minutes. Ensure MALS and DLS detectors are normalized and calibrated according to manufacturer specifications.
- Method Programming:
- Focusing/Injection Step (5 min): Inject the sample with an tip flow of 0.2 mL/min and a cross-flow of 1.5 mL/min. This focuses the sample into a sharp band at the beginning of the channel.
- Elution Step (45 min): Initiate a linear cross-flow gradient from 1.5 mL/min to 0.1 mL/min over 40 minutes, with a constant tip flow of 0.5 mL/min. This elutes particles from smallest to largest.
- Elution Step (5 min): Maintain a constant cross-flow of 0.1 mL/min to elute any very large particles or aggregates.
- Purge Step (10 min): Set cross-flow to 0 mL/min to flush the channel completely.
- Sample Run: Inject the sample and start the method. Monitor the elution in real-time via UV (e.g., 280 nm), MALS, and DLS signals.
- Data Analysis: Use specialized software (e.g., Astra, NOVA) to analyze the data. The MALS data is used to calculate absolute molar mass and Rg for each elution slice. The DLS data provides Rh. Plot the distributions of these parameters against elution time to visualize the resolved populations.
Key Parameters for MSC Exosomes: The main exosome population (typically ~50-150 nm) should elute as a monodisperse peak. The method can resolve smaller non-vesicular proteins (early elution) and larger aggregates or microvesicles (late elution). The weight-average molar mass and polydispersity index (ĐM) can be calculated for the main peak to assess batch homogeneity [62].
Table 3: AF4-MALS Data Interpretation for MSC Exosomes
| Eluting Fraction | Typical Rg (nm) | Typical Rh (nm) | Rg/Rh Ratio | Probable Identity |
|---|---|---|---|---|
| Early / Void Peak | <10 | <5 | ~1.0 | Soluble proteins, lipoprotein contaminants |
| Main Peak | 40-80 | 50-100 | ~0.7 - 0.8 | Monodisperse exosomes (spherical vesicles) |
| Late Eluting Peak | >100 | >120 | >0.8 | Exosome aggregates, large microvesicles |
Diagram 2: AF4-MALS-DLS setup for exosome characterization.
SEC-MALS for Rapid Purity and Size Assessment
Principles and Applications
Size-Exclusion Chromatography coupled with Multi-Angle Light Scattering (SEC-MALS) is a high-resolution technique for assessing exosome purity, size, and molar mass. SEC separates particles based on their hydrodynamic volume as they pass through a porous stationary phase. When coupled with MALS, UV, and Refractive Index (RI) detectors, it provides an orthogonal method to AF4 for characterizing exosomes in their native state.
A primary application of SEC-MALS in MSC exosome quality control is the quantification of soluble protein impurities. A study demonstrated that SEC-MALS, with UV detection, could quantitatively evaluate non-vesicular protein contaminants in exosome preparations from human adipose-derived MSCs [63]. Furthermore, SEC-MALS showed higher resolution in particle size distribution analysis compared to NTA and batch DLS. The online separation step prevents large particles from dominating the signal, allowing for a more accurate assessment of size heterogeneity and the detection of co-isolated lipoproteins [63].
Detailed Experimental Protocol: SEC-MALS Purity and Size Analysis
Objective: To separate exosomes from soluble protein impurities and determine the absolute size, molar mass, and protein contamination level of the preparation.
Materials and Instrumentation:
- HPLC system with autosampler
- MALS Detector (e.g., Wyatt miniDAWN TREOS)
- UV/Vis Detector
- Refractive Index (RI) Detector
- SEC Column: Aqueous, large pore size column (e.g., 300-500 Å, 10-15 µm particles) such as Agilent AdvanceBio SEC or Tosoh TSKgel
- Mobile Phase: 0.1 µm filtered 25 mM Tris-HCl, 150 mM NaCl, pH 7.4
Procedure:
- System Equilibration: Filter and degas the mobile phase. Connect the SEC column and equilibrate the system at a flow rate of 0.5 mL/min for at least 1 hour or until a stable RI and light scattering baseline is achieved.
- Detector Calibration: Normalize the MALS detector and calibrate the RI detector according to the manufacturer's guidelines. Determine the inter-detector delay volume and band broadening parameters.
- Sample Preparation and Injection: Centrifuge the exosome sample (or thaw from -80°C) and clarify by low-speed centrifugation (2,000 x g, 10 min) to remove any large aggregates. Load 50 µL of sample (0.2-1.0 mg/mL protein) onto the column via the autosampler.
- Chromatography: Isocratically elute the sample with mobile phase at 0.5 mL/min for 30 minutes.
- Data Analysis: In the analysis software (e.g., Astra):
- Identify the exosome peak (early eluting, high MALS signal) and the soluble protein peak (late eluting, high UV signal).
- Calculate the absolute molar mass and Rg of the exosome peak from the MALS signal, independent of elution volume.
- Use the UV peak area of the soluble protein fraction relative to the total UV area to quantify the percentage of protein impurity.
Key Outcomes: A pure exosome preparation will show a dominant, monodisperse peak in the MALS signal that elutes in the void or shortly after. A significant UV peak eluting later indicates the presence of soluble protein contaminants. The molar mass of MSC exosomes typically ranges from several hundred MDa to a few GDa [63].
Research Reagent Solutions for Chromatography
Table 4: Essential Materials for AF4 and SEC-MALS of MSC Exosomes
| Material / Instrument | Function / Application | Key Characteristics |
|---|---|---|
| Polyethersulfone (PES) Membrane (10 kDa) | AF4 channel membrane | Retains exosomes while allowing buffer and salts to pass |
| Large Pore Size SEC Column | Size-based separation of exosomes | Pore size ~300-500 Å; compatible with aqueous buffers |
| Tris-HCl or PBS Mobile Phase | Carrier liquid for AF4/SEC | Physiologically relevant pH and ionic strength |
| MALS Detector | Absolute measurement of molar mass and Rg | Requires no standards or assumptions about shape |
| RI Detector | Measurement of solute concentration | Essential for determining molar mass with MALS |
Integrated Data Interpretation and Quality Control
The true power of these advanced techniques is realized when data from proteomics, AF4-MALS, and SEC-MALS are integrated. This multi-attribute approach provides a comprehensive product quality profile that far surpasses the sum of its parts.
For instance, a single batch of hUC-MSC exosomes can be characterized as follows:
- SEC-MALS provides a quick purity check, confirming that >90% of the UV signal at 280 nm is associated with the vesicle peak rather than soluble proteins.
- AF4-MALS-DLS reveals a main population with an Rh of 75 nm and an Rg/Rh ratio of 0.78, confirming a spherical, vesicular structure. The low polydispersity of the MALS signal indicates high batch homogeneity.
- Proteomic profiling identifies over 700 proteins, including the requisite markers (CD63, CD81, CD9) and therapeutically relevant effectors like AP2A1 and AP2B1. The profile matches the historical batch-to-batch consistency data, with over 85% similarity in the core proteome.
This integrated dataset forms the basis for a robust quality control strategy. Action limits can be set for key parameters such as the percentage of protein impurity (from SEC-MALS), the mean Rh and polydispersity (from AF4-MALS), and the presence and relative abundance of key functional proteins (from proteomics). This level of control is essential for ensuring the safety, efficacy, and consistency of MSC exosomes as therapeutic products [61] [62] [63].
Mesenchymal stem cell-derived exosomes (MSC-Exos), a subtype of small extracellular vesicles (sEVs), have emerged as a promising cell-free therapeutic paradigm in regenerative medicine [7] [65]. These nanoscale vesicles (typically 30–150 nm in diameter) function as critical mediators of intercellular communication, transferring proteins, lipids, and nucleic acids to recipient cells [66]. Their innate ability to cross biological barriers, including the blood-brain barrier (BBB) and blood-retinal barrier (BRB), coupled with their low immunogenicity and high biosafety profile, positions them as ideal therapeutic vectors for treating complex neurological and retinal disorders [7] [65].
This case study details the application of a standardized characterization workflow—employing Nanoparticle Tracking Analysis (NTA), Western Blot, and Transmission Electron Microscopy (TEM)—to validate MSC-Exos destined for preclinical models of retinal degeneration and neurological injury. The objective is to provide a rigorous methodological framework that ensures the isolation of high-purity, functionally competent exosomes, thereby establishing a robust foundation for their therapeutic application.
Comprehensive Characterization of Isolated MSC-Exos
A multi-technique approach is essential for confirming the identity, purity, and structural integrity of isolated MSC-Exos. The following table summarizes the quantitative and qualitative data expected from a successful characterization suite.
Table 1: Summary of Characterization Data for MSC-Derived Exosomes
| Characterization Method | Key Parameters & Outcomes | Typical Data Output |
|---|---|---|
| Nanoparticle Tracking Analysis (NTA) | - Size Distribution- Particle Concentration- Yield per Cell | - Mean size: 107–114 nm [11]- Mode size: ~110 nm [13]- Yield: 3,751–4,319 particles/cell [11] |
| Western Blot | - Positive Markers- Negative Markers | - Positive for CD9, CD63, CD81, TSG101 [11] [12]- Negative for Cytochrome C (cellular contaminant) [13] |
| Transmission Electron Microscopy (TEM) | - Morphology & Ultrastructure | - Cup-shaped, spherical morphology [13] [11]- Lipid bilayer structure visible |
Comparative Analysis of Exosome Isolation Methods
The choice of isolation method significantly impacts the yield, purity, and biological functionality of the final exosome preparation. The table below compares two common techniques.
Table 2: Comparison of Exosome Isolation Methods
| Isolation Method | Key Advantages | Key Limitations | Therapeutic Relevance |
|---|---|---|---|
| Ultracentrifugation (UC) | - Considered the "gold standard" [7]- High purity achievable | - Potential for vesicle damage due to high g-forces [7]- Time-consuming- Requires specialized equipment | Suitable for research-scale production for initial proof-of-concept studies. |
| Tangential Flow Filtration (TFF) | - Higher particle yield than UC [11]- Gentler on vesicles, preserving integrity- Scalable for GMP production | - Membrane adhesion can reduce yield [7] | Recommended for large-scale, clinical-grade production due to its scalability and consistency [11]. |
Experimental Protocols
Protocol 1: Isolation of MSC-Exos via Tangential Flow Filtration (TFF)
This protocol is optimized for the scalable production of high-quality exosomes [11].
Cell Culture and Conditioned Media Collection:
- Culture human bone marrow-derived MSCs (BM-MSCs) in a GMP-compliant, xeno-free medium, such as α-MEM supplemented with 10% human platelet lysate (hPL). α-MEM has been shown to support higher cell proliferation and exosome yield compared to DMEM [11].
- At 80-90% confluency, wash cells and change to a serum-free medium or a medium containing exosome-depleted FBS.
- Collect conditioned media after 24-48 hours. Centrifuge at 300 × g for 10 min to remove cells, followed by 2,000 × g for 20 min to remove cellular debris.
- Filter the supernatant through a 0.22 µm PES membrane to remove larger particles.
Concentration and Diafiltration via TFF:
- Use a TFF system equipped with a cartridge containing a pore size of 300–500 kDa.
- Concentrate the conditioned media to approximately 50-100 mL.
- Perform diafiltration with 5-10 volumes of phosphate-buffered saline (PBS) to exchange the buffer and remove contaminating proteins.
Final Concentration and Storage:
- Concentrate the retentate to a final volume of 1-2 mL.
- Filter the final exosome preparation through a 0.22 µm filter into a sterile vial.
- Aliquot and store at -80°C. Avoid repeated freeze-thaw cycles.
Protocol 2: Characterization of MSC-Exos
A. Nanoparticle Tracking Analysis (NTA)
- Principle: NTA utilizes light scattering and Brownian motion to determine the size distribution and concentration of particles in a suspension [13] [11].
- Procedure:
- Thaw an aliquot of exosomes on ice and dilute 1:100 to 1:10,000 in sterile, filtered PBS to achieve an ideal concentration of 20-100 particles per frame.
- Inject the sample into the NTA sample chamber.
- Capture three videos of 60 seconds each with the camera level and detection threshold kept constant across all measurements.
- Use the built-in software to analyze the videos, ensuring that the measured particle mode size falls within the 90-120 nm range.
B. Western Blot Analysis for Exosomal Markers
- Principle: This method confirms the presence of characteristic exosomal proteins and the absence of contaminants from parent cells [13] [11].
- Procedure:
- Lyse Exosomes: Mix an exosome aliquot with RIPA buffer containing protease inhibitors. Incubate on ice for 30 min.
- Electrophoresis: Separate 20-30 µg of protein lysate on a 4-20% gradient SDS-PAGE gel.
- Transfer: Transfer proteins to a PVDF membrane.
- Blocking and Incubation: Block the membrane with 5% non-fat milk for 1 hour. Incubate with primary antibodies overnight at 4°C.
- Positive Markers: Anti-CD63 (1:1000), Anti-CD9 (1:1000), Anti-TSG101 (1:1000).
- Negative Marker: Anti-Cytochrome C (1:1000) to rule out mitochondrial contamination [13].
- Detection: Incubate with an HRP-conjugated secondary antibody and develop using an ECL substrate. Image the blot.
C. Transmission Electron Microscopy (TEM)
- Principle: TEM provides high-resolution images to confirm the cup-shaped morphology and integrity of exosomes [13].
- Procedure:
- Adsorb 10 µL of exosome sample onto a formvar/carbon-coated copper grid for 1 minute.
- Blot excess liquid and negatively stain with 2% uranyl acetate for 1 minute.
- Blot the stain and air-dry the grid completely.
- Image the sample using a TEM operated at 80 kV. Expect to see circular or cup-shaped vesicles.
Protocol 3: Functional Validation in a Retinal Pigment Epithelium (RPE) Model
This protocol assesses the therapeutic efficacy of characterized MSC-Exos in an in vitro model of oxidative stress-induced RPE damage [11].
- Cell Culture: Maintain human ARPE-19 cells in DMEM/F12 medium supplemented with 10% FBS.
- Oxidative Stress Induction: Seed ARPE-19 cells in a 96-well plate. At ~70% confluency, induce damage by exposing cells to 200-400 µM H₂O₂ for 2 hours.
- Exosome Treatment:
- Pre-treatment Group: Add MSC-Exos (50 µg/mL) to the culture medium 24 hours before H₂O₂ exposure.
- Post-treatment Group: Add MSC-Exos (50 µg/mL) to the culture medium immediately after H₂O₂ exposure.
- Include control groups (untreated, H₂O₂ only).
- Viability and Apoptosis Assay:
- Cell Viability: 24 hours post-treatment, measure cell viability using an MTT or CCK-8 assay. Viability of H₂O₂-treated cells (~38%) should significantly increase with exosome treatment (~53%) [11].
- Apoptosis: Use the ApoLive-Glo Multiplex Assay or flow cytometry with Annexin V/PI staining to quantify apoptosis. Exosome treatment should show a significant reduction in total apoptotic cells [11].
Therapeutic Mechanisms and Signaling Pathways
The therapeutic benefits of MSC-Exos in retinal and neurological contexts are mediated by the transfer of their bioactive cargo, which modulates key cellular pathways.
dot Exosome Therapeutic Mechanism Diagram
Diagram 1: MSC-Exosome Mediated Therapeutic Mechanisms. The diagram illustrates how exosomal cargo elicits context-specific therapeutic effects, such as modulating apoptosis and inhibiting ferroptosis.
The Scientist's Toolkit: Research Reagent Solutions
Table 3: Essential Reagents and Materials for MSC-Exosome Research
| Reagent / Material | Function / Application | Example & Notes |
|---|---|---|
| α-MEM Culture Medium | Cell culture and exosome production | Superior to DMEM for BM-MSC proliferation and sEV yield [11]. |
| Human Platelet Lysate (hPL) | Serum supplement for cell culture | A xeno-free alternative to FBS for GMP-compliant production [11]. |
| TFF System | Scalable exosome isolation | Enables gentle, high-yield isolation for clinical-grade production [11]. |
| Anti-CD63 / CD9 / TSG101 Antibodies | Exosome characterization (Western Blot) | Confirm the presence of positive exosomal markers [13] [11]. |
| Anti-Cytochrome C Antibody | Assay control (Western Blot) | Serves as a negative marker to rule out mitochondrial contamination [13]. |
| Uranyl Acetate (2%) | Negative stain for TEM | Provides contrast for visualizing exosome morphology [13]. |
| ApoLive-Glo Multiplex Assay | Functional validation | Simultaneously measures cell viability and caspase activity [13]. |
| H₂O₂ (Hydrogen Peroxide) | Functional validation | Induces oxidative stress in in vitro RPE/neural injury models [11]. |
The journey of Mesenchymal Stem Cell (MSC) exosomes from laboratory research ("bench") to clinical application ("bedside") is a promising yet challenging pathway in regenerative medicine and drug development [68]. MSC exosomes, a type of small extracellular vesicle (sEV), offer significant therapeutic potential due to their inherent biocompatibility, ability to cross biological barriers like the blood-brain barrier, low immunogenicity, and capacity to transfer bioactive molecules to recipient cells [69]. However, the transition from preclinical success to clinical efficacy is often hampered by a "translational gap," sometimes referred to as the "Valley of Death" [70]. This document outlines critical validation strategies and standardized protocols to support the robust preclinical and clinical development of MSC exosome-based therapies, ensuring they are safe, effective, and reproducible.
Core Characterization Techniques for MSC Exosomes
A foundational step in MSC exosome validation is rigorous characterization to confirm their identity, purity, and integrity. The following techniques form the essential triad for analysis.
2.1 Nanoparticle Tracking Analysis (NTA)
- Function: Determines the size distribution and concentration of particles in an exosome preparation.
- Protocol Summary: The exosome suspension is injected into the NTA sample chamber. A laser beam scatters light off the particles, and a camera captures their movement under Brownian motion. The software analyzes the movement to calculate the hydrodynamic diameter and concentration of particles per milliliter [11].
- Expected Output: A profile showing a predominant peak of particles within the 30-150 nm size range, characteristic of sEVs/exosomes [11] [68].
2.2 Western Blotting
- Function: Detects the presence of specific exosomal marker proteins and confirms the absence of contaminants.
- Protocol Summary: Proteins are extracted from the exosome preparation, separated by gel electrophoresis, and transferred to a membrane. The membrane is probed with antibodies against positive markers (e.g., CD9, CD63, CD81, TSG101) and negative markers (e.g., Calnexin, an endoplasmic reticulum protein). A positive result shows enrichment of tetraspanins and absence of organelle-specific contaminants [11].
- Expected Output: Clear immunobands for CD9, CD63, and TSG101, with no band for Calnexin [11].
2.3 Transmission Electron Microscopy (TEM)
- Function: Visualizes the morphology and ultrastructure of isolated exosomes.
- Protocol Summary: A purified exosome sample is applied to a grid, negatively stained with a heavy metal solution (e.g., uranyl acetate), and visualized under an electron microscope.
- Expected Output: Images revealing a population of cup-shaped, spherical vesicles with a lipid bilayer [11].
Quantitative Data Summary of Characterization The following table summarizes typical results from the characterization of MSC-derived sEVs.
Table 1: Characterization Data of Bone Marrow MSC-derived Small Extracellular Vesicles (BM-MSC-sEVs)
| Characterization Method | Parameter Measured | Typical Result for BM-MSC-sEVs |
|---|---|---|
| Nanoparticle Tracking Analysis (NTA) | Mean Size Distribution | 107.58 ± 24.64 nm [11] |
| Particle Yield | 4,318.72 ± 2,110.22 particles/cell [11] | |
| Western Blot | Positive Markers | Presence of CD9, CD63, TSG101 [11] |
| Negative Marker | Absence of Calnexin [11] | |
| Transmission Electron Microscopy | Morphology | Cup-shaped vesicles [11] |
Preclinical Validation: From In Vitro Models to In Vivo Efficacy
A robust preclinical package is critical for justifying clinical trials. This involves demonstrating biological activity in relevant disease models.
3.1 In Vitro Functional Assays A key therapeutic function of MSC exosomes is protecting cells from oxidative stress-induced damage, a common factor in many diseases.
- Protocol: H₂O₂-Induced Oxidative Stress Model in ARPE-19 Cells
- Cell Culture: Maintain spontaneously arising retinal pigment epithelium (ARPE-19) cells in standard culture conditions.
- Induction of Damage: Expose cells to a defined concentration of hydrogen peroxide (H₂O₂).
- Therapeutic Intervention: Apply MSC exosomes (e.g., at 50 µg/mL) to the cells for 24 hours either before (pre-treatment) or after (post-treatment) H₂O₂ exposure.
- Viability Assessment: Measure cell viability using a standard assay like MTT or Cell Counting Kit-8 (CCK-8).
- Expected Outcome: Cell viability after H₂O₂ exposure alone may drop to ~38%. Treatment with MSC exosomes can significantly increase viability to over 50%, demonstrating a protective effect. Flow cytometry analysis further shows a significant reduction in the percentage of total apoptotic cells [11].
- Protocol: H₂O₂-Induced Oxidative Stress Model in ARPE-19 Cells
3.2 Workflow: Preclinical Therapeutic Assessment The following diagram outlines the logical workflow for a standard preclinical therapeutic assessment of MSC exosomes.
Bridging the Gap: Strategies for Clinical Translation
Success in preclinical models does not guarantee clinical success. Lessons from other fields highlight key strategies to improve translatability [71] [70].
4.1 Standardization and Scalable Production The method used for exosome isolation significantly impacts yield and quality, which are critical for clinical-grade manufacturing.
- Protocol Comparison: Ultracentrifugation vs. Tangential Flow Filtration
- Differential Ultracentrifugation (UC): The traditional "gold standard." It involves sequential centrifugation steps with increasing forces (up to 100,000–150,000 × g) to pellet exosomes. While low-cost, it is time-consuming, can damage vesicles, and has relatively low purity [68] [69].
- Tangential Flow Filtration (TFF): A scalable method where the sample flows tangentially across a membrane, separating particles by size. It is quicker, causes less damage to vesicles, and is more suitable for large-volume processing. Studies show TFF provides a statistically higher particle yield compared to UC [11].
- Protocol Comparison: Ultracentrifugation vs. Tangential Flow Filtration
4.2 Workflow: From Research to Clinical Application The journey from basic research to a clinically applicable therapeutic involves multiple, interconnected stages.
4.3 Biomarker Identification and Patient Stratification Retrospective analyses in oncology have demonstrated that the efficacy of targeted therapies is often dependent on specific biomarkers (e.g., EGFR mutations in NSCLC, KRAS wild-type status in CRC) [71]. For MSC exosomes, investing in research to identify biomarkers that predict therapeutic response is crucial. This enables the design of clinical trials for a defined patient population most likely to benefit, increasing the probability of trial success.
4.4 Comprehensive Preclinical Data Package Before initiating clinical trials, a comprehensive preclinical package should be assembled [70]:
- Proof of Mechanism: Evidence that the exosomes engage the intended target.
- Proof of Concept: Demonstration of efficacy in multiple and clinically relevant disease models.
- Pharmacokinetics and Biodistribution: Data on how exosomes are distributed in the body over time.
- Safety Pharmacology: Assessment of potential adverse effects.
The Scientist's Toolkit: Essential Research Reagents and Materials
The following table details key reagents and materials essential for MSC exosome research and development.
Table 2: Key Research Reagent Solutions for MSC Exosome Workflow
| Item | Function / Application |
|---|---|
| Human Platelet Lysate (hPL) | A xeno-free supplement for MSC culture media, promoting cell growth and expansion under Good Manufacturing Practice (GMP)-compliant conditions [11]. |
| Alpha Minimum Essential Medium (α-MEM) | A culture medium that may support higher BM-MSC expansion ratios and sEV yields compared to alternatives like DMEM [11]. |
| Antibodies (CD9, CD63, TSG101, Calnexin) | Essential reagents for Western Blot characterization to confirm the identity (positive markers) and purity (negative marker) of isolated exosomes [11]. |
| Ultracentrifuge | Specialized equipment required for differential ultracentrifugation, a common method for exosome isolation [69]. |
| Tangential Flow Filtration (TFF) System | Equipment for scalable, high-yield isolation of exosomes, suitable for transitioning from laboratory to larger-scale production [11]. |
| Size-Exclusion Chromatography (SEC) Columns | Used for high-purity isolation of exosomes, preserving their biological activity by separating them from protein aggregates and other contaminants [68]. |
| Nanoparticle Tracking Analyzer | Instrument for determining the size distribution and concentration of exosome preparations [11]. |
Conclusion
The rigorous characterization of MSC exosomes using the complementary techniques of NTA, Western Blot, and TEM is non-negotiable for their successful development as therapeutics. This integrated approach provides indispensable data on particle size, molecular identity, and structural integrity, forming the basis for understanding batch-to-batch consistency, biological activity, and safety. As the field advances, future efforts must focus on standardizing protocols, automating image analysis to enhance objectivity and throughput, and integrating novel analytical platforms to create a more comprehensive molecular fingerprint. By mastering these characterization techniques, researchers can accelerate the clinical translation of MSC exosome-based therapies, ultimately unlocking their full potential in regenerative medicine, targeted drug delivery, and the treatment of degenerative and inflammatory diseases.
References
- 1. Mesenchymal Stem Cell-Derived Exosomes - PubMed Central [https://pmc.ncbi.nlm.nih.gov/articles/PMC8393426/]
- 2. Mesenchymal stem cell derived-exosomes: a modern ... [https://translational-medicine.biomedcentral.com/articles/10.1186/s12967-020-02622-3]
- 3. Mesenchymal stromal/stem cell (MSC)-derived exosomes in ... [https://pmc.ncbi.nlm.nih.gov/articles/PMC10079493/]
- 4. An Overview of Current Research on Mesenchymal Stem ... [https://www.frontiersin.org/journals/bioengineering-and-biotechnology/articles/10.3389/fbioe.2022.910812/full]
- 5. Mesenchymal stem cell-derived exosomes: Characteristics ... [https://www.sciencedirect.com/science/article/abs/pii/S0024320524001310]
- 6. Exosomes derived from mesenchymal stem cells repair ... [https://pmc.ncbi.nlm.nih.gov/articles/PMC12487243/]
- 7. Mesenchymal stem cell-derived extracellular vesicles [https://pmc.ncbi.nlm.nih.gov/articles/PMC12399395/]
- 8. preconditioning strategies for MSC-derived extracellular ... [https://www.frontiersin.org/journals/pharmacology/articles/10.3389/fphar.2025.1509418/full]
- 9. Trends in mesenchymal stem cell-derived extracellular ... [https://pmc.ncbi.nlm.nih.gov/articles/PMC12488731/]
- 10. Recent advances in scalable exosome production [https://www.sciencedirect.com/science/article/pii/S2096691125000196]
- 11. Comparison of production methods for mesenchymal stem ... [https://www.nature.com/articles/s41598-025-21218-9]
- 12. Clinical applications of extracellular vesicles [https://www.frontiersin.org/journals/bioengineering-and-biotechnology/articles/10.3389/fbioe.2025.1671963/full]
- 13. Bone Marrow Mesenchymal Stem Cell-Derived Exosomes ... [https://pmc.ncbi.nlm.nih.gov/articles/PMC12299787/]
- 14. Protocol Optimization for Exosome Production from ... [https://bcn.iums.ac.ir/article-1-3236-en.html]
- 15. Comparative Efficacy of Exosomes Derived from Different ... [https://pmc.ncbi.nlm.nih.gov/articles/PMC12193399/]
- 16. Extracellular vesicles isolated from adipose tissue-derived ... [https://stemcellres.biomedcentral.com/articles/10.1186/s13287-025-04435-x]
- 17. MISEV [https://www.isev.org/misev]
- 18. Comprehensive proteomic analysis of exosomes derived ... [https://pmc.ncbi.nlm.nih.gov/articles/PMC7694919/]
- 19. Defined MSC exosome with high yield and purity to ... [https://pmc.ncbi.nlm.nih.gov/articles/PMC8060739/]
- 20. Three-dimensional culture of MSCs produces exosomes with ... [https://stemcellres.biomedcentral.com/articles/10.1186/s13287-020-01719-2]
- 21. EV Characterization by Western Blot [https://www.stemcell.com/how-to-characterize-extracellular-vesicles-by-western-blotting.html]
- 22. Comprehensive proteomic analysis of exosome mimetic ... [https://stemcellres.biomedcentral.com/articles/10.1186/s13287-022-03008-6]
- 23. Meta-analysis study of the therapeutic impact ... [https://www.sciencedirect.com/science/article/pii/S2405580825001591]
- 24. Influence of mesenchymal stem cell-derived extracellular ... [https://pmc.ncbi.nlm.nih.gov/articles/PMC6942375/]
- 25. 2.4.3. Nanoparticle Tracking Analysis [https://bio-protocol.org/exchange/minidetail?id=18627078&type=30]
- 26. Nanoparticle Tracking Analysis (NTA) [https://www.protocols.io/view/nanoparticle-tracking-analysis-nta-d4298yh6.html]
- 27. Concentration Scanning Technology for Nanoparticles [https://www.particle-metrix.com/blogs/technical-notes/concentration-scanning-technology-for-nanoparticle-concentration-determination-using-nanoparticle-tracking-analysis-nta]
- 28. Exosomal Protein Markers as Potential Non-Invasive ... [https://www.mdpi.com/1422-0067/26/22/11060]
- 29. Exosomal proteins: new targets for early diagnosis and ... [https://www.frontiersin.org/journals/immunology/articles/10.3389/fimmu.2025.1613494/full]
- 30. 2.3. Western Blot Analysis of Exosomes [https://bio-protocol.org/exchange/minidetail?id=10127658&type=30]
- 31. A Universal Approach to Analyzing Transmission Electron ... [https://pmc.ncbi.nlm.nih.gov/articles/PMC8465115/]
- 32. Comparison of exosomes derived from induced pluripotent ... [https://www.aging-us.com/article/103904/text]
- 33. Western Blot Protocols and Recipes [https://www.thermofisher.com/us/en/home/life-science/protein-biology/protein-biology-learning-center/protein-gel-electrophoresis-information/western-blot-protocols.html]
- 34. Quantification of Exosomes - PMC [https://pmc.ncbi.nlm.nih.gov/articles/PMC5039048/]
- 35. Advances in Exosome Quantification Techniques - Halo Labs [https://www.halolabs.com/blog/exosome-quantification-techniques/]
- 36. A comparative analysis of small extracellular vesicle (sEV ... [https://pmc.ncbi.nlm.nih.gov/articles/PMC11648519/]
- 37. Elucidating Methods for Isolation and Quantification of ... [https://pmc.ncbi.nlm.nih.gov/articles/PMC7940341/]
- 38. Transmission Electron Microscopy-based characterization of ... [https://biosignaling.biomedcentral.com/articles/10.1186/s12964-025-02383-w]
- 39. A comparative analysis of extracellular vesicles (EVs) from ... [https://www.nature.com/articles/s41598-022-14211-z]
- 40. Evaluation of the performance of Nanoparticle Tracking ... [https://foodsafetyandrisk.biomedcentral.com/articles/10.1186/s40550-025-00112-2]
- 41. Mesenchymal stem cell-derived exosomes: A paradigm ... [https://www.sciencedirect.com/science/article/abs/pii/S0014482725002125]
- 42. Non-targeted analysis (NTA) and suspect screening ... [https://pmc.ncbi.nlm.nih.gov/articles/PMC10403360/]
- 43. Current Status and Challenges of Analytical Methods for ... [https://pmc.ncbi.nlm.nih.gov/articles/PMC9122548/]
- 44. Comparison of Automated and Traditional Western Blotting ... [https://pmc.ncbi.nlm.nih.gov/articles/PMC10142486/]
- 45. Sample Preparation and Imaging of Exosomes by ... [https://pmc.ncbi.nlm.nih.gov/articles/PMC5908436/]
- 46. The role of natural exosomes from SHED-MSC in ... [https://www.frontiersin.org/journals/immunology/articles/10.3389/fimmu.2025.1550280/full]
- 47. Why qPCR and WB results are not consistent 2025- ... [https://www.antibodysystem.com/archive/380.html]
- 48. Do You Trust Your Research Antibody? - CST Blog [https://blog.cellsignal.com/validation-trust-your-research-antibody]
- 49. Common Troubleshooting Tips for Western Blot Results [https://www.bosterbio.com/blog/post/common-troubleshooting-tips-for-western-blot-results-part-1?srsltid=AfmBOopPbBhqcMOGnHmCK8jD9HqMH9VQ9CfVCujl9ZMgoRN00089NPOn]
- 50. Improving rigor and reproducibility in western blot ... [https://www.nature.com/articles/s41598-024-70096-0]
- 51. ELISA vs Western Blot: When to Use Each Immunoassay ... [https://www.thermofisher.com/blog/life-in-the-lab/western-blot-or-elisa/]
- 52. Quantitative approaches for multi-scale structural analysis ... [https://arxiv.org/html/2504.01159v2]
- 53. A Beginner's Guide to TEM Sample Preparation [https://www.jeolusa.com/NEWS-EVENTS/Blog/beginners-guide-tem-sample-preparation]
- 54. An Algorithm for Enhancing the Image Contrast of Electron ... [https://www.nature.com/articles/s41598-018-34652-9]
- 55. Isolation and Characterization of Extracellular Vesicle from ... [https://pmc.ncbi.nlm.nih.gov/articles/PMC9066249/]
- 56. Review of the Isolation, Characterization, Biological Function ... [https://pmc.ncbi.nlm.nih.gov/articles/PMC6523673/]
- 57. Protocol for isolating and identifying small extracellular ... [https://www.sciencedirect.com/science/article/pii/S2666166724003629]
- 58. Extraction and identification of synovial tissue-derived ... [https://pmc.ncbi.nlm.nih.gov/articles/PMC7063768/]
- 59. Characterization of Plasma-Derived Extracellular Vesicles ... [https://pmc.ncbi.nlm.nih.gov/articles/PMC6466225/]
- 60. Characterization of surface markers on extracellular vesicles ... [https://bmccancer.biomedcentral.com/articles/10.1186/s12885-021-08870-w]
- 61. Proteomic characterization of hUC-MSC extracellular ... [https://www.nature.com/articles/s41598-024-56549-6]
- 62. The Power of Field-Flow Fractionation in Characterization of ... [https://pmc.ncbi.nlm.nih.gov/articles/PMC10224342/]
- 63. Usefulness of Size-Exclusion Chromatography-Multi-Angle ... [https://pubmed.ncbi.nlm.nih.gov/39771505/]
- 64. Proteomic profiling of mesenchymal stem cell‐derived ... - PMC [https://pmc.ncbi.nlm.nih.gov/articles/PMC11212298/]
- 65. a promising strategy for treating retinal degenerative diseases [https://pmc.ncbi.nlm.nih.gov/articles/PMC11846226/]
- 66. Exosome-driven biohybrid nanorobots: bridging nature and ... [https://pubs.rsc.org/en/content/articlehtml/2025/ra/d5ra05296c]
- 67. Bone marrow mesenchymal stem cells-derived exosomes ... [https://www.nature.com/articles/s41598-025-25204-z]
- 68. From bench to bedside: the research status and application ... [https://pmc.ncbi.nlm.nih.gov/articles/PMC12103788/]
- 69. Mesenchymal stem cell-derived extracellular vesicles [https://www.frontiersin.org/journals/cell-and-developmental-biology/articles/10.3389/fcell.2025.1626996/full]
- 70. Bridging the gap between preclinical and clinical research [https://pmc.ncbi.nlm.nih.gov/articles/PMC10043823/]
- 71. From Bench to Bedside: Lessons Learned in Translating ... [https://pmc.ncbi.nlm.nih.gov/articles/PMC3787906/]