A Comprehensive Seurat Workflow for Clustering and Analyzing Stem Cell Populations from scRNA-seq Data
This article provides a complete guide for researchers and drug development professionals on using Seurat for stem cell population analysis.
A Comprehensive Seurat Workflow for Clustering and Analyzing Stem Cell Populations from scRNA-seq Data
Abstract
This article provides a complete guide for researchers and drug development professionals on using Seurat for stem cell population analysis. It covers the foundational principles of single-cell RNA sequencing for stem cells, a step-by-step methodological workflow from data preprocessing to clustering and annotation, advanced troubleshooting and optimization strategies to address common pitfalls, and essential validation techniques to ensure biological reliability. By integrating the latest tools and best practices, this guide empowers scientists to robustly identify and characterize stem cell subtypes, uncover heterogeneity, and derive biologically meaningful insights with clinical implications.
Understanding Stem Cell Heterogeneity and the Role of scRNA-seq
Stem cell populations are characterized by their inherent transcriptomic heterogeneity, which reflects diverse cellular states including primed, naïve, and extended pluripotency states. Understanding this heterogeneity is crucial for unraveling the complexities of early development, improving in vitro stem cell models, and advancing therapeutic applications in regenerative medicine. Single-cell RNA sequencing (scRNA-seq) technologies have revolutionized our ability to dissect this heterogeneity at unprecedented resolution, enabling researchers to identify distinct subpopulations, trace lineage commitment, and map developmental trajectories.
The emergence of advanced computational tools, particularly Seurat, has provided the analytical framework necessary to process, integrate, and interpret complex scRNA-seq datasets from stem cell populations. When applied to pluripotent stem cell systems, these analyses reveal the molecular signatures underlying pluripotency transitions and developmental competence, offering valuable insights for both basic research and drug discovery applications.
Experimental Design and Workflow
A comprehensive scRNA-seq analysis of stem cell populations requires careful experimental design and execution across both laboratory and computational phases. The integrated workflow ensures that high-quality data is generated and analyzed to extract meaningful biological insights about stem cell heterogeneity.
Table 1: Key Experimental Considerations for Stem Cell scRNA-seq
| Experimental Aspect | Recommendation | Rationale |
|---|---|---|
| Stem Cell Culture | Maintain undifferentiated state through appropriate media and matrix conditions | Preserves pluripotency and prevents spontaneous differentiation that confounds analysis |
| Cell Dissociation | Use gentle enzymatic dissociation (e.g., Accutase, TrypLE) | Maintains cell viability while minimizing stress responses that alter transcriptomes |
| Quality Control | Assess viability (>80%), cell integrity, and absence of differentiation | Ensures sequencing captures true biological heterogeneity rather than technical artifacts |
| Library Preparation | Select appropriate method (SMART-seq2 for sensitivity, 10X for throughput) | Balances transcript coverage with cell numbers based on research questions |
| Sequencing Depth | 50,000-100,000 reads per cell for standard analyses | Provides sufficient coverage for detecting low-abundance transcripts and rare cell states |
The experimental workflow begins with careful preparation of stem cell cultures, transitioning through single-cell isolation, library preparation, sequencing, and computational analysis. For stem cell applications specifically, maintaining pluripotent states during processing is particularly critical, as stress responses can trigger differentiation and obscure true biological heterogeneity.
Computational Analysis with Seurat
Data Preprocessing and Quality Control
The initial computational phase focuses on ensuring data quality and filtering technical artifacts:
Quality control is particularly crucial for stem cell analyses as these cells often exhibit sensitivity to dissociation and manipulation. Mitochondrial percentage thresholds may need adjustment based on specific stem cell types, with higher thresholds sometimes acceptable for more metabolically active populations.
Normalization, Scaling, and Feature Selection
After quality control, data normalization addresses technical variability:
For stem cell applications, the selection of highly variable genes effectively captures genes associated with pluripotency states and early lineage priming. The regression of mitochondrial percentage helps remove biological variation related to cell stress that might otherwise confound identification of pluripotent subpopulations.
Dimensionality Reduction and Clustering
The core of heterogeneity analysis lies in dimensionality reduction and clustering:
Clustering resolution should be optimized for stem cell datasets, typically testing resolutions between 0.6-1.2 to capture meaningful pluripotent states without over-clustering. The selection of principal components for neighborhood graph construction significantly impacts results and should be determined using elbow plots of standard deviation.
Cluster Annotation and Marker Identification
Annotation of stem cell clusters relies on established pluripotency markers:
For stem cell populations, key marker genes include POU5F1 (OCT4), NANOG, SOX2 for pluripotency, along with early lineage markers that may indicate priming toward specific developmental trajectories. Additional state-specific markers such as KLF4 and TBX3 for naïve pluripotency help refine cluster annotations.
Advanced Analytical Applications
Trajectory Analysis and Pseudotime
Pseudotime analysis reconstructs developmental trajectories and transitions between pluripotency states:
Applied to transitioning systems such as primed-to-naïve pluripotency induction, pseudotime analysis can reveal the sequence of molecular events during state transitions and identify regulatory genes that drive these processes.
Integration Across Conditions and Batches
When analyzing stem cells across multiple conditions, experiments, or donors, data integration enables robust comparative analysis:
Integration is particularly valuable when comparing stem cells across different culture conditions, reprogramming timepoints, or disease modeling contexts, allowing separation of biological variation from technical effects.
Application Notes: Case Studies in Stem Cell Research
Case Study 1: Heterogeneity in Human ESCs and ffEPSCs
A recent study applied Smart-seq2-based scRNA-seq to analyze transcriptomic differences between human embryonic stem cells (ESCs) and feeder-free extended pluripotent stem cells (ffEPSCs) [1]. The experimental workflow included:
- Cell Culture: H9 ESCs maintained in mTeSR1 on Matrigel-coated plates, with transition to ffEPSCs using LCDM-IY medium containing LIF, CHIR99021, and other small molecules [1].
- scRNA-seq: Smart-seq2 protocol with poly(dT) priming, cDNA amplification, and Illumina HiSeq 2000 sequencing [1].
- Bioinformatic Analysis: Alignment to GRCh38 with HISAT2, quantification with featureCounts, and analysis using Seurat with 40 principal components and resolution parameter of 1.3 for clustering [1].
This study revealed distinct subpopulations within both ESC and ffEPSC populations and mapped the transition process through pseudotime analysis, identifying critical molecular pathways involved in the shift from primed to extended pluripotent states [1]. The analysis particularly highlighted the role of repeat elements in pluripotency regulation when using the T2T reference genome.
Case Study 2: Hematopoietic Stem and Progenitor Cells (HSPCs)
An optimized scRNA-seq workflow was developed for human umbilical cord blood-derived HSPCs, addressing the challenges of limited cell numbers and sensitivity requirements [2]:
- Cell Sorting: CD34+Lin-CD45+ and CD133+Lin-CD45+ populations isolated using FACS sorting with comprehensive antibody panels [2].
- Library Preparation: 10X Genomics Chromium platform with careful quality control thresholds (<200 and >2500 genes excluded, >5% mitochondrial threshold) [2].
- Computational Analysis: Seurat v5.0.1 processing revealing strong correlation (R=0.99) between CD34+ and CD133+ populations despite their enrichment for different primitive states [2].
This protocol emphasized that successful stem cell scRNA-seq requires optimization at every step from cell sorting through data analysis, with special attention to quality metrics and analytical parameters [2].
Table 2: Benchmarking Clustering Algorithms for Stem Cell Data
| Method Category | Top Performing Algorithms | Strengths for Stem Cell Data | Considerations |
|---|---|---|---|
| Deep Learning-based | scDCC, scAIDE, scDeepCluster | Handers complex heterogeneity, robust to noise | Higher computational demands, requires tuning |
| Community Detection-based | Leiden, Louvain, PARC | Fast, scalable to large datasets | May oversimplify continuous transitions |
| Classical Machine Learning | SC3, TSCAN, FlowSOM | Interpretable, stable performance | May struggle with complex lineage relationships |
Recent benchmarking of 28 clustering algorithms on single-cell data recommends scDCC, scAIDE, and FlowSOM for optimal performance across transcriptomic and proteomic data types, with scAIDE ranking first for proteomic data and scDCC for transcriptomic data [3]. Selection should balance performance with computational efficiency based on dataset size and research questions.
Research Reagent Solutions
Table 3: Essential Research Reagents for Stem Cell scRNA-seq
| Reagent/Category | Specific Examples | Function in Workflow |
|---|---|---|
| Culture Media | mTeSR1, LCDM-IY, Essential 8 | Maintains pluripotency or enables state transitions |
| Dissociation Reagents | Accutase, TrypLE, Gentle Cell Dissociation | Single-cell suspension preserving viability |
| Surface Markers | CD34, CD133, CD45, Lineage Cocktail | Cell sorting and population enrichment |
| Library Prep Kits | 10X Genomics Chromium, SMART-seq2 | Single-cell RNA library construction |
| Bioinformatic Tools | Seurat, Monocle, Scanpy | Data analysis, visualization, and interpretation |
Visualization of Stem Cell Analysis Workflow
Diagram 1: scRNA-seq Analysis Workflow for Stem Cells
Diagram 2: Stem Cell States and Transitions
Troubleshooting and Optimization
Common challenges in stem cell scRNA-seq analysis include:
- Low RNA Content: Stem cells often have lower RNA content than differentiated cells. Pre-amplification methods like SMART-seq2 may be preferable to droplet-based methods for sensitive detection of pluripotency factors.
- Cell Cycle Effects: Pluripotent stem cells frequently cycle rapidly. Regressing out cell cycle scores using Seurat's
CellCycleScoring()andScaleData(vars.to.regress)can help separate cycle effects from pluripotency heterogeneity. - Batch Effects: When integrating datasets across multiple differentiations or reprogramming experiments, strong batch effects may obscure biological variation. Using harmony or Seurat's integration anchors preserves biological variation while removing technical artifacts.
- Continuous Transitions: Stem cell populations often exist along continuous phenotypic spectra rather than discrete clusters. Utilizing tools like UMAP with appropriate minimum distance parameters and density-based clustering can better capture these continua.
For optimal results, researchers should pilot different sequencing depths, cell numbers, and analytical parameters specific to their stem cell system and research questions, as requirements vary substantially between embryonic, adult, and induced pluripotent stem cell models.
Why scRNA-seq is Indispensable for Stem Cell Research
Single-cell RNA sequencing (scRNA-seq) has established itself as a transformative tool in genomics, capable of comprehensive transcriptomic profiling at a cellular level [4]. Unlike traditional bulk RNA sequencing, which provides population-averaged data, scRNA-seq enables researchers to detect cell subtypes or gene expression variations that would otherwise be overlooked [5]. This capability is particularly crucial in stem cell research, where cellular heterogeneity, rare progenitor populations, and subtle transitional states dictate developmental trajectories and therapeutic potential. The ability to analyze cells at the single-cell level is revolutionizing our understanding of organisms by allowing researchers to trace cell lineage and study tissue variability in detail [5]. In stem cell biology, where populations are inherently heterogeneous and dynamic, scRNA-seq provides the resolution necessary to dissect complex cellular ecosystems, identify novel subpopulations, and understand the molecular mechanisms driving cell fate decisions.
Key Advantages of scRNA-seq in Stem Cell Research
Unparalleled Resolution of Cellular Heterogeneity
Stem cell populations, even when morphologically similar, contain functionally distinct subpopulations with different differentiation potentials and proliferative capacities. scRNA-seq enables the dissection of this heterogeneity by revealing cell-specific characteristics and changes that remain hidden in bulk sequencing [5]. This technology has proven invaluable in studying how rare "outlier" cells affect disease progression, drug resistance, and tumor relapse – principles that directly apply to understanding stem cell behavior in development and regeneration [5]. By examining individual cells, researchers gain a unique perspective on the interactions between intrinsic cellular activities and external factors, such as environmental conditions or neighboring cell interactions, which influence cell fate [5].
Mapping Developmental Trajectories
scRNA-seq has emerged as a powerful method for reconstructing developmental trajectories and lineage relationships within stem cell populations. Through computational approaches that order cells along pseudotemporal axes, researchers can infer the sequence of transcriptional changes that occur as stem cells progress from primitive to more differentiated states [6]. This capability is particularly valuable for understanding the multistep process of hematopoietic differentiation, where stem cells give rise to progressively lineage-restricted cell types in a "hematopoietic tree" until mature blood cells are reached [2]. The method's ability to analyze the transcriptome at single-cell and single-base resolution enables unraveling gene expression networks in rare cell types and demonstrates the heterogeneity in gene expression within temporally and spatially separated cell populations [2].
Identification of Novel Stem Cell Markers and States
The high-resolution view provided by scRNA-seq facilitates the discovery of previously unrecognized stem cell markers and molecular signatures. For example, in hematopoietic stem/progenitor cells (HSPCs), scRNA-seq has revealed that subpopulations exist that are "primed" to pursue different cell fates before committing to a given lineage – a process characterized by the co-expression at low-level of genes encoding essential transcription factors linked to opposing lineages [2]. This priming phenomenon explains why HSPCs can co-express transcription factors associated with opposing lineages, supporting a model where hematopoietic cells can be "locked" into a specific cell destiny by the stochastic production of lineage-specific transcription factors over the noise threshold [2].
Table 1: Comparative Analysis of scRNA-seq vs Bulk RNA-seq in Stem Cell Research
| Feature | Bulk RNA Sequencing | Single-Cell RNA Sequencing |
|---|---|---|
| Resolution | Measures average gene expression across heterogeneous cells | Analyzes gene expression profiles of individual cells |
| Heterogeneity Detection | Masks cellular diversity | Reveals cellular subtypes and rare populations |
| Stem Cell Applications | Limited understanding of stem cell hierarchies | Enables reconstruction of developmental trajectories |
| Sensitivity to Rare Populations | Insensitive to rare stem cell subtypes | Identifies rare stem and progenitor cells |
| Biological Insights | Provides population-level overview | Reveals probabilistic gene expression and priming |
Experimental Design and Protocol Optimization
Stem Cell Isolation and Preparation
The foundation of successful scRNA-seq in stem cell research begins with optimal cell isolation and preparation. In hematopoietic stem cell research, HSPCs can be purified from human umbilical cord blood (UCB) among cell populations that express CD34 and CD133 (PROM1) antigens [2]. These cells can be further purified and sorted by FACS as CD34+Lin⁻CD45+ and CD133+Lin⁻CD45+ cells, with evidence suggesting that the CD133+ HSPC population is enriched for more primitive stem cells [2]. Critical considerations for stem cell preparation include:
- Cell Viability: Maintain high viability (>90%) through careful handling and minimal processing time
- Cell Sorting: Use stringent gating strategies to ensure population purity
- Input Cell Number: Account for potential cell loss during processing, though modern platforms can handle limited cell numbers [2]
- Control Populations: Include appropriate controls for comparative analysis
Library Preparation and Sequencing
For scRNA-seq library preparation of stem cells, the Chromium platform from 10X Genomics provides a robust workflow capable of processing HSPCs [2]. Key parameters include:
- Cell Encapsulation: Use Chromium Next GEM Chip G Single Cell Kit for efficient cell partitioning
- Library Construction: Employ Chromium Next GEM Single Cell 3′ GEM, Library & Gel Bead Kit v3.1
- Sequencing Parameters: Utilize Illumina NextSeq 1000/2000 with P2 flow cell chemistry (200 cycles) in paired-end sequencing mode (read 1–28 bp, read 2–90 bp), targeting 25,000 reads per single cell [2]
Table 2: Essential Research Reagents for scRNA-seq in Stem Cell Research
| Reagent/Category | Specific Examples | Function in Experimental Workflow |
|---|---|---|
| Cell Surface Markers | CD34, CD133, CD45, Lineage cocktail | Identification and isolation of specific stem cell populations |
| Cell Sorting Reagents | FACS antibodies, viability dyes | Purification of target stem cell populations |
| Library Preparation Kits | Chromium Next GEM Single Cell 3′ Kit | Generation of barcoded scRNA-seq libraries |
| Sequencing Reagents | Illumina sequencing kits | High-throughput sequencing of libraries |
| Bioinformatics Tools | Seurat, Scanpy, Cell Ranger | Processing, analysis, and interpretation of scRNA-seq data |
Analytical Framework: Seurat Workflow for Stem Cell Populations
Quality Control and Preprocessing
Quality control is particularly critical for stem cell scRNA-seq data, as these populations may exhibit distinct metabolic and transcriptional characteristics compared to differentiated cells. The standard Seurat workflow begins with rigorous QC metrics [7] [8]:
- Filtering Parameters: Exclude cells with fewer than 200 or more than 2,500 transcripts [2]
- Mitochondrial Threshold: Remove cells with >5% mitochondrial transcripts [2]
- Complexity Assessment: Evaluate the relationship between detected genes and total counts
For stem cells specifically, special consideration should be given to mitochondrial content thresholds, as some primitive stem populations may naturally exhibit different metabolic profiles. The preprocessing steps include normalization using the "LogNormalize" method with a scale factor of 10,000, followed by identification of highly variable features using the "vst" method [7].
Dimensionality Reduction and Clustering
Dimensionality reduction techniques are essential for visualizing and analyzing the high-dimensional scRNA-seq data from stem cells. The Seurat workflow incorporates:
- Principal Component Analysis (PCA): Linear dimensionality reduction to identify principal sources of variation [7]
- Clustering: Graph-based clustering using the Louvain algorithm on a k-nearest neighbor graph constructed in PCA space [9]
- Non-linear Visualization: UMAP (Uniform Manifold Approximation and Projection) for two-dimensional visualization of cell relationships [10]
The selection of principal components for clustering is a critical step that can be determined using statistical approaches like jackStraw or heuristic methods like the elbow plot [9]. For stem cell datasets, which often contain continuous developmental transitions rather than discrete clusters, the resolution parameter may need adjustment to appropriately capture the biological complexity.
Stem Cell-Specific Analytical Considerations
Stem cell datasets present unique analytical challenges that require specialized approaches:
- Trajectory Inference: Utilize pseudotime analysis to reconstruct developmental pathways [6]
- Stemness Scoring: Develop gene signature scores to quantify stem cell potency
- Cluster Annotation: Combine automated clustering with known stem cell markers for population identification
- Comparative Analysis: Implement integrative approaches to compare across conditions or time points [10]
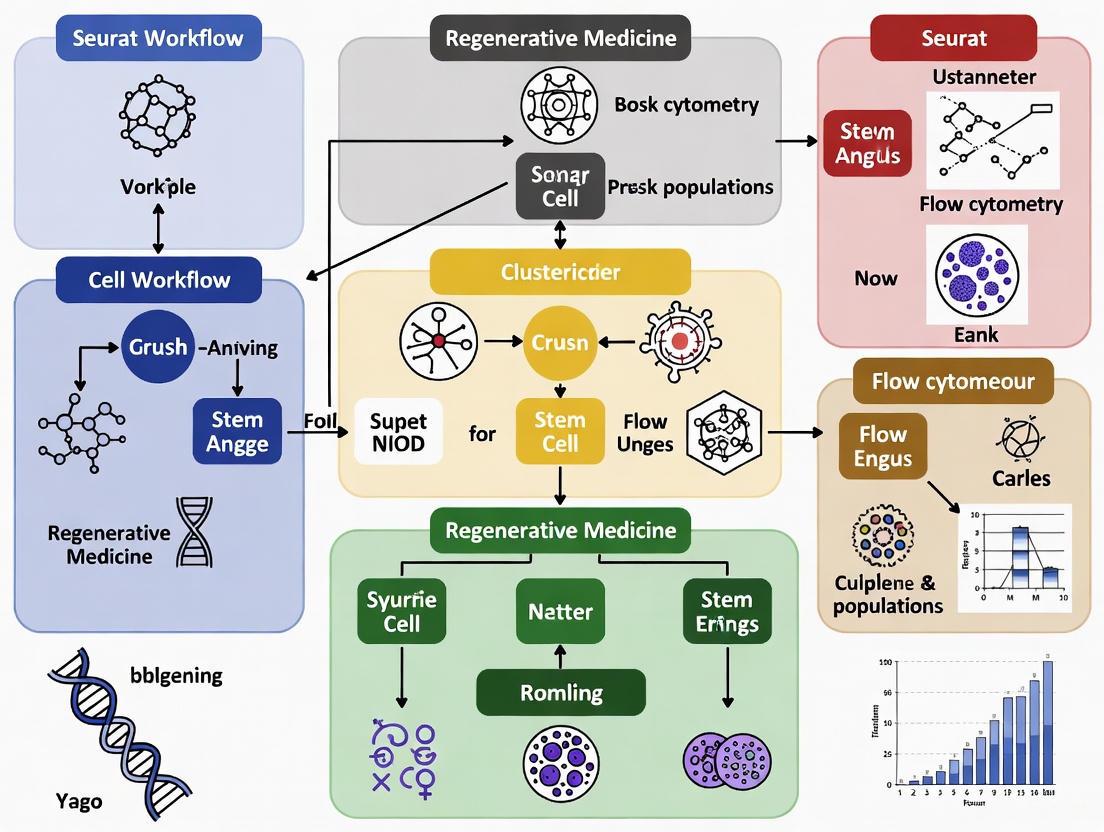
Figure 1: Comprehensive scRNA-seq Workflow for Stem Cell Analysis Using Seurat
Case Study: Hematopoietic Stem Cell Profiling
Experimental Framework
A recent study optimized scRNA-seq for human umbilical cord blood-derived hematopoietic stem and progenitor cells (HSPCs), providing a robust framework for stem cell analysis [2]. The researchers compared CD34+Lin⁻CD45+ and CD133+Lin⁻CD45+ HSPCs populations, addressing the molecular differences between these primitive cell types at the transcriptome level. The experimental design included:
- Cell Sorting: Using a MoFlo Astrios EQ cell sorter with stringent gating strategies
- Library Preparation: Chromium X Controller with 10X Genomics chemistry
- Sequencing: Illumina NextSeq 1000/2000 with target of 25,000 reads per cell
- Bioinformatic Analysis: Seurat (version 5.0.1) preceded by 10X Genomics Cell Ranger pipelines
Key Findings and Biological Insights
The analysis revealed that both CD34+ and CD133+ HSPC populations showed remarkable transcriptional similarity, evidenced by a very strong positive linear relationship between these cells (R = 0.99) [2]. This finding demonstrates the power of scRNA-seq to quantitatively compare closely related stem cell populations and identify subtle molecular differences that may have functional consequences. The study successfully identified subpopulations within these HSPCs and visualized them using UMAP, emphasizing the need for integrated analysis of datasets which may be merged and treated as "pseudobulk" for certain applications [2].
Advanced Analytical Techniques
Integration Methods for Comparative Analysis
When analyzing stem cell populations across multiple conditions, donors, or time points, integration of single-cell sequencing datasets becomes crucial [10]. Seurat's integration workflow enables researchers to:
- Identify Shared Cell States: Match conserved cell types and states across datasets
- Boost Statistical Power: Increase sample size for robust marker identification
- Facilitate Comparative Analysis: Enable accurate comparison across experimental conditions
The integration procedure aims to return a single dimensional reduction that captures the shared sources of variance across multiple layers, so that cells in a similar biological state will cluster together regardless of technical batch effects [10].
Trajectory-Aware Embedding Evaluation
For stem cell research, where developmental trajectories are of paramount importance, the evaluation of dimensionality reduction methods should consider both clustering accuracy and trajectory preservation. A recent study introduced the Trajectory-Aware Embedding Score (TAES), which jointly measures these aspects [6]. The findings demonstrate that:
- UMAP and t-SNE: Excel in clustering separation and local structure preservation
- Diffusion Maps: Particularly effective for revealing continuous developmental transitions
- PCA: While computationally efficient, often fails to capture complex nonlinear structures [6]
This comprehensive evaluation framework is especially relevant for stem cell biologists seeking to select appropriate dimensionality reduction methods for their specific research questions.
scRNA-seq has become an indispensable tool in stem cell research, providing unprecedented resolution to dissect cellular heterogeneity, identify novel subpopulations, and reconstruct developmental trajectories. The technology has dramatically advanced our understanding of stem cell biology, from hematopoietic development to the identification of primed subpopulations within seemingly homogeneous stem cell pools. The optimized workflows and analytical frameworks, particularly those implemented in Seurat, provide robust pipelines for extracting biologically meaningful insights from complex stem cell datasets.
As the field advances, emerging technologies like spatial transcriptomics and multi-omics approaches at single-cell resolution will further enhance our ability to characterize stem cells in their native contexts and understand the complex regulatory networks that govern their behavior. The continued refinement of computational methods for trajectory inference, integration of heterogeneous datasets, and visualization of complex cellular relationships will ensure that scRNA-seq remains at the forefront of stem cell research, driving discoveries in basic biology and therapeutic applications alike.
Seurat is an R package specifically designed for the quality control, analysis, and exploration of single-cell RNA-sequencing (scRNA-seq) data. Its primary aim is to enable researchers to identify and interpret sources of heterogeneity from single-cell transcriptomic measurements and to integrate diverse types of single-cell data [11]. Developed and maintained by the Satija Lab, Seurat has become one of the most widely utilized tools in single-cell bioinformatics, particularly valuable for investigating complex cellular systems such as stem cell populations. The package emphasizes clear, attractive, and interpretable visualizations, making it accessible to both computational biologists and wet-lab researchers [11].
The applicability of Seurat to stem cell research is particularly significant given the inherent heterogeneity and dynamic nature of stem cell populations. Stem cells exist in various states—naive, primed, differentiated, and transitioning—each characterized by distinct gene expression profiles. Seurat provides the analytical framework necessary to resolve these subtle yet biologically critical differences, enabling researchers to reconstruct developmental trajectories, identify novel progenitor populations, and understand the molecular underpinnings of cell fate decisions. With the release of Seurat v5, new functionalities for integrative multimodal analysis, enhanced scalability, and spatial data analysis have further expanded its utility for stem cell research [11].
Core Functionalities of Seurat
Data Preprocessing and Quality Control
The initial phase of any scRNA-seq analysis in Seurat involves creating a Seurat object and performing rigorous quality control. The standard preprocessing workflow begins with the CreateSeuratObject() function, which generates a Seurat object containing the count matrix where rows represent genes and columns represent individual cells [7]. This object serves as a container that holds both data (like the count matrix) and analysis results (such as PCA or clustering results) for a single-cell dataset throughout the analytical pipeline [7].
Quality control metrics commonly used in Seurat include [7]:
- The number of unique genes detected in each cell: Low-quality cells or empty droplets typically have very few genes, while cell doublets or multiplets may exhibit an aberrantly high gene count.
- The total number of molecules detected within a cell: This metric correlates strongly with unique gene counts and helps identify low-quality cells.
- The percentage of reads mapping to the mitochondrial genome: Low-quality or dying cells often exhibit extensive mitochondrial contamination due to compromised membranes.
In Seurat, mitochondrial QC metrics are calculated with the PercentageFeatureSet() function, which computes the percentage of counts originating from a set of features—typically all genes starting with "MT-" for mitochondrial genes [7]. Following QC assessment, cells are filtered using the subset() function to remove outliers based on user-defined thresholds. For example, a common approach filters cells that have unique feature counts over 2,500 or less than 200, and those with >5% mitochondrial counts [7].
Table 1: Standard QC Metrics and Filtering Thresholds for scRNA-seq Data
| QC Metric | Description | Typical Threshold | Biological Interpretation |
|---|---|---|---|
| nFeature_RNA | Number of unique genes detected per cell | 200-2,500 (varies by protocol) | Filters low-quality cells and doublets |
| nCount_RNA | Total number of molecules detected per cell | Protocol-dependent | Identifies outliers in sequencing depth |
| percent.mt | Percentage of mitochondrial reads | <5-10% | Excludes dying or stressed cells |
For stem cell datasets, particular attention must be paid to these QC metrics as stem cells often have unique metabolic properties that may affect mitochondrial gene expression. Additionally, researchers should be cautious not to over-filter potentially rare stem cell populations that might exhibit unusual but biologically meaningful gene expression patterns [12].
Normalization, Feature Selection, and Scaling
After removing unwanted cells, the next step involves normalizing the data to account for technical variability. By default, Seurat employs a global-scaling normalization method "LogNormalize" that normalizes the feature expression measurements for each cell by the total expression, multiplies this by a scale factor (10,000 by default), and log-transforms the result [7]. Normalized values are stored in pbmc[["RNA"]]$data in Seurat v5 [7].
The selection of highly variable features (genes) is a critical step that focuses downstream analysis on biologically relevant genes. Seurat calculates a subset of features that exhibit high cell-to-cell variation in the dataset using the FindVariableFeatures() function [7]. The default method models the mean-variance relationship inherent in single-cell data, returning 2,000 features per dataset by default. These variable genes will be used in downstream analyses like PCA.
Scaling is a linear transformation applied prior to dimensional reduction techniques. The ScaleData() function shifts the expression of each gene so that the mean expression across cells is 0, and scales the expression of each gene so that the variance across cells is 1 [7]. This gives equal weight in downstream analyses, preventing highly-expressed genes from dominating. The results are stored in pbmc[["RNA"]]$scale.data.
For stem cell researchers, an alternative normalization workflow called SCTransform() is worth considering as it replaces the need to run NormalizeData, FindVariableFeatures, or ScaleData and has been shown to provide improved results for heterogeneous datasets [7].
Dimensionality Reduction and Clustering
Dimensionality reduction is essential for visualizing and analyzing high-dimensional scRNA-seq data. Seurat performs principal component analysis (PCA) on the scaled data to identify linear combinations of genes that capture the maximum variance in the dataset [7]. The top principal components are then used as input for nonlinear dimensionality reduction techniques such as t-SNE and UMAP, which project cells into two-dimensional space for visualization.
Clustering represents a fundamental step in scRNA-seq analysis to empirically define groups of cells with similar expression profiles [13]. In stem cell research, clustering helps summarize population heterogeneity in terms of discrete labels that can be more easily interpreted than high-dimensional manifolds [13]. Seurat primarily uses graph-based clustering, which involves [13]:
- Building a graph where each node represents a cell connected to its nearest neighbors in the high-dimensional space.
- Weighting edges based on similarity between connected cells.
- Applying community detection algorithms to identify "communities" of cells that are more connected to each other than to cells in other communities.
The major advantage of graph-based clustering lies in its scalability and flexibility—it only requires a k-nearest neighbor search that can be done in log-linear time on average and avoids strong assumptions about cluster shape or distribution [13]. The most commonly used community detection algorithms in Seurat include Louvain and Leiden, both of which efficiently partition cells into distinct clusters [14].
Table 2: Comparison of Clustering Algorithms in Single-Cell Analysis
| Algorithm | Key Principles | Advantages | Limitations |
|---|---|---|---|
| Louvain | Modularity optimization | Fast, widely adopted | May produce disconnected communities |
| Leiden | Modularity optimization with refined partitioning | Guarantees well-connected communities | Slightly more computationally intensive |
| Walktrap | Random walks based distance | Hierarchical structure | Less scalable to very large datasets |
| Infomap | Information-theoretic approach | Captures complex network structures | Parameter sensitivity |
A critical consideration in clustering analysis is that there is no single "true clustering"—clusters represent empirical constructs that approximate biological truths like cell types or states [13]. The optimal clustering resolution depends on the biological question, with higher resolution appropriate for identifying rare subpopulations and lower resolution suitable for defining major lineages.
Cell Type Annotation and Marker Identification
Following clustering, the next critical step is annotating cell types by identifying cluster-specific marker genes. Seurat provides the FindAllMarkers() function to identify genes that are differentially expressed in each cluster compared to all other clusters. For stem cell datasets, this enables the identification of genes characteristic of specific stem cell states, progenitor populations, or differentiation intermediates.
Additionally, Seurat objects can be easily converted to SingleCellExperiment objects for compatibility with cell type annotation tools like SingleR, which uses reference datasets of purified cell types to automatically annotate single cells [15]. Reference datasets such as the HumanPrimaryCellAtlasData contained in the celldex package provide expression profiles of various cell types that can be leveraged to annotate stem cell populations and their derivatives [15].
For stem cell researchers, careful interpretation of marker genes is essential, as many stem cell populations share common markers and may exist along continuous differentiation trajectories rather than in discrete states. Integration of prior knowledge about stem cell biology is crucial for accurate annotation.
Advanced Features in Seurat v5 for Stem Cell Research
Integrative Multimodal Analysis with Bridge Integration
Seurat v5 introduces "bridge integration," a statistical method to integrate experiments measuring different modalities (i.e., separate scRNA-seq and scATAC-seq datasets) using a separate multiomic dataset as a molecular "bridge" [11]. This approach enables researchers to map cellular data from different molecular modalities onto a common reference framework.
For stem cell research, this capability is particularly valuable for:
- Mapping chromatin accessibility data onto transcriptomic references: This helps understand how epigenetic changes precede and regulate transcriptional programs during stem cell differentiation.
- Integrating protein abundance with gene expression: This enables more comprehensive characterization of stem cell surface markers and signaling pathways.
- Combining spatial data with dissociated single-cell data: This allows reconstruction of spatial patterning in stem cell niches from dissociated cells.
The bridge integration method addresses the challenge of matching shared cell types across datasets while preserving biological resolution, making it particularly suitable for investigating subtle differences between stem cell states [11].
Scalable Analysis for Large Datasets
With the increasing scale of single-cell sequencing datasets, Seurat v5 introduces new infrastructure and methods to analyze, interpret, and explore datasets spanning millions of cells [11]. This includes support for "sketch"-based analysis, where representative subsamples of a large dataset are stored in-memory to enable rapid and iterative analysis, while the full dataset remains accessible via on-disk storage.
This enhanced scalability is implemented through integration with the BPCells package, which enables high-performance analysis via innovative bit-packing compression techniques, optimized C++ code, and use of streamlined and lazy operations [11]. For stem cell researchers, this means the ability to analyze large-scale datasets containing complete differentiation trajectories or multiple time points without compromising analytical depth.
Spatial Transcriptomic Analysis
Seurat v5 introduces flexible and diverse support for a wide variety of spatially resolved data types, including both sequencing-based (Visium, SLIDE-seq) and imaging-based (MERFISH/Vizgen, Xenium, CosMX) technologies [11]. The package supports analytical techniques for scRNA-seq integration, deconvolution, and niche identification in spatial data.
This spatial analysis capability has profound implications for stem cell research, particularly in understanding:
- Stem cell niche organization: The spatial relationships between stem cells and their supporting cells.
- Pattern formation during development: How stem cells organize into complex tissues and organs.
- Regional identity in organoids: The extent to which stem cell-derived models recapitulate spatial organization.
The original Seurat method was actually developed specifically for spatial reconstruction of single-cell gene expression, demonstrating its foundational capability in this area [16]. In this approach, Seurat uses a computational strategy to infer cellular localization by integrating single-cell RNA-seq data with in situ RNA patterns, creating transcriptome-wide maps of spatial patterning [16].
Experimental Protocols for Stem Cell Dataset Analysis
Comprehensive Workflow for Stem Cell scRNA-seq Analysis
Workflow for analyzing stem cell scRNA-seq data using Seurat.
Detailed Protocol: From Raw Data to Clusters
Step 1: Data Input and Seurat Object Creation
- Load count data using
Read10X()function for Cell Ranger outputs orRead10X_h5()for h5 file format [7] - Create Seurat object:
pbmc <- CreateSeuratObject(counts = pbmc.data, project = "pbmc3k", min.cells = 3, min.features = 200)[7] - The object now contains the count matrix where rows are genes and columns are cells
Step 2: Quality Control and Filtering
- Calculate mitochondrial percentage:
pbmc[["percent.mt"]] <- PercentageFeatureSet(pbmc, pattern = "^MT-")[7] - Visualize QC metrics:
VlnPlot(pbmc, features = c("nFeature_RNA", "nCount_RNA", "percent.mt"), ncol = 3)[7] - Filter cells based on QC metrics:
pbmc <- subset(pbmc, subset = nFeature_RNA > 200 & nFeature_RNA < 2500 & percent.mt < 5)[7]
Step 3: Normalization and Variable Feature Selection
- Normalize data:
pbmc <- NormalizeData(pbmc, normalization.method = "LogNormalize", scale.factor = 10000)[7] - Identify variable features:
pbmc <- FindVariableFeatures(pbmc, selection.method = "vst", nfeatures = 2000)[7] - Scale data:
all.genes <- rownames(pbmc); pbmc <- ScaleData(pbmc, features = all.genes)[7]
Step 4: Dimensionality Reduction
- Perform linear dimensional reduction:
pbmc <- RunPCA(pbmc, features = VariableFeatures(object = pbmc))[7] - Examine PCA results:
DimPlot(pbmc, reduction = "pca")andElbowPlot(pbmc) - Run non-linear dimensional reduction (UMAP/t-SNE):
pbmc <- RunUMAP(pbmc, dims = 1:10)
Step 5: Clustering and Cluster Annotation
- Find neighbors:
pbmc <- FindNeighbors(pbmc, dims = 1:10) - Find clusters:
pbmc <- FindClusters(pbmc, resolution = 0.5)[7] - Visualize clusters:
DimPlot(pbmc, reduction = "umap", label = TRUE) - Identify marker genes:
cluster.markers <- FindAllMarkers(pbmc, only.pos = TRUE, min.pct = 0.25, logfc.threshold = 0.25)
Protocol for Integration of Multiple Stem Cell Datasets
Step 1: Preprocess Each Dataset Individually
- Follow Steps 1-4 above for each dataset separately
- Ensure consistent gene annotation across datasets
Step 2: Identify Integration Anchors
- Select features for integration:
features <- SelectIntegrationFeatures(object.list = list(dataset1, dataset2)) - Find integration anchors:
anchors <- FindIntegrationAnchors(object.list = list(dataset1, dataset2), anchor.features = features)[12]
Step 3: Integrate Datasets
- Integrate data:
combined <- IntegrateData(anchors = anchors)[12] - Specify the reference dataset if needed for stem cell lineage tracing
Step 4: Analyze Integrated Data
- Set default assay to integrated:
DefaultAssay(combined) <- "integrated" - Re-run scaling, PCA, and clustering on the integrated data
The Scientist's Toolkit: Essential Research Reagents and Computational Tools
Table 3: Essential Research Reagent Solutions for Stem Cell scRNA-seq
| Reagent/Resource | Function | Application in Stem Cell Research |
|---|---|---|
| 10x Genomics Chromium | Single-cell partitioning and barcoding | High-throughput capture of individual stem cells |
| SMART-seq reagents | Full-length transcript coverage | Detailed isoform analysis in rare stem cells |
| Cell Ranger | Processing of 10x Genomics data | Initial data processing and demultiplexing |
| Mitochondrial inhibitors | Stress induction control | Assessment of stress responses in stem cells |
| Dead cell removal kits | Sample quality enhancement | Removal of apoptotic cells before sequencing |
| Cell surface marker antibodies | FACS purification | Isolation of specific stem cell populations |
| Reference datasets (e.g., Human Cell Atlas) | Cell type annotation | Benchmarking and identifying novel populations |
Table 4: Computational Tools in the Seurat Ecosystem
| Tool/Package | Function | Utility for Stem Cell Research |
|---|---|---|
| Seurat R package | Comprehensive scRNA-seq analysis | Primary analytical framework |
| SingleR | Automated cell type annotation | Reference-based labeling of stem cells [15] |
| celldex | Reference dataset collection | Access to curated cell type signatures [15] |
| scICE | Clustering reliability assessment | Evaluating stability of stem cell clusters [14] |
| BPCells | High-performance computing | Scalable analysis of large stem cell datasets [11] |
| Loupe Browser | Visual exploration | Interactive analysis of clustering results [12] |
Addressing Challenges in Stem Cell Data Analysis
Ensuring Clustering Reliability
A significant challenge in stem cell scRNA-seq analysis is clustering inconsistency due to stochastic processes in clustering algorithms [14]. Simple changes in random seeds can lead to substantially different clustering outcomes, potentially affecting biological interpretations [14]. This is particularly problematic in stem cell research where identifying rare transitional states is crucial.
To address this, methods like single-cell Inconsistency Clustering Estimator (scICE) have been developed to evaluate clustering consistency and provide consistent clustering results [14]. scICE uses the inconsistency coefficient (IC) to assess clustering consistency across multiple runs with different random seeds, achieving up to 30-fold improvement in speed compared to conventional consensus clustering-based methods [14].
For stem cell researchers, implementing consistency checks is essential when:
- Identifying rare progenitor populations
- Reconstructing continuous differentiation trajectories
- Comparing stem cell states across experimental conditions
Biological Interpretation of Computational Results
A critical consideration in applying Seurat to stem cell datasets is that computational results require careful biological interpretation. As noted in Frontiers in Bioinformatics, "Blind application of mathematical methods in biology may lead to erroneous hypotheses and conclusions" [12]. This is particularly relevant for stem cell biology where:
- Small expression changes in key transcription factors can drive major fate decisions
- Post-transcriptional regulation may decouple mRNA and protein levels
- Cellular states exist along continuous trajectories rather than discrete clusters
Stem cell researchers should therefore integrate computational findings with experimental validation and consider biological context when interpreting clustering results, differential expression, and trajectory inferences.
The Seurat ecosystem provides a comprehensive, scalable, and continuously evolving toolkit for analyzing stem cell single-cell RNA-sequencing data. From standard processing workflows to advanced integrative analysis of multimodal data, Seurat enables researchers to unravel the complexity of stem cell populations, identify novel progenitor states, and reconstruct differentiation trajectories. The recent enhancements in Seurat v5, particularly bridge integration for multimodal data, sketch-based analysis for large datasets, and expanded spatial transcriptomics support, offer powerful new approaches for addressing fundamental questions in stem cell biology.
As single-cell technologies continue to advance, with increasing cell throughput and multimodal capabilities, the Seurat ecosystem is well-positioned to remain at the forefront of computational stem cell research. By combining these sophisticated computational tools with careful experimental design and biological validation, researchers can continue to deepen our understanding of stem cell identity, regulation, and therapeutic potential.
Key Biological Questions Addressable with Seurat Clustering
Single-cell RNA sequencing (scRNA-seq) has revolutionized our ability to dissect cellular heterogeneity, a cornerstone of stem cell and developmental biology. The Seurat toolkit provides a comprehensive analytical framework for processing and clustering scRNA-seq data, enabling researchers to address complex biological questions. These applications include delineating novel cell subtypes, identifying rare progenitor populations, reconstructing differentiation trajectories, and characterizing functionally distinct cellular states. This protocol details a standardized Seurat workflow, from quality control to advanced downstream analyses, with a specific focus on its utility in stem cell population research. We provide step-by-step application notes, experimental validation methods, and structured data presentation frameworks to guide researchers in leveraging Seurat for uncovering critical insights into stem cell biology and therapeutic development.
Stem cell populations are inherently heterogeneous, comprising mixtures of multipotent progenitors, differentiating intermediates, and mature effector cells. Seurat facilitates the analysis of this complexity by grouping cells based on transcriptional similarities, providing a data-driven foundation for biological discovery [17]. Its clustering function, which typically follows quality control, normalization, and dimensionality reduction, groups cells into distinct populations that often correspond to unique biological states or identities [7] [17]. In stem cell research, this capability is paramount for moving beyond bulk population averages to understand cell fate decisions at a single-cell resolution. The standard workflow involves constructing a shared nearest neighbor (SNN) graph from reduced dimensions and then applying a smart local moving algorithm to identify partition clusters [18]. The biological interpretation of these computationally derived clusters—through marker gene identification and annotation—transforms mathematical groupings into functionally relevant insights [17]. This process is instrumental for identifying rare cell types critical to pathogenesis and biological processes, which are often overlooked during initial clustering phases due to their low abundance [19]. By integrating Seurat's robust clustering with targeted downstream analyses, researchers can systematically explore the cellular architecture of complex stem cell systems.
Key Biological Questions and Analytical Protocols
Delineating Cellular Heterogeneity and Identifying Novel Subpopulations
Biological Rationale: Complex tissues and in vitro stem cell cultures contain a spectrum of cellular states. Seurat clustering enables the deconvolution of this continuum into discrete, transcriptionally defined subpopulations, which may represent previously unknown cell types or states with unique functional properties [20]. For example, in hematopoietic multipotent progenitors (MPPs), distinct sub-populations with unique biomolecular and functional properties have been identified through multi-omic single-cell analyses [21].
Seurat Protocol:
- Data Preprocessing and Integration: Begin with standard quality control using the
CreateSeuratObjectfunction, filtering cells based on metrics like the number of detected genes and mitochondrial percentage [7]. For multi-sample studies, integrate datasets using functions likeIntegrateDatato correct for batch effects [17]. - Clustering and Visualization: Perform linear dimensionality reduction (PCA) followed by graph-based clustering on the principal components using the
FindNeighborsandFindClustersfunctions. The resolution parameter should be optimized to reveal meaningful biological structure without over-partitioning [20]. Visualize the resulting clusters in two dimensions with UMAP [17]. - Marker Gene Identification: Use the
FindAllMarkersfunction to identify differentially expressed genes (DEGs) for each cluster. These genes serve as potential markers for novel subpopulations [17]. - Annotation and Interpretation: Compare the identified marker genes against known cell-type-specific signatures from public databases or prior literature to biologically annotate each cluster [17].
Table 1: Key Seurat Functions for Heterogeneity Analysis
| Function | Purpose | Key Parameters |
|---|---|---|
CreateSeuratObject |
Initializes Seurat object and initial QC | min.cells, min.features |
FindVariableFeatures |
Identifies genes for downstream analysis | nfeatures |
ScaleData |
Scales data for PCA | vars.to.regress |
RunPCA |
Performs linear dimensionality reduction | npcs |
FindNeighbors |
Constructs SNN graph | dims (PCs to use) |
FindClusters |
Performs graph-based clustering | resolution |
RunUMAP |
Non-linear dimensionality reduction | dims |
FindAllMarkers |
Finds DEGs for all clusters | logfc.threshold |
Figure 1: Core Seurat Clustering Workflow. This diagram outlines the standard pipeline for processing scRNA-seq data to identify cell subpopulations.
Identification of Rare Progenitor Cells
Biological Rationale: Rare progenitor cells, such as a CD69+ MPP with long-term engraftment potential in human bone marrow, are biologically crucial but computationally challenging to detect due to their low abundance [21]. Standard clustering may group them with more abundant cell types. Advanced methods that augment Seurat's standard workflow are required.
Specialized Protocol:
- Enhanced Feature Selection: Move beyond the standard highly variable genes. Use an ensemble feature selection method that combines initial clustering labels with a random forest model to better preserve differential signals from rare types [19].
- Iterative Cluster Decomposition: Apply the scCAD algorithm principle. After initial Seurat clustering, iteratively decompose major clusters based on the most differential signals within each cluster to separate rare cell types that are initially indistinguishable [19].
- Anomaly Detection: Post-decomposition, use an isolation forest model on candidate differentially expressed gene lists to calculate an anomaly score for all cells. An independence score can then measure each cluster's rarity, helping to pinpoint rare progenitors [19].
- Experimental Validation: Candidates identified computationally must be validated experimentally. For a putative rare
CD69+MPP, this involves FACS sorting based on the surface markers (Lin⁻CD34⁺CD38dim/loCD69⁺) and performing functional assays like transplantation to confirm long-term engraftment and multilineage differentiation potential [21].
Table 2: Methods for Rare Cell Identification
| Method | Principle | Advantage |
|---|---|---|
| Standard Seurat Clustering | Graph-based clustering on variable genes | Identifies major cell populations efficiently |
| scCAD [19] | Cluster decomposition-based anomaly detection | Iteratively separates rare types; high accuracy |
| scSID [22] | Single-cell similarity division algorithm | Considers inter- and intra-cluster similarity |
| LMD [23] | Localized Marker Detector | Identifies genes in tight cell neighborhoods without pre-clustering |
Mapping Differentiation Trajectories and Cellular States
Biological Rationale: Stem cell differentiation is a dynamic process. Seurat clustering provides a snapshot of the cellular states present, which can be ordered into a pseudotemporal trajectory to reconstruct the sequence of transcriptional changes from a pluripotent to a differentiated state [20]. This is crucial for understanding transitions, such as from embryonic stem cells (ESCs) to feeder-free extended pluripotent stem cells (ffEPSCs) [20].
Seurat and Pseudotime Protocol:
- State Definition via Clustering: Perform high-resolution clustering to capture not only terminal states but also intermediate, transient populations. Adjust the
FindClustersresolution parameter gradually until populations separate distinctly [20]. - Trajectory Inference: Export the Seurat object to a trajectory analysis tool (e.g., Monocle, PAGA). These tools order cells along a pseudotime axis based on transcriptional progression.
- Gene Dynamics Analysis: Identify genes that change expression along the inferred trajectory. In the ESC to ffEPSC transition, this reveals critical molecular pathways involved in the shift from primed to extended pluripotency [20].
- Functional Enrichment: Perform Gene Set Enrichment Analysis (GSEA) on the pseudotime-dependent genes to identify key biological pathways and regulatory networks active during the transition [20].
Figure 2: Pseudotime Trajectory Concept. Cells are ordered from a starting state (e.g., ESC) through intermediate states to an end state (e.g., differentiated cell), revealing the dynamics of gene expression.
The Scientist's Toolkit: Research Reagent Solutions
Table 3: Essential Reagents and Resources for scRNA-seq Analysis of Stem Cell Populations
| Reagent / Resource | Function / Purpose | Example in Protocol |
|---|---|---|
| Cell Culture Media | Maintains specific pluripotency states or induces differentiation | mTeSR1 for primed ESCs; LCDM-IY for ffEPSC transition [20] |
| Dissociation Reagent | Generates single-cell suspensions for sequencing | Accutase for ESCs; TrypLE for ffEPSCs [20] |
| Surface Marker Antibodies | Fluorescence-activated cell sorting (FACS) for isolation and validation | Antibodies against Lin, CD34, CD38, CD69 for human HSPC sub-populations [21] |
| Library Prep Kit | Converts cellular mRNA into sequencable libraries | Smart-seq2 protocol for high-resolution full-length transcript sequencing [20] |
| Reference Genome | Alignment and quantification of sequencing reads | GRCh38 for human; T2T for repeat element analysis [20] |
| Analysis Software & Packages | Data processing, clustering, and biological interpretation | Seurat [7] [17], singleCellHaystack (clustering-independent DEGs) [24], LMD (marker identification) [23] |
Seurat provides a powerful and flexible framework for probing the complexities of stem cell biology through scRNA-seq data. Its application extends beyond simple cell type classification to addressing fundamental questions about cellular heterogeneity, rare progenitor identification, and the dynamics of differentiation. By following the detailed protocols outlined herein—which integrate Seurat's standard functions with specialized algorithms for rare cell detection and trajectory analysis—researchers can systematically uncover and validate novel biological insights. The ongoing development of new methods, such as scCAD and LMD, continues to enhance the resolution and accuracy of these analyses, promising to further advance our understanding of stem cell populations in health, disease, and regeneration.
The journey from a biological sample to insightful single-cell RNA sequencing (scRNA-seq) data requires meticulous experimental design and execution. This process is particularly critical in stem cell research, where cellular heterogeneity and rare cell populations are of paramount interest. The integrity of downstream computational analyses, including clustering and differential expression performed using tools like Seurat, is fundamentally dependent on the quality of the initial wet-lab procedures. This article details the key considerations and protocols for transitioning from cell sorting to sequencing-ready libraries, framed within the context of a broader thesis utilizing the Seurat workflow for clustering and analyzing stem cell populations.
Critical Pre-sequencing Workflow Stages
Cell Isolation and Sorting
The initial stage of any scRNA-seq experiment on stem cell populations is the effective isolation of the target cells. For rare populations like Hematopoietic Stem and Progenitor Cells (HSPCs), this typically involves fluorescence-activated cell sorting (FACS) to achieve a pure, viable cell suspension.
Protocol: FACS of Human Umbilical Cord Blood HSPCs [2]
- Sample Preparation: Dilute human umbilical cord blood (hUCB) with phosphate-buffered saline (PBS) and layer it over a Ficoll-Paque density gradient. Centrifuge for 30 minutes at 400x g to isolate the mononuclear cell (MNC) fraction.
- Antibody Staining: Resuspend MNCs and stain with a conjugated antibody cocktail. A typical panel includes:
- Lineage (Lin) Markers (FITC-conjugated): A cocktail for negative selection, including antibodies against CD235a, CD2, CD3, CD14, CD16, CD19, CD24, CD56, and CD66b.
- CD45 (PE-Cy7-conjugated): A pan-hematopoietic marker.
- CD34 (PE-conjugated) or CD133 (APC-conjugated): Key markers for HSPC enumeration.
- Cell Sorting: Incubate stained cells in the dark at 4°C for 30 minutes, then wash and resuspend in RPMI-1640 medium with 2% FBS. Sort using a high-performance sorter (e.g., MoFlo Astrios EQ). The sorting strategy should first gate on small, lymphocyte-like events (2–15 μm), then select Lin‑negative events, and finally isolate the target populations: CD34+Lin‑CD45+ and/or CD133+Lin‑CD45+ HSPCs.
Table 1: Key Surface Markers for Hematopoietic Stem/Progenitor Cell Sorting [2]
| Marker | Conjugation | Function in Sorting Strategy |
|---|---|---|
| Lineage Cocktail | FITC | Negative selection; removes differentiated cells |
| CD45 | PE-Cy7 | Positive selection; identifies hematopoietic cells |
| CD34 | PE | Positive selection; identifies HSPCs |
| CD133 | APC | Positive selection; identifies primitive stem cells |
Single-Cell Library Preparation
Once sorted, cells must be immediately processed to construct scRNA-seq libraries. The 10X Genomics Chromium platform is a widely adopted droplet-based method for this purpose.
Protocol: Single-Cell 3' Library Preparation using 10X Genomics [2]
- Instrument and Kit: Process sorted cells directly using a Chromium X Controller and the Chromium Next GEM Chip G Single Cell Kit.
- Library Construction: Use the Chromium Next GEM Single Cell 3' GEM, Library & Gel Bead Kit v3.1 according to the manufacturer's guidelines. This process encapsulates single cells in droplets (GEMs) with barcoded beads for reverse transcription.
- Library Amplification and Indexing: Following reverse transcription, break the droplets, amplify the cDNA, and enzymatically fragment it while adding adapter sequences. Then, use the Single Index Kit T Set A to index the libraries during a final PCR amplification. Pool finished libraries for sequencing.
- Sequencing: Load libraries on a high-throughput sequencer like the Illumina NextSeq 1000/2000. A common configuration for 3' gene expression libraries is a paired-end run (Read 1: 28 bp, Read 2: 90 bp) on a P2 flow cell, aiming for a sequencing depth of approximately 25,000 reads per cell.
The following diagram illustrates the complete experimental and computational workflow, from the original biological sample to the final clustered data.
Quality Control and Seurat Preprocessing
Following sequencing and initial processing with Cell Ranger, the count data is imported into Seurat for quality control (QC) and analysis. The decisions made at the QC stage are critical for all subsequent results [25].
Protocol: Initial Seurat Object Creation and QC [7] [26] [25]
- Data Import and Object Creation: Use
Read10X()to import the output from Cell Ranger, then create a Seurat object withCreateSeuratObject(counts = pbmc.data, project = "pbmc3k", min.cells = 3, min.features = 200). This step automatically calculates the number of unique genes (nFeature_RNA) and total molecules (nCount_RNA) per cell. - Mitochondrial QC Metric: Calculate the percentage of mitochondrial reads using
pbmc[["percent.mt"]] <- PercentageFeatureSet(pbmc, pattern = "^MT-"). A high percentage indicates poor-quality or dying cells [7] [26]. - Cell Filtering: Filter out low-quality cells based on user-defined thresholds. A common approach is to subset the object:
subset(pbmc, subset = nFeature_RNA > 200 & nFeature_RNA < 2500 & percent.mt < 5)[7] [2] [26]. This removes cells with too few or too many genes (potential empty droplets/doublets) and cells with high mitochondrial contamination.
Table 2: Standard QC Metrics and Filtering Thresholds for scRNA-seq Data [7] [2] [26]
| QC Metric | Description | Common Threshold (e.g., PBMC) | Rationale |
|---|---|---|---|
nFeature_RNA |
Number of unique genes detected per cell | 200 - 2500 | Prevents empty droplets (low) and multiplets (high) |
nCount_RNA |
Total number of molecules detected per cell | Varies by experiment | Correlates strongly with nFeature_RNA |
percent.mt |
Percentage of reads mapping to mitochondrial genome | < 5% | Filters out low-quality/dying cells |
The Scientist's Toolkit: Essential Research Reagents and Materials
Successful execution of the workflow from cell sorting to analysis requires a suite of reliable reagents and computational tools.
Table 3: Key Research Reagent Solutions and Materials [2]
| Item | Function / Application | Example Product / Method |
|---|---|---|
| Ficoll-Paque | Density gradient medium for isolation of mononuclear cells from whole blood. | Ficoll-Paque (GE Healthcare) |
| Fluorochrome-conjugated Antibodies | Cell surface marker staining for identification and isolation of specific cell populations via FACS. | Anti-CD34 (PE), Anti-CD133 (APC), Anti-CD45 (PE-Cy7), Lineage Cocktail (FITC) |
| Cell Sorter | High-speed, high-precision isolation of live cells based on fluorescent labeling. | MoFlo Astrios EQ (Beckman Coulter) |
| Single-Cell Library Prep Kit | All-in-one reagent kit for generating barcoded sequencing libraries from single-cell suspensions. | Chromium Next GEM Single Cell 3' Kit v3.1 (10X Genomics) |
| Sequencing Platform | High-throughput sequencing of prepared libraries. | Illumina NextSeq 1000/2000 |
| Primary Analysis Pipeline | Demultiplexing, barcode processing, alignment, and gene counting from raw sequencing data. | Cell Ranger (10X Genomics) |
| Analysis R Package | Comprehensive toolkit for downstream analysis of single-cell data, including QC, normalization, clustering, and differential expression. | Seurat |
A robust scRNA-seq experiment is built on a foundation of careful experimental design. From the initial sorting of defined stem cell populations using specific surface markers to the construction of high-quality sequencing libraries, each step introduces potential sources of variation and bias. Adherence to detailed, optimized protocols for cell handling and library preparation, coupled with stringent quality control both in the wet lab and during the initial computational processing in Seurat, is non-negotiable. By integrating these meticulous experimental practices with the powerful analytical capabilities of the Seurat workflow, researchers can ensure the generation of reliable, reproducible, and biologically insightful data on the complexity of stem cell populations.
A Step-by-Step Seurat v5 Workflow for Stem Cell Clustering and Annotation
Initial Data Loading and Seurat Object Creation from 10X or Other Formats
Within the broader framework of employing Seurat for clustering and analyzing stem cell populations, the initial step of correctly loading data and creating a Seurat object is foundational. This process transforms raw sequencing outputs into a structured object that facilitates all subsequent analyses, including the identification of novel stem cell subtypes, the investigation of differentiation trajectories, and the response to pharmacological stimuli. This protocol details the methodologies for data loading from common formats, specifically the 10X Genomics pipeline, and the subsequent creation of a properly structured Seurat object, which is critical for ensuring the reproducibility and reliability of research in stem cell biology and drug development.
Understanding the Input Data Structure
The 10X Genomics Output Format
The standard output from the Cell Ranger pipeline (10X Genomics) consists of three essential files that constitute the raw count matrix [27] [7]. These files are typically found in a directory named filtered_gene_bc_matrices.
Table 1: Core Files in 10X Genomics Output
| File Name | Description | Content Example |
|---|---|---|
matrix.mtx (or .mtx.gz) |
A sparse matrix file in Matrix Market format. | Stores the non-zero gene expression counts (UMIs) efficiently. |
barcodes.tsv (or .tsv.gz) |
A text file containing cell barcodes. | Each row is a cell identifier (e.g., "AAACATACAACCAC-1"). |
genes.tsv / features.tsv (or .tsv.gz) |
A text file containing gene identifiers and names. | Each row corresponds to a gene (e.g., "ENSG00000187634" "ISG15"). |
It is crucial to note that for Cell Ranger versions >= 3.0, the genes.tsv file is replaced by features.tsv.gz, which can also contain data for multiple feature types, such as Gene Expression and Antibody Capture (CITE-seq) [27]. The Read10X function automatically handles this complexity, returning a list of matrices if multiple data types are present.
Anatomy of a 10X Barcoded cDNA Library
Understanding the structure of the sequenced library illuminates the origin of the data loaded into Seurat. The 10X 3' Gene Expression assay produces cDNA molecules containing several key regions [28]:
- P5/P7 Adapters & i5/i7 Indexes: Universal sequences and dual indices used for binding to the flow cell and multiplexing libraries.
- Cell Barcode (10X Barcode): A unique sequence that identifies the cell of origin for every transcript.
- Unique Molecular Identifier (UMI): A random barcode that tags individual mRNA molecules to enable accurate quantification and account for amplification bias.
- Poly(dT) Sequence: Captures the poly-A tail of mRNA.
- cDNA Insert: The actual sequence of the captured transcript.
Experimental Protocol: Loading Data and Creating a Seurat Object
Step-by-Step Methodology
Step 1: Load Required R Packages Before beginning, ensure the necessary packages are installed and loaded.
Step 2: Read the 10X Data into R
Use the Read10X() function to read the output directory from Cell Ranger. This function automatically detects the relevant files and returns a sparse matrix [27] [7].
For Cell Ranger >=3.0 with multiple data types:
Step 3: Initialize the Seurat Object
Create the Seurat object using the CreateSeuratObject() function. This object serves as a container for all data and analyses [7] [26].
Upon creation, the object automatically computes and stores basic quality control metrics in the meta.data slot: nCount_RNA (total UMIs per cell) and nFeature_RNA (number of unique genes detected per cell) [7].
Table 2: Key Parameters for CreateSeuratObject
| Parameter | Default Value | Function and Impact on Data |
|---|---|---|
counts |
(Unassigned) | The unnormalized data matrix (e.g., from Read10X). |
project |
"SeuratProject" | A character string to label the project. |
min.cells |
0 | Include features/genes detected in at least this many cells. Reduces noise from lowly expressed genes. |
min.features |
0 | Include cells where at least this many features are detected. Filters out empty droplets/low-quality cells. |
Workflow Visualization
The following diagram illustrates the logical flow from raw sequencing data to a Seurat object ready for analysis.
The Scientist's Toolkit: Essential Research Reagents and Materials
Table 3: Key Research Reagent Solutions for 10X Single-Cell RNA Sequencing
| Reagent / Material | Function in the Experimental Workflow |
|---|---|
| 10X Genomics 3' Gene Expression Kit | The core reagent kit for partitioning single cells, barcoding transcripts, and preparing sequencing libraries. |
| Single Cell Suspension | A critical starting material. For stem cells, this requires careful dissociation into a viable, single-cell suspension in a buffer like PBS with 0.04% BSA, free of inhibitors like high EDTA [28]. |
| Viability Dye (e.g., DAPI, Propidium Iodide) | Used to assess cell viability prior to loading onto the 10X chip, ensuring a high proportion of living cells (>90% is ideal) [28]. |
| RNase Inhibitors | Protect RNA from degradation during sample preparation, especially for sensitive samples like stem cells. |
| Cell Ranger Software (10X Genomics) | The primary computational pipeline for demultiplexing raw sequencing BCL files, aligning reads to a reference genome, and generating the count matrix files used by Seurat. |
| Seurat R Package | The primary software environment for downstream analysis of the count matrix, including normalization, clustering, and differential expression. |
Additional Data Loading Scenarios and Considerations
Handling Non-10X or Custom Data
While 10X is a common platform, Seurat can ingest data from other sources (e.g., Drop-seq, inDrop, or custom protocols). The key is to create a count matrix where rows are genes and columns are cells, which can then be passed directly to CreateSeuratObject() [29].
Loading Spatial Transcriptomics Data
For data from 10X Visium spatial gene expression platforms, Seurat provides a specialized loading function, Load10X_Spatial() [30]. This function reads the output of the spaceranger pipeline and returns a Seurat object containing both the spot-level expression data and the associated tissue image.
Preliminary Quality Control During Object Creation
Setting appropriate min.cells and min.features parameters during object creation performs an initial data filter. A typical starting point is min.features = 200 to remove empty droplets or severely damaged cells, which is particularly relevant for preserving high-quality stem cell populations for analysis [7] [29].
The precise loading of 10X Genomics data and the creation of a Seurat object, as outlined in this protocol, establishes a robust foundation for any single-cell RNA sequencing study. In the context of stem cell research, this initial step is paramount for ensuring that subsequent analyses—such as identifying pluripotent and committed progenitor states, mapping differentiation pathways, and screening drug effects—are built upon accurate and well-structured data. Mastery of this protocol empowers researchers to reliably commence their exploration of cellular heterogeneity using the Seurat toolkit.
Within the framework of a broader thesis on the Seurat workflow for clustering and analyzing stem cell populations, the implementation of stringent, biologically-informed quality control (QC) is a critical first step. Single-cell RNA sequencing (scRNA-seq) data analysis is susceptible to artifacts from low-quality cells, such as dying cells, empty droplets, or doublets, which can obfuscate true biological signals and lead to misinterpretations. For stem cell research, where uncovering subtle cellular states and heterogeneity is paramount, rigorous QC is especially vital. This protocol outlines a standardized workflow for filtering cells based on three cornerstone QC metrics: the number of genes detected per cell (nFeature_RNA), the total number of RNA molecules detected per cell (nCount_RNA), and the percentage of reads mapping to the mitochondrial genome (percent.mt). The guidelines provided here are designed to be integrated into the standard Seurat analysis pipeline, ensuring that downstream clustering and analysis are performed on a high-quality set of viable cells.
## The Critical QC Metrics and Their Biological Significance
The initial phase of scRNA-seq analysis involves calculating key QC metrics that serve as proxies for cell quality. These metrics are automatically computed and stored in the metadata of a Seurat object upon its creation and can be easily visualized and explored.
Table 1: Core Quality Control Metrics in scRNA-seq Analysis
| Metric | Seurat Column Name | Technical Interpretation | Biological Interpretation |
|---|---|---|---|
| Number of Genes per Cell | nFeature_RNA |
Low counts may indicate empty droplets; high counts may indicate doublets. | Reflects transcriptional complexity; can vary by cell type and state [7] [8]. |
| UMI Counts per Cell | nCount_RNA |
Correlates strongly with nFeature_RNA; low counts suggest poor-quality cells. |
Indicates total RNA content; subject to biological variation [8]. |
| Mitochondrial RNA Percentage | percent.mt |
High percentage is associated with cell stress, damage, or apoptosis. | Can indicate metabolic activity; naturally higher in some active cells [31] [8]. |
The calculation of the mitochondrial percentage is species-specific. For human data, the pattern "^MT-" is used, whereas for mouse data, the pattern "^mt-" is applied [8]. The following code demonstrates how to add this metric to a Seurat object:
## Establishing Filtering Thresholds for Stem Cell Populations
Setting appropriate filtering thresholds is not a one-size-fits-all process and must be informed by the biological system under investigation. This is particularly true for stem cells, which may exhibit unique metabolic profiles.
### General Guidelines and Visualization
A standard initial approach involves visualizing the distribution of QC metrics across all cells to identify outliers.
Scatter plots are invaluable for identifying distinct populations of low-quality cells, which often appear as clusters with high percent.mt and low nFeature_RNA/nCount_RNA [7] [26].
### The Challenge of Mitochondrial Filtering in Specialized Cells
Conventional QC practices that use rigid thresholds for mitochondrial content (e.g., 5-10%) risk eliminating biologically relevant cell populations. Recent research on cancer cells has demonstrated that malignant cells can exhibit significantly higher baseline mitochondrial gene expression without a notable increase in dissociation-induced stress scores [31]. This finding is highly relevant to stem cell biology, as certain stem cell populations, such as mesenchymal stem cells (MSCs) from different tissues, are known to be highly metabolically active and heterogeneous [32]. Overly stringent filtering on percent.mt could therefore deplete viable, metabolically altered stem cell subpopulations with critical functional roles.
Table 2: Adaptive Threshold Considerations for Stem Cell QC
| Cell System | Potential Challenge | Recommended Action |
|---|---|---|
| Metabolically Active Stem Cells (e.g., certain MSC subpopulations) | High baseline percent.mt due to active respiration, not cell death [31] [32]. |
Use less stringent thresholds; validate viability with stress gene signatures. |
| Primary & Cultured Stem Cells | Sensitivity to dissociation, potentially increasing stress and percent.mt. |
Compare with bulk RNA-seq if available [31]; consider using data-driven adaptive thresholds (e.g., Median Absolute Deviation). |
| Mixed Differentiation States | A wide range of UMI/gene counts as cells transition from quiescent to active states. | Avoid filtering out low-count quiescent stem cells; be cautious of high-count doublets. |
The following diagram illustrates the decision-making workflow for applying these quality control filters, emphasizing the context-dependent nature of mitochondrial filtering.
## Experimental Protocol: A Step-by-Step Seurat Workflow
This section provides a detailed, actionable protocol for implementing strict quality control within the Seurat environment, tailored for stem cell datasets.
### Step 1: Data Input and Initialization
Load the data and create a Seurat object. The min.cells and min.features parameters provide an initial, gentle filter.
### Step 2: Calculate QC Metrics
Add the mitochondrial and, optionally, ribosomal RNA percentages.
### Step 3: Visualize and Determine Thresholds
Generate diagnostic plots to inform threshold selection, as described in Section 3.2.
### Step 4: Apply Cell Filtering
Subset the Seurat object based on the chosen thresholds. The following code shows a conservative example, but thresholds must be adapted based on the visualizations and biological context.
### Step 5: Post-Filtering Validation and Downstream Analysis
After filtering, proceed with the standard Seurat workflow, beginning with data normalization.
The entire workflow, from quality control to initial clustering, is summarized in the following diagram.
## The Scientist's Toolkit: Research Reagent Solutions
Table 3: Essential Reagents and Tools for scRNA-seq in Stem Cell Research
| Item | Function / Application | Example / Note |
|---|---|---|
| Collagenase IV | Digestion of adipose tissue for isolation of Adipose-derived MSCs (AD-MSCs) [32]. | Concentration: 0.1% in PBS with 1% BSA; 60 min digestion at 37°C. |
| Dispase II | Enzymatic separation of dermal tissue for isolation of Dermal MSCs [32]. | Concentration: 1 mg/ml; can be incubated overnight at 4°C. |
| Ficoll / Percoll | Density gradient centrifugation media for isolation of mononuclear cells from bone marrow [32]. | Critical for enriching Bone Marrow MSCs (BM-MSCs) from aspirates. |
| Basic Fibroblast Growth Factor (bFGF) | Key component in culture medium to promote MSC proliferation and maintain stemness [32]. | Typical concentration: 1-10 ng/ml. |
| Flow Cytometry Antibodies (CD90, CD73, CD105, CD11b, CD19, CD34, CD45, HLA-DR) | Validation of MSC surface marker profile (positive for CD90, CD73, CD105; negative for hematopoietic markers) pre-scRNA-seq [32]. | Essential quality control step before sequencing. |
| scDblFinder / DoubletFinder | R packages for computational identification and removal of doublets from scRNA-seq data [29] [33]. | Should be used in addition to UMI/gene count filtering. |
| SoupX | R package for correction of ambient RNA contamination in droplet-based scRNA-seq [33]. | Improves data quality by removing background noise. |
| SingleR / cellHint | Tools for automated, reference-based annotation of cell types following clustering [34] [29]. | Leverages reference datasets to identify stem cell and differentiation states. |
The rigorous quality control of scRNA-seq data is the foundation upon which reliable clustering and analysis of stem cell populations are built. By moving beyond rigid, one-size-fits-all thresholds—particularly for mitochondrial content—and adopting a context-aware filtering strategy that respects the unique biology of stem cells, researchers can preserve critical subpopulations and gain a more accurate understanding of cellular heterogeneity. The integrated workflow presented here, combining standard Seurat functions with tailored experimental and computational checks, provides a robust protocol for ensuring that downstream insights into stem cell biology are derived from high-quality, viable cells.
Normalization and Selection of Highly Variable Features using SCTransform
Within the framework of a broader thesis investigating stem cell populations using single-cell RNA sequencing (scRNA-seq), data normalization and feature selection represent critical foundational steps. Technical variability, such as differences in sequencing depth, often confounds biological heterogeneity. This protocol details the application of SCTransform, a computational method that integrates normalization, variance stabilization, and the selection of highly variable features into a single robust workflow. Compared to the conventional log-normalization approach, SCTransform more effectively removes technical artifacts, enhances the identification of biologically relevant genes, and sharpens downstream clustering, proving particularly valuable for delineating subtle differences in stem cell states and lineages [35] [36].
Single-cell RNA sequencing has revolutionized the study of cellular heterogeneity, enabling the deconvolution of complex stem cell populations. However, the interpretation of scRNA-seq data is challenged by significant technical noise. The number of unique molecular identifiers (UMIs) detected per cell can vary substantially due to library size rather than biological state, complicating the identification of true cell-to-cell variation [35] [37].
The Seurat workflow traditionally involves sequential steps: NormalizeData() for log-normalization, FindVariableFeatures() to select genes with high cell-to-cell variation, and ScaleData() to adjust for mean expression and variance [7] [26]. The SCTransform method, introduced by Hafemeister and Satija (2019) and subsequently refined (v2), replaces this multi-step process with a single step based on a regularized negative binomial regression model [35] [36]. This protocol provides a detailed application note for employing SCTransform within a stem cell research context, ensuring researchers can effectively normalize data and identify highly variable features for downstream clustering and analysis.
Comparative Workflow: Conventional vs. SCTransform
The following diagram illustrates the key differences between the conventional Seurat pre-processing workflow and the streamlined SCTransform approach, highlighting the integration of multiple steps.
Materials and Reagents: The Computational Toolkit
Table 1: Essential Software Packages and Their Roles in the SCTransform Workflow
| Software/Package | Function | Installation Command |
|---|---|---|
| R (v4.2.2+) | Programming language and environment for statistical computing. | https://cran.r-project.org/ |
| Seurat (v5.0.0+) | Comprehensive R toolkit for single-cell genomics data analysis. | install.packages("Seurat") |
| sctransform (v0.3.3+) | Package performing normalization and variance stabilization based on a regularized negative binomial model. | install.packages("sctransform") |
| glmGamPoi | Bioconductor package that substantially speeds up the generalized linear model fitting in SCTransform. | BiocManager::install("glmGamPoi") |
| patchwork | R package for easily combining multiple ggplot2 plots. | install.packages("patchwork") |
Step-by-Step Protocol
Data Input and Initial Seurat Object Creation
Begin by loading the required libraries and reading the raw count matrix, typically the output from a pipeline like Cell Ranger. The data is used to create a Seurat object, the central container for all subsequent analysis [7] [26].
Quality Control and Calculation of Confounding Covariates
Low-quality cells and technical artifacts must be filtered out. A common QC metric is the percentage of reads mapping to the mitochondrial genome, indicative of cell stress or damage [7].
Executing SCTransform Normalization
This single command performs normalization, identifies highly variable features, and stabilizes variance. Crucially, it can also regress out unwanted sources of variation, such as mitochondrial percentage [35] [38] [36].
Key Parameters for SCTransform:
vars.to.regress: Variables to regress out (e.g.,"percent.mt", cell cycle scores).vst.flavor: Default is"v2", which includes improved parameter estimation and is the default in Seurat v5 [36].variable.features.n: Number of variable features to identify (default is 3000, compared to 2000 in the conventional workflow) [35] [38].
Downstream Dimensionality Reduction and Clustering
The output of SCTransform is stored in a new assay named SCT. This assay is automatically set as the default for downstream steps like PCA and UMAP [35].
Data Interpretation and Output
Location and Meaning of Normalized Values
Understanding where the results are stored is crucial for further analysis and visualization.
Table 2: Contents of the SCT Assay After Running SCTransform
| Slot Name | Content Description | Primary Use |
|---|---|---|
pbmc[["SCT"]]$counts |
"Corrected" UMI counts. Represents the UMI counts expected if all cells were sequenced at the same depth. | Used for certain differential expression tests. |
pbmc[["SCT"]]$data |
Log-normalized versions of the corrected counts. | Ideal for visualization (e.g., FeaturePlot, VlnPlot). |
pbmc[["SCT"]]$scale.data |
Pearson residuals. The variance-stabilized output of the model. | Used directly as input for PCA and dimensional reduction. |
By default, scale.data contains residuals only for the 3000 most variable genes to conserve memory (return.only.var.genes = TRUE) [35] [38].
Advantages for Stem Cell Research
The use of SCTransform offers specific benefits for analyzing complex stem cell populations:
- Sharper Biological Distinctions: The normalization more effectively removes technical variation, revealing subtler heterogeneity within stem cell populations, such as early lineage priming or transitional states [35].
- Robust Parameter Settings: Results are less sensitive to the number of principal components (PCs) or variable features used. This allows researchers to use more PCs (e.g., 1:30 or 1:50) with confidence that they capture biological rather than technical variation, potentially revealing rare stem cell subtypes [35].
- Improved Conserved Marker Identification: When integrating multiple stem cell samples or time points, using SCTransform as part of the integration workflow leads to better identification of cell type markers that are conserved across conditions [36].
Troubleshooting and Best Practices
- Speed and Memory: For large datasets (e.g., >50,000 cells), ensure the
glmGamPoipackage is installed, as it is used by default in Seurat v5 to speed up model fitting [35]. Theconserve.memoryparameter can be set toTRUEfor very large datasets. - Regression Variables: Use the
vars.to.regressparameter judiciously. While regressing outpercent.mtis generally recommended, regressing out too many variables or those strongly correlated with biology can remove signal of interest. - Comparison and Validation: It is good practice to compare clusters generated via the SCTransform workflow with those from the conventional log-normalization workflow, using known marker genes for your stem cell system to validate biologically plausible results.
In single-cell RNA sequencing (scRNA-seq) studies of stem cell populations, dimensionality reduction is an indispensable step for visualizing and interpreting high-dimensional transcriptomic data. Techniques such as Principal Component Analysis (PCA), batch correction tools like Harmony, and nonlinear projection methods such as UMAP and t-SNE enable researchers to discern complex cellular heterogeneity, identify novel stem cell subtypes, and visualize developmental trajectories. Within the context of stem cell research—such as the analysis of hematopoietic stem and progenitor cells (HSPCs)—these methods help in mapping the transcriptomic landscape of rare cell populations, understanding lineage commitment, and identifying progenitor states [2]. This protocol details the application of these dimensionality reduction techniques within the Seurat workflow, providing a structured framework for clustering and analyzing stem cell populations.
Quantitative Comparison of Dimensionality Reduction and Batch Correction Methods
The selection of an appropriate batch correction method is critical when integrating multiple scRNA-seq datasets, such as those derived from different experimental batches, donors, or sequencing technologies. A comprehensive benchmark study evaluated 14 batch-effect correction methods on ten datasets, assessing them based on computational runtime, ability to handle large datasets, and efficacy in correcting batch effects while preserving biological variation [39]. The performance was evaluated using multiple metrics, including kBET (which measures batch mixing on a local level), LISI (Local Inverse Simpson's Index), ASW (Average Silhouette Width), and ARI (Adjusted Rand Index) [39].
Table 1: Performance Benchmark of Selected Batch Correction Methods
| Method | Key Algorithmic Principle | Recommended Use Case | Performance Notes |
|---|---|---|---|
| Harmony | Iterative clustering in PCA space and dataset integration [39]. | First choice for general use due to speed and efficacy [39]. | Significantly shorter runtime; excellent batch mixing and cell type separation [39]. |
| Seurat 3 (CCA) | Canonical Correlation Analysis (CCA) and Mutual Nearest Neighbors (MNNs) as "anchors" [39]. | Integrating datasets with complex batch effects and shared cell types [39] [40]. | High accuracy in matching shared cell types across datasets [39]. |
| LIGER | Integrative Non-negative Matrix Factorization (NMF) [39]. | When batch differences may have a biological origin [39]. | Effectively separates batch-specific and shared factors [39]. |
| fastMNN | Mutual Nearest Neighbors in a PCA subspace [39] [40]. | Rapid integration of large datasets [39]. | Computationally efficient version of MNN [39]. |
| scVI | Deep generative model (variational autoencoder) [40]. | Integration of very complex or large-scale datasets [40]. | Requires specific Python environment setup [40]. |
Experimental Protocols for Dimensionality Reduction in Stem Cell Analysis
Sample Preparation and Single-Cell Sequencing of HSPCs
The following protocol, adapted from a study on human umbilical cord blood-derived HSPCs, outlines the critical wet-lab steps for generating high-quality single-cell data [2].
Cell Isolation and Staining:
- Isolate mononuclear cells (MNCs) from human umbilical cord blood (hUCB) using density gradient centrifugation with Ficoll-Paque [2].
- Stain the MNCs with a cocktail of fluorescently labeled antibodies. A typical panel for HSPC enrichment includes:
- Perform staining in the dark at 4°C for 30 minutes, followed by centrifugation and resuspension in RPMI-1640 medium with 2% FBS [2].
Fluorescence-Activated Cell Sorting (FACS):
Single-Cell Library Preparation and Sequencing:
- Process sorted cells immediately using a platform such as the 10X Genomics Chromium Controller and the Chromium Next GEM Single Cell 3' Kit v3.1 for library preparation [2].
- Pool libraries and sequence on an Illumina platform (e.g., NextSeq 1000/2000) aiming for a minimum of 25,000 reads per cell [2].
Computational Analysis: A Seurat Workflow for Dimensionality Reduction
This protocol details the computational steps for data preprocessing, dimensionality reduction, and batch correction using Seurat, which is central to analyzing stem cell populations [2] [41].
Data Preprocessing and Quality Control
- Raw Data Processing: Demultiplex sequencing data and generate a gene-cell count matrix using Cell Ranger (10x Genomics) or another alignment tool [2].
- Create Seurat Object: Initialize a Seurat object with the raw count matrix [41].
- Quality Control Filtering: Filter out low-quality cells and doublets based on:
- Number of unique genes detected per cell (
nFeature_RNA). Exclude cells with values below 200 or above 2,500 (or 2 standard deviations above the mean) [2] [41]. - Percentage of mitochondrial reads (
percent.mt). Filter out cells with >5-10% mitochondrial counts [2] [41]. High percentage indicates stressed or dying cells.
- Number of unique genes detected per cell (
Normalization, Scaling, and Linear Dimensionality Reduction with PCA
- Normalization: Normalize the raw counts using
NormalizeData()with the "LogNormalize" method (default), which scales by total expression and log-transforms the result [41]. - Feature Selection: Identify the top 2,000 highly variable genes (HVGs) using
FindVariableFeatures()[41]. These genes drive the downstream PCA. - Scaling: Scale the data using
ScaleData()to give equal weight to all HVGs in PCA by shifting the mean to 0 and scaling variance to 1 [41]. - PCA: Perform linear dimensionality reduction using
RunPCA()on the scaled data of HVGs [41]. PCA compresses the data into principal components (PCs) that capture the main axes of variation.
- Normalization: Normalize the raw counts using
Batch Effect Correction using Harmony
- Integration Setup: In Seurat v5, ensure your data is split by batch (
obj[["RNA"]] <- split(obj[["RNA"]], f = obj$Method)) [40]. - Run Harmony: Perform integration with a single line of code using the
IntegrateLayers()function andmethod = HarmonyIntegration[40]. This generates a new dimensional reduction (e.g.,"harmony").obj <- IntegrateLayers(object = obj, method = HarmonyIntegration, orig.reduction = "pca", new.reduction = "harmony", verbose = FALSE)[40].
- Integration Setup: In Seurat v5, ensure your data is split by batch (
Clustering and Nonlinear Visualization with UMAP/t-SNE
- Nearest Neighbor Graph: Construct a shared nearest neighbor graph based on the corrected Harmony dimensions (or PCA components if not correcting) using
FindNeighbors()(e.g.,dims = 1:30) [40] [41]. - Cluster Identification: Perform graph-based clustering with
FindClusters()at a chosen resolution (e.g.,resolution = 0.5for broader clusters) to identify distinct cell populations [2] [41]. - UMAP/t-SNE: Generate 2D visualizations with
RunUMAP()orRunTSNE()using the same dimensions as the neighborhood graph [40] [41]. These plots allow for visual assessment of cluster separation and batch integration.
- Nearest Neighbor Graph: Construct a shared nearest neighbor graph based on the corrected Harmony dimensions (or PCA components if not correcting) using
Figure 1: Seurat computational workflow for single-cell data analysis, encompassing quality control, normalization, dimensionality reduction, batch correction, clustering, and visualization.
The Scientist's Toolkit: Essential Research Reagents and Software
Successful execution of a stem cell scRNA-seq project requires both wet-lab reagents and computational tools.
Table 2: Key Research Reagent Solutions for HSPC scRNA-seq
| Item | Function / Application | Example |
|---|---|---|
| Ficoll-Paque | Density gradient medium for isolation of mononuclear cells from whole blood [2]. | GE Healthcare Ficoll-Paque [2] |
| Fluorochrome-Conjugated Antibodies | Cell surface marker staining for identification and isolation of specific HSPC populations via FACS [2]. | Anti-CD34 (PE), Anti-CD133 (APC), Anti-CD45 (PE-Cy7), Lineage Cocktail (FITC) [2] |
| Single-Cell Library Prep Kit | Generation of barcoded, sequencing-ready libraries from single-cell suspensions [2]. | 10X Genomics Chromium Next GEM Single Cell 3' Kit [2] |
| Seurat | Primary R toolkit for single-cell data analysis, including normalization, dimensionality reduction, and clustering [2] [40] [41]. | Seurat R package [41] |
| Harmony | R package for fast, effective integration of multiple single-cell datasets to remove batch effects [39] [40] [42]. | Harmony R package [39] |
| Cell Ranger | Primary software pipeline for processing raw sequencing data from 10X Genomics experiments into a gene-cell matrix [2] [42]. | 10X Genomics Cell Ranger [2] |
Workflow Logic and Decision Pathway
The following diagram outlines the key decision points in the dimensionality reduction and integration process, guiding researchers on the appropriate path based on their experimental design.
Figure 2: Decision pathway for selecting dimensionality reduction and batch correction strategies.
Graph-Based Clustering with Leiden Algorithm to Identify Cell Subpopulations
The accurate identification of cell subpopulations is a fundamental step in single-cell RNA sequencing (scRNA-seq) analysis, enabling researchers to characterize cellular heterogeneity and identify novel cell states. Within the Seurat workflow for stem cell research, graph-based clustering has emerged as a powerful unsupervised machine learning approach for partitioning cells into distinct groups based on transcriptional similarities. The Leiden algorithm has established itself as a method of choice for this purpose, outperforming other clustering methods for scRNA-seq data analysis and guaranteeing well-connected communities [43]. This algorithm operates on a k-nearest neighbour (KNN) graph constructed from cells embedded in a reduced-dimensional space, typically generated through principal component analysis (PCA). The KNN graph reflects the underlying topology of the expression data by representing dense regions in expression space as densely connected regions in the graph [43].
For stem cell research, where identifying subtle transitional states or rare subpopulations is critical, Leiden clustering offers significant advantages. Its ability to efficiently identify fine-grained clusters makes it particularly valuable for dissecting heterogeneous stem cell populations, such as hematopoietic stem and progenitor cells (HSPCs) [2]. The algorithm creates clusters by considering the number of links between cells in a cluster versus the overall expected number of links in the dataset, proceeding through a series of iterative steps: starting with a singleton partition, moving nodes between communities, refining partitions, and aggregating networks until the optimal cluster structure emerges [43]. This robust mathematical foundation ensures that identified clusters represent genuine biological entities rather than technical artifacts, a crucial consideration when working with precious stem cell samples.
Theoretical Foundation and Algorithm Mechanics
The Leiden Algorithm Workflow
The Leiden algorithm functions through a sophisticated multi-stage process that optimizes the partition of cells in a network. The algorithm begins with a singleton partition where each node serves as its own community [43]. It then iteratively refines this partition through two key phases: (1) local moving of nodes to optimize the partition quality, and (2) aggregation of the network based on the refined partition. This process repeats until no further improvements can be made, ensuring well-connected communities that accurately represent the underlying cellular structure [43]. The mathematical objective is typically to maximize a quality function such as modularity, which quantifies the difference between the actual number of edges within communities and the expected number under a null model.
A key advantage of Leiden over its predecessor (Louvain algorithm) is its guarantee of well-connected communities, addressing the issue of poorly connected clusters that could lead to misinterpretation of cell populations [43]. This property is particularly valuable in stem cell biology where continuous differentiation trajectories may be present. The algorithm's time complexity is nearly linear, making it computationally efficient even for large-scale datasets containing millions of cells [44]. This efficiency enables researchers to iteratively explore clustering parameters without prohibitive computational costs, an essential feature for comprehensive analysis of complex stem cell systems.
Integration with Single-Cell Data Structures
In the context of scRNA-seq analysis, the Leiden algorithm operates on a KNN graph constructed from reduced dimensions. The typical workflow involves first selecting highly variable genes, performing dimensionality reduction via PCA, and then constructing a KNN graph where cells represent nodes and edges connect transcriptionally similar cells [43]. The spatial information in spatially resolved omics can be integrated by creating an additional graph layer representing physical proximity between cells [44]. This multiplex approach allows simultaneous consideration of both transcriptional similarity and spatial organization, providing a more comprehensive view of cellular organization in tissue contexts.
For stem cell applications, the algorithm's sensitivity to local community structure enables identification of rare transitional states that might be missed by other methods. The resolution parameter directly controls the granularity of the clustering, with higher values yielding more fine-grained clusters [43]. This tunable parameter allows researchers to adapt the clustering to specific biological questions, from broad lineage classification to identification of subtle substates within progenitor populations. The implementation in tools such as Seurat and Scanpy makes Leiden clustering accessible to biologists while maintaining computational efficiency through optimized data structures and parallelization where possible.
Experimental Protocol and Implementation
Sample Preparation and Single-Cell Library Construction
The foundation of successful clustering begins with proper sample preparation and library construction. For hematopoietic stem and progenitor cell (HSPC) analysis, cells are typically isolated from sources such as human umbilical cord blood (hUCB) using fluorescence-activated cell sorting (FACS) with specific surface markers [2]. The standard protocol involves staining mononuclear cells with antibodies against CD34, CD133, CD45, and a lineage cocktail (Lin) containing markers for differentiated cell types, then sorting for CD34+Lin−CD45+ and CD133+Lin−CD45+ populations [2]. This enrichment strategy ensures that the subsequent sequencing captures the relevant stem and progenitor populations while reducing noise from mature cell types.
Following cell sorting, single-cell libraries are prepared using droplet-based technologies such as the Chromium system from 10X Genomics [2]. The recommended workflow uses the Chromium Next GEM Chip G Single Cell Kit and Single Cell 3' GEM, Library & Gel Bead Kit v3.1 according to manufacturer specifications. Libraries are sequenced on Illumina platforms (e.g., NextSeq 1000/2000) with a target of 25,000 reads per cell, using paired-end sequencing (28 bp for read 1, 90 bp for read 2) to ensure sufficient transcript coverage [2]. Quality control metrics should be assessed throughout, including cell viability, library concentration, and fragment size distribution to ensure technical robustness before proceeding to computational analysis.
Computational Implementation in Seurat
The implementation of Leiden clustering within the Seurat workflow follows a structured pipeline from raw data to final clusters. After sequencing, data is processed through Cell Ranger to generate count matrices, which are then imported into Seurat for quality control and analysis [2]. The critical steps include:
Quality Control and Filtering: Remove low-quality cells based on thresholds for unique feature counts (typically 200-2500 genes/cell) and mitochondrial percentage (usually <5-10%) [2]. This step eliminates damaged cells or empty droplets that could distort clustering.
Normalization and Feature Selection: Normalize data using log-normalization or SCTransform, and select highly variable genes (2000-3000 features) that drive population structure [43] [45]. For spatial transcriptomics, spatially variable genes (SVGs) may be used instead [44].
Dimensionality Reduction: Perform linear dimensionality reduction with PCA on the scaled data, selecting the top 20-30 principal components that capture the majority of biological variance [43].
Graph Construction and Clustering: Build a KNN graph using the reduced dimensions, then apply the Leiden algorithm to identify communities. The key parameters include:
n.neighbors: Number of neighbors for KNN graph (default: 20-30)n.pcs: Number of principal components (default: 30)resolution: Cluster granularity parameter (default: 0.5-1.2)algorithm: Set to "Leiden" for Leiden clustering
Table 1: Key Parameters for Leiden Clustering in Seurat
| Parameter | Recommended Range | Effect on Clustering | Biological Interpretation |
|---|---|---|---|
| Resolution | 0.2-2.0 | Higher values increase cluster number | Finer subdivision of cell states |
| n.neighbors | 15-50 | Higher values create smoother clusters | Broad vs. local population structure |
| n.pcs | 20-50 | More PCs capture more variance | Retention of biological signal |
| random.seed | Fixed value | Ensures reproducibility | Consistent results across runs |
The clustering results are typically visualized using UMAP, which provides a two-dimensional embedding that preserves topological relationships between clusters [43]. For stem cell populations, it is advisable to test multiple resolution parameters and compare the biological plausibility of resulting clusters using marker gene expression and known lineage relationships.
Parameter Optimization and Validation
Systematic Parameter Optimization
The performance of Leiden clustering is highly dependent on appropriate parameter selection, which should be optimized for each dataset and biological question. Recent research indicates that the use of UMAP for neighborhood graph generation and increased resolution parameters generally has a beneficial impact on accuracy [45]. The effect of resolution is particularly pronounced when using fewer nearest neighbors, which creates sparser and more locally sensitive graphs that better preserve fine-grained cellular relationships [45]. This combination is especially valuable for identifying rare stem cell subpopulations or transitional states that might be obscured in overly broad clustering.
A comprehensive optimization strategy should systematically vary key parameters including the number of principal components, nearest neighbors, and resolution values. The number of principal components is highly affected by data complexity and should be determined based on the elbow in the scree plot or JackStraw analysis [45]. For studies focusing on specific lineages, sub-clustering of initial populations can reveal substructure that is not apparent in whole-dataset clustering [43]. This iterative approach allows researchers to hierarchically dissect cellular heterogeneity, first identifying major lineages then resolving finer substates within populations of interest.
Table 2: Intrinsic Metrics for Cluster Quality Assessment
| Metric | Calculation | Interpretation | Optimal Value |
|---|---|---|---|
| Silhouette Width | Mean intra-cluster vs. inter-cluster distance | Cluster separation and cohesion | Higher values (closer to 1) |
| Calinski-Harabasz Index | Between-cluster dispersion / within-cluster dispersion | Cluster compactness and separation | Higher values |
| Banfield-Raftery Index | Log-likelihood of Gaussian mixture model | Within-cluster similarity | Lower values |
| Within-cluster Dispersion | Mean distance to cluster centroid | Cluster compactness | Lower values |
Validation and Biological Interpretation
Validating clustering results requires both computational metrics and biological knowledge. Intrinsic metrics such as the Banfield-Raftery index and within-cluster dispersion have been shown to effectively predict clustering accuracy and can serve as proxies for evaluating parameter configurations [45]. These metrics assess cluster compactness and separation without requiring ground truth labels, making them particularly valuable for discovering novel cell states in exploratory stem cell research.
Biological validation should include differential expression analysis to identify marker genes for each cluster and comparison to established lineage signatures. For hematopoietic stem cells, this might include expression of known markers such as CD34, PROM1 (CD133), and lineage-specific transcription factors [2]. Additionally, trajectory inference methods such as Slingshot can be used to reconstruct differentiation paths and validate whether clusters represent biologically plausible transitional states [46]. When ground truth labels are available from FACS sorting or well-annotated reference datasets, extrinsic metrics including Adjusted Rand Index (ARI) and Normalized Mutual Information (NMI) provide quantitative measures of clustering accuracy [44]. For stem cell applications specifically, functional validation of sorted populations based on cluster identities provides the most compelling evidence for biological relevance.
Advanced Applications and Extensions
Spatial Transcriptomics Integration
The Leiden algorithm can be extended to spatial transcriptomics through the SpatialLeiden approach, which incorporates spatial information at multiple processing stages [44]. This spatially aware clustering integrates spatial neighborhood relationships as an additional layer in a multiplex graph, alongside the traditional gene expression KNN graph. The spatial connectivity is typically defined using grid-based neighbors for capture-based technologies like Visium, or Delaunay triangulation/k-nearest neighbors for imaging-based platforms like MERFISH [44]. The weighted contribution of spatial versus expression information is controlled through a tuning parameter that should be optimized for each dataset and biological context.
For stem cell research in tissue contexts, such as studying hematopoietic stem cell niches or intestinal crypts, SpatialLeiden enables identification of spatially restricted subpopulations that might be transcriptionally similar but functionally distinct due to microenvironmental positioning. Performance evaluations demonstrate that SpatialLeiden significantly outperforms non-spatial Leiden implementations and achieves comparable results to specialized spatial clustering tools like SpaGCN and BayesSpace, but with substantially reduced computational time and resource requirements [44]. This makes it particularly suitable for large-scale spatial atlas projects aiming to comprehensively map stem cell populations across tissues and developmental stages.
Multi-omics and Integrated Analysis
The multiplex capabilities of Leiden clustering enable integration of diverse data modalities beyond gene expression and spatial information. This approach can incorporate protein expression data from CITE-seq, chromatin accessibility from simultaneous scATAC-seq, or metabolic states from additional assays [44]. Each modality is represented as a separate graph layer with appropriate weighting based on data quality and biological relevance. For stem cell research, this multi-omics integration is particularly powerful for resolving heterogeneous populations that may show concordant or discordant patterns across molecular layers.
Another advanced application is the use of compositional data analysis (CoDA) transformations as an alternative to conventional normalization methods. The centered-log-ratio (CLR) transformation has demonstrated advantages for dimensionality reduction visualization and clustering, particularly in providing more distinct and well-separated clusters [47]. This approach explicitly treats scRNA-seq data as compositional, addressing fundamental properties like scale invariance and sub-compositional coherence that are not handled by traditional methods. For stem cell applications where subtle expression changes can indicate lineage commitment decisions, CoDA transformations may improve sensitivity for detecting early transitional states.
Research Reagent Solutions
Table 3: Essential Research Reagents for Single-Cell Stem Cell Analysis
| Reagent/Category | Specific Examples | Function in Workflow |
|---|---|---|
| Cell Surface Markers | CD34, CD133, CD45, Lineage Cocktail | Isolation of specific stem/progenitor populations by FACS |
| Single-Cell Library Prep | 10X Genomics Chromium Next GEM Kits | Generation of barcoded single-cell libraries for sequencing |
| Sequencing Reagents | Illumina NextSeq 1000/2000 P2 Reagents | High-throughput sequencing of single-cell libraries |
| Analysis Software | Seurat, Scanpy, Cell Ranger | Computational processing and clustering of single-cell data |
| Reference Datasets | CellTypist Organ Atlas, Human Embryo Reference | Benchmarking and annotation of clustered populations |
Workflow Diagrams
Single-Cell Clustering with Leiden Algorithm
SpatialLeiden for Stem Cell Niches
Differential Expression Analysis with FindAllMarkers to Define Cluster Identity
Defining cell cluster identities represents a critical step in single-cell RNA sequencing (scRNA-seq) analysis, particularly in stem cell research where heterogeneous populations exhibit complex differentiation hierarchies. The FindAllMarkers function within the Seurat package provides a systematic approach for identifying differentially expressed genes (DEGs) across clustered cell populations, enabling researchers to assign biological meaning to computational groupings [48]. This methodology allows for the discovery of marker genes that distinguish one cluster from all others, forming the foundation for cell type annotation and functional characterization.
In stem cell biology, accurately defining cluster identities is essential for understanding differentiation trajectories, identifying progenitor subpopulations, and characterizing rare stem cell subtypes. When applied to hematopoietic stem cells [49] [50], mesenchymal stem cells, or other stem cell systems, this approach can reveal molecular signatures underlying self-renewal capacity and lineage commitment. The protocol outlined below details the implementation of FindAllMarkers within the broader Seurat workflow for clustering and analyzing stem cell populations.
Theoretical Foundations
Statistical Principles of Marker Detection
The FindAllMarkers function performs differential expression testing between each cluster and all remaining cells, identifying genes that exhibit statistically significant expression differences [48]. By default, Seurat employs the Wilcoxon rank sum test, a non-parametric method that compares the expression distribution of each gene between two cell groups without assuming normal distribution of data [51] [52]. This test is particularly suitable for scRNA-seq data, which often exhibits complex distribution properties with excess zeros and technical noise.
The statistical testing framework evaluates the null hypothesis that gene expression values between the cluster of interest and all other cells come from the same distribution. Genes with significantly low p-values after multiple testing correction reject this null hypothesis, suggesting they may serve as potential markers for the cluster [53]. The effect size is quantified through average log fold change (avg_log2FC), which measures the magnitude of expression difference between groups.
Interpretation of Output Metrics
The FindAllMarkers output provides several key metrics for evaluating potential marker genes, each offering distinct biological and statistical insights [51] [52] [48]:
- p_val: The raw p-value from the statistical test without multiple testing correction
- avg_log2FC: The average log2 fold-change of expression in the target cluster compared to other cells
- pct.1: The percentage of cells in the target cluster where the gene is detected
- pct.2: The percentage of cells in all other clusters where the gene is detected
- pvaladj: The Bonferroni-adjusted p-value using all features in the dataset
Table 1: Key Output Metrics from FindAllMarkers and Their Interpretation
| Metric | Interpretation | Recommended Threshold |
|---|---|---|
| avg_log2FC | Magnitude of expression difference | > 0.25-0.58 (1.2-1.5 fold change) |
| pvaladj | Statistical significance after multiple testing correction | < 0.05 |
| pct.1 | Specificity of marker expression | > 0.25 |
| pct.1 - pct.2 | Detection rate difference | > 0.25 |
Experimental Protocol
Pre-Analysis Requirements
Before executing differential expression analysis, several prerequisite steps must be completed within the Seurat workflow:
Cluster Identification:
- Perform quality control, normalization, and scaling of raw count data [7]
- Execute principal component analysis and determine statistically significant dimensions
- Construct a shared nearest neighbor graph and cluster cells using algorithms such as Louvain or Leiden
- Visualize clusters using UMAP or t-SNE embeddings
Identity Assignment:
- Set the active identity of the Seurat object to the cluster assignments using
Idents(object) <- "seurat_clusters"
FindAllMarkers Execution
The core differential expression analysis can be implemented with the following code:
Table 2: Key Parameters for FindAllMarkers Function
| Parameter | Default Value | Recommended Setting | Purpose |
|---|---|---|---|
| min.pct | 0.1 | 0.25 | Only test genes detected in minimum fraction of cells |
| logfc.threshold | 0.1 | 0.25 | Limit testing to genes with minimum fold change |
| test.use | "wilcox" | "wilcox" | Statistical test for differential expression |
| only.pos | FALSE | TRUE | Only return positive markers |
| min.diff.pct | -Inf | 0.25 | Only test genes with minimum detection percentage difference |
Parameter Optimization Strategies
Selecting appropriate parameters requires balancing sensitivity and specificity:
- min.pct: Setting this too high may miss biologically relevant markers expressed in smaller cell subpopulations within a cluster
- logfc.threshold: Increasing this value (e.g., to 0.58 for 1.5-fold change) improves marker stringency but may exclude subtle but consistent expression differences
- min.diff.pct: This parameter ensures markers have different detection rates between clusters, enhancing biological relevance [54]
For stem cell populations with subtle transcriptional differences, consider less stringent thresholds initially, followed by manual curation of candidate markers.
Data Interpretation and Validation
Marker Evaluation and Selection
Following differential expression analysis, candidate markers require careful evaluation:
Specificity Assessment:
- Examine expression patterns across all clusters, not just the cluster of interest
- Prioritize markers with high pct.1 and low pct.2 values
- Consider combinatorial marker sets that uniquely define clusters
Biological Plausibility:
- Verify markers align with established biological knowledge of stem cell populations
- Consult databases of cell-type-specific genes for relevant tissues
- Evaluate whether markers fit known differentiation hierarchies
Visual Validation:
Cluster Annotation Strategy
Assign biological identities to clusters through iterative evaluation:
- Compile candidate markers for each cluster from FindAllMarkers output
- Identify top markers based on statistical significance and effect size
- Research known functions of candidate markers in relevant stem cell systems
- Compare with published datasets of purified cell populations when available
- Validate annotations using orthogonal methods such as immunofluorescence or flow cytometry
For the hematopoietic stem cell example cited in the search results, this approach identified IRF4 and ELANE as key differentially expressed genes in CD34+ hematopoietic stem cells from patients with myelodysplastic syndromes [49] [50].
Advanced Applications in Stem Cell Research
Resolving Stem Cell Heterogeneity
FindAllMarkers can reveal subtle heterogeneity within putative stem cell populations:
- Identify subpopulations with distinct functional properties (e.g., quiescent vs. activated stem cells)
- Discover novel progenitor states along differentiation trajectories
- Characterize rare stem cell subtypes that may have distinct regenerative capacities
Cross-Condition Comparisons
When analyzing stem cells across different experimental conditions:
- Maintain consistent clustering across all conditions for comparable marker detection
- Identify condition-specific markers that may indicate functional state changes
- Use conserved markers for core cell identity despite condition variations
Pseudobulk Validation
For enhanced statistical rigor, particularly when comparing across conditions, consider pseudobulk approaches [51] [55]:
- Aggregate cells by sample origin and cluster identity using
AggregateExpression() - Perform differential expression on pseudobulk profiles using methods like DESeq2 or limma
- Compare results with standard FindAllMarkers output to identify robust markers
The Scientist's Toolkit
Table 3: Essential Research Reagent Solutions for scRNA-seq Cluster Validation
| Reagent/Category | Specific Examples | Function in Workflow |
|---|---|---|
| Cell Surface Antibodies | CD34, CD45, CD133, lineage-specific antibodies | Flow cytometry validation of cluster identities |
| RNA Probes | RNAscope probes for top marker genes | Spatial validation of marker expression in tissue context |
| CRISPR Screening Tools | sgRNAs targeting marker gene functions | Functional validation of marker genes in stem cell populations |
| Bulk RNA-seq Reference | Pure cell type transcriptomes from public databases | Orthogonal validation of cluster annotations |
| Cell Sorting Reagents | Fluorescent-activated cell sorting antibodies | Isolation of clusters for functional assays |
Workflow Visualization
Figure 1: Comprehensive workflow for cluster identity definition using FindAllMarkers, showing the progression from data preprocessing through differential expression analysis to biological annotation and validation.
Figure 2: Detailed computational workflow of the FindAllMarkers function, illustrating input requirements, internal processing steps, and output generation for cluster marker identification.
Annotating Clusters using Stem Cell-Specific Marker Genes (e.g., MKI67, STMN1)
Within the framework of a broader thesis on Seurat workflows for clustering and analyzing stem cell populations, the accurate annotation of cell clusters represents a critical step for meaningful biological interpretation. Unsupervised clustering, followed by manual annotation using known marker genes, is a cornerstone of single-cell RNA sequencing (scRNA-seq) analysis [56] [7]. However, this process is particularly challenging for stem cell populations, which are often characterized by transient states and complex heterogeneity.
This application note details a refined protocol for the identification and annotation of stem cell clusters using specific marker genes such as MKI67 and STMN1, placed within the standardized Seurat workflow. MKI67 is a classic marker of cell proliferation, while STMN1 is a key microtubule-regulating protein that plays a crucial role in maintaining cancer stem cell properties [57] [58]. Their expression is strongly associated with tumor aggressiveness and patient prognosis, making them invaluable for discerning stem-like subpopulations within complex datasets, such as those from lung adenocarcinoma (LUAD) [57] [59]. The following sections provide a detailed methodology, from data pre-processing to functional validation, equipping researchers with a robust tool for stem cell research and therapeutic development.
Key Marker Genes and Biological Rationale
A targeted selection of marker genes is essential for the precise identification of stem cell populations. The table below summarizes key genes, their primary functions, and their utility in cluster annotation.
Table 1: Key Stem Cell Marker Genes for scRNA-seq Cluster Annotation
| Gene Symbol | Full Name | Key Function | Role in Cluster Annotation |
|---|---|---|---|
| MKI67 | Marker Of Proliferation Ki-67 | Nuclear protein associated with cell proliferation [57] | Identifies actively cycling stem and progenitor cells. |
| STMN1 | Stathmin 1 | Cytosolic phosphoprotein regulating microtubule dynamics [58] [59] | Marks primitive stem cells; high expression linked to "cold" tumor phenotypes and therapy resistance [57] [59]. |
| PROM1 | Prominin 1 (CD133) | Cell surface glycoprotein [2] | Cell surface antigen used to isolate and enrich for primitive hematopoietic stem/progenitor cells (HSPCs) [2]. |
| CD34 | CD34 Molecule | Cell surface glycoprotein [2] | Classical surface marker for enriching hematopoietic stem/progenitor cells (HSPCs) [2]. |
The biological rationale for selecting these markers is strong. For instance, research has demonstrated that tumors with high expression of stemness-related genes like MKI67 and STMN1 exhibit characteristics of immunologically "cold" tumors, with significantly reduced CD8+ T cell infiltration and inferior outcomes following treatment with immune checkpoint inhibitors [57] [58]. This makes their identification not only a biological classification exercise but also one with direct prognostic and therapeutic implications.
Integrated Experimental Workflow
The following diagram illustrates the comprehensive workflow for annotating stem cell clusters, integrating both wet-lab and computational steps.
Detailed Protocol for scRNA-seq Data Analysis
Cell Sorting and Library Preparation
Prior to computational analysis, careful wet-lab preparation is crucial.
- Cell Sorting: To isolate pure stem cell populations, such as Hematopoietic Stem/Progenitor Cells (HSPCs), from human umbilical cord blood (hUCB), sort cells using fluorescence-activated cell sorting (FACS). Use a cocktail of antibodies for positive and negative selection. A standard strategy involves gating for small, lymphocyte-like events (2–15 μm) that are negative for a panel of lineage differentiation markers (Lin-: CD235a, CD2, CD3, CD14, CD16, CD19, CD24, CD56, CD66b) and positive for CD45 and either CD34 or CD133 (PROM1) [2].
- Library Preparation: Proceed immediately with sorted cells to generate barcoded scRNA-seq libraries using a platform such as the Chromium X Controller from 10X Genomics and the Chromium Next GEM Single Cell 3' Kit v3.1, following the manufacturer's guidelines [2]. Sequence the pooled libraries on an Illumina platform aiming for a minimum of 25,000 reads per cell.
Computational Analysis with Seurat
The following protocol uses the Seurat R package (v5.0.1+), the industry standard for scRNA-seq analysis [7] [2].
Data Pre-processing and Quality Control
Begin by setting up the Seurat object and performing rigorous quality control.
Code Snippet 1: Initializing the Seurat object and performing quality control. Cells with too few/many features or high mitochondrial content are filtered out [7] [2].
Normalization, Scaling, and Feature Selection
Normalize the data and identify genes that exhibit high cell-to-cell variation.
Code Snippet 2: Normalization and feature selection. The LogNormalize method and scaling are standard pre-processing steps. The 'vst' method identifies 2000 highly variable genes for downstream analysis [7].
Linear Dimension Reduction and Clustering
Perform linear dimension reduction and cluster the cells based on their gene expression profiles.
Code Snippet 3: Dimension reduction and clustering. Principal Component Analysis (PCA) is performed, followed by graph-based clustering and UMAP for visualization [7] [58].
Cluster Annotation via Marker Gene Identification
This is the critical step for translating clusters into biologically meaningful cell types.
Finding Marker Genes
Use Seurat's function to find genes that are differentially expressed in each cluster compared to all others.
Code Snippet 4: Identifying and visualizing marker genes. The FindAllMarkers function performs a Wilcoxon rank sum test, which is effective for differential expression analysis [7] [60].
Annotation and Evaluation
Leverage the identified markers to annotate clusters. A cluster co-expressing MKI67 and STMN1 at high levels can be confidently annotated as a proliferative, stem-like population [57] [58]. It is vital to use a systematic approach for annotation. Tools like cellMarkerPipe can automate the identification and, crucially, the benchmarking of different marker gene selection methods, providing metrics like Adjusted Rand Index (ARI) and precision to guide the best choice for your dataset [60]. Studies suggest that methods like SCMarker and COSG often show reliable performance in selecting specific marker genes [60].
Advanced Methods and Validation
Addressing Limitations of Unsupervised Clustering
A significant caveat in standard workflows is that unsupervised clustering is not always driven by canonical phenotypic markers. A large-scale study on T-cells found that clusters were often driven by factors like cellular metabolism, T-cell receptor transcripts, and technical artifacts, leading to a mix of CD4+ and CD8+ T cells within the same cluster [56]. This underscores the risk of misannotation.
To enhance reliability, consider these advanced strategies:
- Semi-supervised Methods: Use tools like Festem or RFCell that directly select robust cell-type marker genes, improving downstream clustering [61] [62].
- Multi-Omics Integration: Whenever possible, incorporate data from CITE-seq (cellular indexing of transcriptomes and epitopes by sequencing) or T-cell receptor sequencing (TCR-seq) to validate annotations at the protein level or to trace clonality [56].
- Unified Ecosystems: Utilize integrated packages like SeuratExtend, which streamlines analysis by incorporating functional enrichment, trajectory inference, and access to Python-based tools like SCENIC within the familiar Seurat framework [63].
Functional and Prognostic Validation
For translational research, linking cluster annotations to clinical outcomes is paramount.
- Build a Prognostic Model: As demonstrated in LUAD research, key marker genes identified from scRNA-seq can be used to construct a Stem Cell Prognostic Model (SCPM) using machine learning algorithms (e.g., CoxBoost+Enet). This model can stratify patients into high- and low-risk groups across multiple independent cohorts [57] [58].
- Correlate with Immune Infiltration: Validate the biological relevance of your annotated stem cell clusters by assessing their correlation with immune cell infiltration. For example, confirm that clusters with high MKI67+/STMN1+ expression show reduced CD8+ T cell infiltration, characteristic of a "cold" immune phenotype, using computational methods like ssGSEA or experimental validation via multiplex immunohistochemistry on a separate patient cohort [57] [58].
The following diagram outlines the key steps for validating annotated clusters.
The Scientist's Toolkit
Table 2: Essential Research Reagent Solutions for Stem Cell scRNA-seq
| Category | Item | Function/Application |
|---|---|---|
| Wet-Lab Reagents | Ficoll-Paque | Density gradient medium for isolation of mononuclear cells from blood or hUCB [2]. |
| Antibody Cocktail (Lin, CD45, CD34, CD133) | Fluorescently-labeled antibodies for FACS sorting of pure HSPC populations [2]. | |
| Chromium Next GEM Single Cell 3' Kit (10X Genomics) | Reagent kit for generating barcoded scRNA-seq libraries [2]. | |
| Software & Databases | Seurat R Package | Primary software environment for the computational analysis of scRNA-seq data [7]. |
| CellMarkerPipe | Automated pipeline for marker gene identification and benchmarking against databases like CellMarker and PanglaoDB [60]. | |
| SeuratExtend | Integrated R package enhancing Seurat with trajectory inference, gene regulatory networks, and advanced visualization [63]. | |
| Reference Databases | PanglaoDB / CellMarker | Curated databases of cell type-specific marker genes for annotation [63] [60]. |
| The Cancer Genome Atlas (TCGA) | Repository for bulk RNA-seq and clinical data to validate prognostic models [57] [58]. |
Solving Common Challenges and Enhancing Clustering Resolution in Stem Cell Data
Addressing the Limitations of Unsupervised Clustering for Fine-Scale Separation
In the context of stem cell population research, single-cell RNA sequencing (scRNA-seq) has become an indispensable tool for dissecting cellular heterogeneity. A critical step in this analysis is unsupervised clustering, which aims to group cells based on the similarity of their transcriptomes without prior knowledge of cell identities. The Seurat workflow is widely adopted for this purpose, providing a structured pipeline from quality control to cluster identification [7]. However, a significant and often overlooked challenge is the tendency of these methods to over-cluster data, creating biologically meaningless partitions that can misdirect downstream analyses and biological interpretation [64]. This is particularly problematic in stem cell studies, where accurately identifying transitional states or fine-scale subpopulations is crucial for understanding differentiation dynamics and functional potential.
Evidence indicates that the underlying assumption that clustering results directly reflect T-cell biology does not always hold true; for instance, a large-scale analysis of T-cells found that standard unsupervised clustering failed to cleanly separate CD4+ and CD8+ T cells, with clusters instead being driven by factors like cellular metabolism and TCR transcripts rather than canonical lineage markers [56]. This demonstrates that without proper safeguards, clustering can produce scientifically misleading results. This Application Note details the limitations of standard unsupervised clustering within the Seurat framework and provides validated protocols to mitigate over-clustering, enhance reproducibility, and achieve more biologically accurate fine-scale separation of stem cell populations.
The Over-Clustering Problem: Diagnosis and Impact
Conceptual and Technical Origins
Over-clustering in scRNA-seq data arises from a combination of technical artifacts and algorithmic sensitivities. Key contributing factors include:
- Technical Noise and Data Sparsity: scRNA-seq data is characterized by high dimensionality and significant sparsity, with a high proportion of zero counts. These zeros can represent genuine absence of expression, low-level expression below detection limits, or technical dropouts [65]. Clustering algorithms can mistake this technical variation for meaningful biological heterogeneity.
- Algorithmic Sensitivity and Parameter Choices: Most clustering methods, including those in the standard Seurat workflow, are sensitive to user-defined parameters such as resolution. Higher resolution values push the algorithm to find more, smaller clusters, which may not correspond to true biological entities [7].
- Data Reuse ("Double Dipping"): A fundamental statistical issue arises when the same dataset is used both to define clusters and to test for differential expression between those clusters. This circular analysis inflates the apparent significance of marker genes and creates a false sense of validation for over-segmented clusters [64].
Biological Consequences in Stem Cell Research
In stem cell research, over-clustering can have significant detrimental effects on biological interpretation:
- Misidentification of Cell States: Artificially split clusters may be misinterpreted as distinct progenitor states or lineage-committed subpopulations.
- Erosion of Rare Populations: Genuine rare cell types can be statistically obscured when data is partitioned into an excessive number of small clusters.
- Compromised Downstream Analyses: Over-clustering directly impacts the validity of differential expression tests, trajectory inference, and cell-type annotation, potentially leading to incorrect biological conclusions and wasted experimental resources.
Table 1: Common Indicators of Over-Clustering in Stem Cell Datasets
| Indicator | Description | Biological Implication |
|---|---|---|
| High Intra-cluster Correlation | Clusters show high correlation in gene expression profiles with each other. | Potential splitting of a homogeneous population. |
| Lack of Robust Markers | No significant differentially expressed genes between neighboring clusters. | Clusters lack distinct transcriptional identities. |
| Unstable Cluster Assignments | Major changes in cluster composition with slight parameter adjustments. | Clusters are not robust and may be technically driven. |
| Enrichment for Technical Genes | Clusters are distinguished by mitochondrial, cell cycle, or stress response genes. | Separation reflects technical/state variation rather than lineage. |
Solution Strategies and Comparative Analysis
Ensemble Clustering for Robustness
Ensemble methods address the limitations of single-algorithm approaches by integrating multiple clustering results to produce a more stable and accurate consensus.
- The scEVE Algorithm: scEVE is an ensemble algorithm that takes a novel approach by describing the differences between clustering results rather than minimizing them. It applies multiple clustering methods to generate "base clusters," computes an original pairwise similarity metric, and then identifies "robust clusters"—groups of cells consistently co-assigned across methods. A key advantage is its ability to quantify cluster robustness and operate at multiple resolutions, effectively tackling the challenge of over-clustering [66].
- The scMSCF Framework: The single-cell Multi-Scale Clustering Framework (scMSCF) combines multi-dimensional PCA, K-means, and a weighted ensemble meta-clustering approach. It uses a voting mechanism to select high-confidence cells from initial clustering results, which then train a Transformer model to capture complex dependencies in the data for final classification [67].
Statistical Calibration with Artificial Variables
The "recall" method provides a statistically rigorous safeguard against over-clustering by controlling for the "double dipping" problem. It works by:
- Creating Artificial Variables: Generating fake genes that are known to be non-informative.
- Clustering with Augmented Data: Running the clustering algorithm on the real data augmented with these artificial variables.
- Calibrating Cluster Number: Determining the number of clusters for which the real genes are more informative than the artificial ones for distinguishing clusters.
This approach is algorithm-agnostic and can be rapidly applied even to large-scale studies on standard hardware, providing a practical tool for validating cluster robustness [64].
Alternative Paradigms: Semi-Supervised and Reference-Based Approaches
When canonical markers or reference data are available, moving away from purely unsupervised clustering can yield more accurate results.
- Semi-Supervised Learning: These methods leverage a small amount of labeled data (e.g., known marker genes for key lineages) to guide the model training, enhancing performance in scenarios with insufficient annotations and preventing over-segmentation by focusing on biologically relevant features [67].
- Protein-Aided Annotation: For immune cells like T cells, where standard transcriptomic clustering struggles to separate CD4+ and CD8+ lineages, integrating protein data (e.g., from CITE-seq) or TCR sequencing information provides an external anchor for accurate annotation, circumventing the pitfalls of purely unsupervised clustering [56].
Table 2: Comparison of Strategies to Mitigate Over-Clustering
| Strategy | Underlying Principle | Key Advantage | Implementation Consideration |
|---|---|---|---|
| Ensemble (e.g., scEVE) [66] | Aggregates results from multiple clustering methods. | Reduces bias from any single method; provides robustness metrics. | Computationally more intensive than single methods. |
| Statistical Calibration (e.g., recall) [64] | Uses artificial variables to control for false discoveries. | Provides statistical rigor against "double dipping"; model-agnostic. | Adds a step to the standard workflow. |
| Semi-Supervised [67] | Incorporates limited prior knowledge to guide clustering. | Improves biological relevance where partial knowledge exists. | Requires pre-definition of marker genes or labels. |
| Multi-Omic Integration [56] | Uses independent data modalities (e.g., protein) for annotation. | Delivers biologically accurate cell type classification. | Dependent on availability of multi-modal data. |
Experimental Protocols
Protocol 1: Implementing Ensemble Clustering with scEVE
This protocol describes the steps to run the scEVE algorithm for identifying robust cell clusters in a stem cell dataset [66].
Research Reagent Solutions
- R Environment: Ensure R (v4.0 or higher) is installed.
- scEVE Package: Obtain and install the scEVE algorithm as per developers' instructions.
- Input Data: A single-cell count matrix (e.g., from Cell Ranger) for your stem cell population.
Methodology
- Data Input and Preprocessing:
- Load the raw count matrix into R.
- Select 1000-2000 highly variable genes using the
FindVariableFeatures()function from Seurat to reduce noise and computational load [66].
- Generation of Base Clusters:
- Execute the four default clustering methods integrated within scEVE (
monocle3,Seurat,densityCut, andSHARP) on the preprocessed data. Ensure that the input fordensityCutis transformed to log2(TPM) using thecalculateTPM()function from thescaterlibrary [66]. - Note: scEVE will automatically skip clustering for any cell pool with fewer than 100 cells.
- Execute the four default clustering methods integrated within scEVE (
- Calculation of Pairwise Similarity:
- The algorithm computes the similarity
Sx,ybetween every pair of base clustersxandyusing the formula:Sx,y = min( (Nx∩y / Nx), (Nx∩y / Ny) ), whereNxis the number of cells in clusterxandNx∩yis the number of cells shared byxandy[66]. - A strong pairwise similarity is identified if
Sx,yexceeds the threshold of 0.5.
- The algorithm computes the similarity
- Identification of Robust Clusters and Filtering:
- scEVE leverages the strong pairwise similarities to identify groups of cells consistently clustered together, designating them as "robust clusters."
- The algorithm applies a final filter based on marker genes to ensure the distinctness of the resulting robust clusters for downstream biological analysis.
Diagram 1: scEVE ensemble clustering workflow for robust cluster identification.
Protocol 2: Statistical Validation of Clusters using RECALL
This protocol uses the RECALL method to statistically determine the appropriate number of clusters and guard against over-clustering [64].
Methodology
- Cluster with Artificial Features:
- Generate a set of artificial variables (e.g., random noise) with the same dimensions as a portion of the real gene expression matrix.
- Append these artificial variables to the real gene expression matrix.
- Run your chosen clustering algorithm (e.g., Seurat's
FindClustersat multiple resolutions) on this augmented dataset.
- Differential Expression Testing:
- For each candidate clustering result, perform differential expression analysis between all pairs of clusters.
- Run this analysis separately for the real genes and the artificial variables.
- Compare Significance Scores:
- Compare the strength of the differential expression evidence (e.g., p-values) for the real genes versus the artificial variables.
- Select the Calibrated K:
- The optimal number of clusters is the largest value
Kfor which the real genes are significantly more informative in distinguishing clusters than the artificial variables. This represents the point before the algorithm begins to partition the data based on noise.
- The optimal number of clusters is the largest value
Diagram 2: RECALL workflow for statistically calibrated clustering.
Protocol 3: Integrated Wet-Lab and Computational Validation
For definitive cluster annotation, especially in the context of stem cell populations, computational clustering must be followed by experimental validation.
Methodology
- Computational Cluster Definition:
- Perform clustering using a refined method (e.g., from Protocol 1 or 2) on the entire stem cell dataset.
- Identify putative marker genes for each cluster of interest.
- Wet-Lab Validation via FACS or PCR:
- Fluorescence-Activated Cell Sorting (FACS): If surface protein markers corresponding to the computationally identified marker genes are known, use antibody staining and FACS to physically isolate the putative subpopulations.
- Quantitative PCR (qPCR): For clusters defined by intracellular or non-coding transcripts, isolate pools of cells computationally assigned to different clusters and perform RNA extraction followed by qPCR for the top marker genes.
- Functional Assays:
- Subject the isolated subpopulations (from FACS) to functional stem cell assays, such as clonogenic assays (to assess self-renewal potential) or directed differentiation (to assess lineage potential).
- Multi-Modal Cross-Validation:
Diagram 3: Integrated computational and experimental validation workflow.
Unsupervised clustering is a powerful but imperfect tool. In stem cell research, where the accurate delineation of closely related cell states is paramount, a naive reliance on standard clustering workflows can lead to over-clustering and biologically misleading results. The strategies outlined here—employing ensemble methods like scEVE for robustness, utilizing statistical calibration with RECALL to prevent double-dipping, and mandating experimental validation—provide a robust framework to overcome these limitations. By adopting these refined protocols, researchers can enhance the reliability of their single-cell analyses, leading to more accurate identification of stem cell subpopulations and a deeper, more truthful understanding of cellular heterogeneity and lineage dynamics.
Optimizing Clustering Resolution Parameters to Avoid Over- or Under-Clustering
In single-cell RNA sequencing (scRNA-seq) analysis, clustering cells into distinct populations is fundamental for identifying cell types and states, particularly in stem cell research where uncovering novel subtypes can drive significant discoveries. The resolution parameter in graph-based clustering algorithms directly controls the granularity of these clusters; setting it too low leads to under-clustering, where biologically distinct populations are merged, while setting it too high causes over-clustering, where a single population is artificially split into multiple groups [69] [70]. Research indicates that widely used algorithms can be prone to over-clustering, partitioning data even when only random variation is present, which can lead to false discoveries of novel cell types if not statistically evaluated [69]. This application note provides a detailed, experimentally validated protocol for optimizing clustering parameters within the Seurat workflow, framed specifically for stem cell population analysis. We integrate traditional heuristic methods with advanced, robustness-based frameworks to guide researchers in achieving biologically accurate clustering.
Key Concepts and Definitions
- Clustering Resolution: A key tuning parameter in graph-based clustering algorithms (e.g., Leiden, Louvain) that determines the number of clusters. Higher values yield more clusters, and lower values yield fewer [71] [70].
- Under-clustering: Occurs when the resolution is too low, resulting in broad clusters that mask true biological heterogeneity (e.g., merging distinct stem cell progenitor states) [70].
- Over-clustering: Occurs when the resolution is too high, resulting in the splitting of a homogeneous cell population into multiple, non-biological subgroups based on technical noise or uninteresting variation [69] [70]. In severe cases, this can lead to "shattered" clusters that cannot be coherently re-merged [70].
- Cluster Robustness: A measure of how stable a cluster is across repeated iterations of clustering, often assessed through subsampling or varying random seeds. Robust clusters are more likely to represent true biological entities [14] [70].
Quantitative Benchmarking of Clustering Parameters
The table below summarizes the quantitative benchmarks and recommendations for key clustering parameters as identified from the literature. These values serve as a starting point for optimization in stem cell datasets.
Table 1: Benchmarking and Recommendations for Key Clustering Parameters
| Parameter | Recommended Starting Range | Impact on Clustering | Quantitative Benchmark / Finding |
|---|---|---|---|
| Resolution | 0.4 - 1.4 (for 3,000-5,000 cells) [71] | Controls the number of clusters; higher value = more clusters. | A chooseR analysis on ~11,000 PBMCs identified a resolution of 2.0 as optimal [70]. |
| Number of PCs | Varies; identify an objective cutoff [71] | Defines the feature space for distance calculations and clustering. | The JackStraw and Elbow plots are commonly used, but SCTransform may lessen the critical nature of this choice [41] [71]. |
Number of k.nearest Neighbors |
Default is often 20; test reduced numbers [45] | Influences graph structure; lower values create sparser graphs. | Research indicates reduced nearest neighbors, combined with UMAP for graph generation, can improve accuracy by preserving fine-grained relationships [45]. |
| Cluster Robustness (Silhouette Score) | > 0.5 indicates reasonable structure [70] | Measures how similar a cell is to its own cluster compared to other clusters. | In a chooseR framework, per-cluster silhouette scores help identify poorly resolved clusters for further analysis [70]. |
Experimental Protocols for Parameter Optimization
Protocol 1: Heuristic Workflow for Initial Parameter Estimation
This protocol uses built-in Seurat functions for a first-pass assessment of key parameters, particularly the number of Principal Components (PCs) and clustering resolution.
1. Determine Significant Principal Components (PCs):
- Run PCA on the scaled data (e.g.,
RunPCA()). - Visualize PC Elbow Plot: Use
ElbowPlot()to rank PCs based on the percentage of variance explained. The point where the curve shows an "elbow" (a sharp bend) indicates a potential cutoff for significant PCs [41] [71]. - Inspect PC Heatmaps: Use
DimHeatmap()to visualize the genes driving the top PCs. The PC where the heatmap starts to appear "fuzzy" (less distinct) may indicate a point of diminishing returns [71]. - Experimental Consideration for Stem Cells: Given the continuous nature of stem cell differentiation, more PCs may be required to capture subtle transitions. Starting with the elbow estimate + 5-10 PCs is often a safe strategy.
2. Explore a Range of Resolution Parameters:
- Calculate Clustering at Multiple Resolutions: Use the
FindClusters()function with a vector of resolution values (e.g.,resolution = c(0.2, 0.4, 0.6, 0.8, 1.0, 1.2, 1.4)) [71]. - Visualize with Dimensionality Reduction: Generate UMAP or t-SNE plots for each resolution value using
DimPlot(). - Analyze Cluster Splitting: Use tools like
Clustreeto visualize how clusters evolve and split across increasing resolutions, helping to identify stable populations and potential over-splitting [70].
Protocol 2: Robustness-Based Optimization with chooseR
For a statistically rigorous, data-driven parameter selection, the chooseR framework uses iterative subsampling to evaluate cluster robustness across parameters [70]. The workflow is implemented as follows:
Diagram 1: chooseR framework workflow for robust parameter selection.
Procedure:
- Define Parameter Space: Specify a range of values for the parameter you wish to optimize (e.g.,
resolution = seq(0.1, 3.0, by=0.1)). - Iterative Subsampling and Clustering: For each parameter value, repeat the following 100 times:
- Randomly subsample a proportion (e.g., 80%) of cells from the dataset.
- Perform the entire clustering workflow using the selected parameter value.
- Record the cluster labels for the subsampled cells.
- Construct Co-clustering Matrix: For each parameter, create a matrix that records how frequently every pair of cells was assigned to the same cluster across all iterations.
- Calculate Robustness Metrics:
- Compute a global silhouette score from the co-clustering matrix for each parameter value. The near-optimal parameter is often the one with the highest confidence-interval bound on the median silhouette value [70].
- Calculate per-cluster silhouette scores at the selected parameter to identify which specific clusters are poorly resolved and may require focused re-clustering in isolation.
- Validate Biologically: Use known stem cell marker genes to confirm that the clusters identified with the optimal parameter make biological sense.
Protocol 3: Evaluating Clustering Consistency with scICE
Clustering inconsistency can arise from stochastic processes in algorithms. The single-cell Inconsistency Clustering Estimator (scICE) efficiently evaluates this by generating multiple cluster labels through variations in the random seed [14].
Procedure:
- Parallel Label Generation: After standard QC and dimensionality reduction, run the Leiden clustering algorithm multiple times (e.g., 100x) on the same dataset at a fixed resolution, varying only the random seed. This can be done efficiently using parallel processing.
- Calculate Inconsistency Coefficient (IC):
- For each pair of generated cluster labels, compute the Element-Centric Similarity (ECS).
- Construct a similarity matrix
Sfrom all pairwise ECS values. - Compute the IC, which approaches 1 when labels are highly consistent and increases as inconsistency grows [14].
- Interpretation: An IC close to 1 indicates that the clustering result at that resolution is reliable and not dependent on random chance in the algorithm. A high IC warns of instability, suggesting the result may be an artifact.
The Scientist's Toolkit: Research Reagent Solutions
Table 2: Essential Tools and Algorithms for Clustering Optimization
| Tool / Algorithm | Category | Primary Function in Optimization |
|---|---|---|
| chooseR [70] | Robustness Framework | Guides parameter selection and provides per-cluster robustness scores via iterative subsampling. |
| scICE [14] | Consistency Framework | Evaluates clustering consistency across multiple algorithm runs using the Inconsistency Coefficient (IC). |
| Clustree [70] | Visualization | Visualizes how cluster assignments change across a range of resolution parameters. |
| SC3 [70] | Clustering Algorithm | Provides a consensus-based clustering approach with built-in stability estimation. |
| scLENS [14] | Dimensionality Reduction | Provides automatic signal selection for a more robust low-dimensional representation used in clustering. |
Integrated Workflow for Stem Cell Research
Combining the above protocols into a single, integrated workflow provides a comprehensive strategy for optimizing clustering in stem cell populations.
Diagram 2: Integrated workflow for comprehensive clustering optimization.
Application to Stem Cell Populations:
- Resolving Continuums: Stem cell differentiation is often a continuous process. If chooseR indicates low robustness for a large, central cluster, consider sub-clustering that specific population in isolation to better resolve intermediate states [70].
- Identifying Rare Subtypes: Systematically testing higher resolution parameters (e.g., >2.0) can help identify rare stem cell subtypes. The robustness scores from chooseR and consistency scores from scICE are critical for distinguishing true rare populations from technical over-clustering [14].
- Marker Gene Validation: Throughout the workflow, validate putative clusters by overlaying the expression of known and putative stem cell marker genes (e.g.,
OCT4,NANOGfor pluripotency) using Seurat'sFeaturePlot()andDotPlot()functions. A robust cluster should show distinct marker expression.
Optimizing clustering parameters is a critical, multi-faceted step in scRNA-seq analysis that is paramount for drawing accurate biological conclusions in stem cell research. Relying solely on default parameters or visual inspection of low-dimensional embeddings is insufficient and can lead to both over- and under-clustering. By integrating established heuristic methods with modern, robustness-focused frameworks like chooseR and scICE, researchers can navigate this complexity systematically. The provided protocols offer a concrete pathway to achieve statistically supported, biologically plausible clustering results, thereby enhancing the reliability of discoveries related to stem cell identity, heterogeneity, and differentiation.
Integrating Multi-omic Data (CITE-seq, scATAC-seq) for Confident Annotation
Single-cell multi-omics technologies have revolutionized stem cell research by enabling coupled measurements of transcriptomes, epigenomes, and proteomes within the same cell. This application note details a comprehensive Seurat-based workflow for integrating CITE-seq and scATAC-seq data to achieve confident annotation of stem and progenitor cell populations. We provide step-by-step protocols validated on hematopoietic stem and progenitor cells (HSPCs), demonstrating how multimodal integration resolves cellular heterogeneity more effectively than single-modality approaches. The framework leverages Seurat's Weighted Nearest Neighbor (WNN) method to harmonize data across modalities, enabling the identification of functionally distinct subpopulations through complementary biological signals. Detailed benchmarking results, reagent specifications, and implementation guidelines are included to facilitate adoption in stem cell research and drug development applications.
The characterization of stem cell populations represents a fundamental challenge in developmental biology, regenerative medicine, and therapeutic development. Traditional single-modality single-cell approaches provide limited perspectives on cellular identity, whereas multi-omics technologies simultaneously profile multiple molecular layers within the same cell [72]. CITE-seq (Cellular Indexing of Transcriptomes and Epitopes by Sequencing) jointly measures gene expression and cell surface protein abundance, while scATAC-seq (single-cell Assay for Transposase-Accessible Chromatin using sequencing) quantifies chromatin accessibility [73] [72]. When applied to complex stem cell populations, these complementary modalities reveal distinct aspects of cellular identity: transcriptomics identifies expressed genes, epigenomics reveals regulatory potential, and protein profiling confirms functional markers.
The Seurat analysis framework has emerged as a powerful platform for multimodal single-cell data integration, offering a cohesive toolkit for harmonizing these disparate data types [73] [74]. Its WNN approach enables simultaneous clustering of cells based on a weighted combination of both modalities, outperforming clustering based on either modality alone [73] [72]. This capability is particularly valuable for resolving rare stem cell subpopulations and transitional states that might be obscured in single-modality analyses.
For researchers investigating hematopoietic multipotent progenitors (MPPs) and other stem cell populations, multimodal integration has revealed functionally distinct subpopulations with unique biomolecular properties [21]. These advances underscore the critical importance of robust computational integration methods for elucidating stem cell biology and identifying novel therapeutic targets.
Methodologies and Experimental Protocols
Wet-Lab Experimental Design
Sample Preparation for Multi-omics
For HSPC studies, collect bone marrow aspirates from human donors or experimental models. Isplicate mononuclear cells using density gradient centrifugation (e.g., Ficoll-Paque). For CITE-seq, stain fresh cells with DNA-barcoded antibodies against relevant surface markers (e.g., CD34, CD38, CD45RA, CD90) following manufacturer protocols [73]. For scATAC-seq, isolate nuclei using detergent-based lysis and tagment with Tn5 transposase [75]. Use commercial platforms such as 10X Genomics Single Cell Multiome ATAC + Gene Expression for paired measurements [75] [74].
Critical Step: Process a subset of cells for flow cytometry to validate antibody staining patterns and cell viability before sequencing.
Library Preparation and Sequencing
For CITE-seq, construct libraries for both mRNA and antibody-derived tags (ADTs) according to established protocols [73]. For scATAC-seq, use the Chromium Next GEM Single Cell Multiome ATAC + Gene Expression reagent kits [75]. Sequence libraries appropriately: ≥50,000 reads per cell for scATAC-seq and ≥20,000 reads per cell for gene expression on Illumina platforms [75].
Quality Control: Assess library quality using Bioanalyzer/TapeStation and quantify via qPCR before sequencing.
Computational Analysis Workflow
Data Preprocessing and Quality Control
Begin by creating separate Seurat objects for each modality. For RNA and ADT data from CITE-seq, follow standard preprocessing:
For scATAC-seq data processed through Signac, create a chromatin assay:
Perform rigorous quality control separately for each modality:
- RNA: Remove cells with unique feature counts <200 or >2500 or >5% mitochondrial reads
- ADT: Remove outliers based on total ADT counts and visualize with feature scatter plots
- ATAC: Filter cells with nucleosome signal >4, TSS enrichment >2, and between 1000-50,000 peaks [75]
Normalization and Feature Selection
Normalize each modality using appropriate methods:
Identify highly variable features for downstream integration:
Multimodal Integration Using WNN
The core integration process employs Seurat's WNN method to construct a unified cell embedding:
Note: The modality.weight.name stores the learned weights, revealing which modality contributed more to the integrated analysis.
Comparative Framework for Integration Methods
Several integration strategies exist for single-cell multi-omics data, each with distinct advantages:
Table 1: Single-cell Multi-omics Integration Strategies
| Integration Type | Description | Example Tools | Advantages | Limitations |
|---|---|---|---|---|
| Early Integration | Direct concatenation of features from different modalities | Binarization + TF-IDF/LSI [76] | Simple implementation; preserves original feature space | May overweight modalities with more features; requires careful normalization |
| Intermediate Integration | Joint dimension reduction and modeling of multiple modalities | Seurat WNN [73], GLUE [77], scMDC [72] | Optimized weighting of modalities; handles modality-specific noise | Computationally intensive; complex implementation |
| Late Integration | Separate analysis followed by consensus clustering | CiteFuse [72], PALMO [78] | Flexible to modality-specific processing; robust to technical artifacts | May miss subtle cross-modality relationships |
For stem cell applications, intermediate integration methods like Seurat's WNN generally provide superior performance by adaptively weighting modalities based on information content [74].
Results and Benchmarking
Performance Evaluation of Integration Methods
Systematic benchmarking of integration methods provides guidance for selecting appropriate tools. Recent evaluations demonstrate that methods combining Harmony for batch correction with Seurat's WNN (as implemented in the Smmit pipeline) achieve excellent performance in both biological conservation and batch correction [74].
Table 2: Benchmarking of Integration Methods on Bone Marrow Mononuclear Cells (BMMCs)
| Method | ARI | NMI | cLISI | kBET | Running Time (min) | Memory (GB) |
|---|---|---|---|---|---|---|
| Smmit (Harmony+WNN) | 0.78 | 0.82 | 1.52 | 0.85 | 15 | 23.05 |
| MultiVI | 0.65 | 0.74 | 1.48 | 0.72 | 45 | 45.18 |
| scVAEIT | 0.71 | 0.76 | 1.50 | 0.68 | 1696 | >230 |
| MOFA+ | 0.62 | 0.70 | 1.45 | 0.65 | 52 | 38.92 |
| CCA + WNN | 0.75 | 0.79 | 1.51 | 0.78 | 18 | 25.44 |
Metrics: ARI (Adjusted Rand Index), NMI (Normalized Mutual Information), cLISI (cell-type Local Inverse Simpson's Index), kBET (k-nearest-neighbor Batch Effect Test). Evaluation performed on 69,249 BMMCs from 10 donors [74].
For HSPC analysis specifically, multimodal integration has successfully identified distinct multipotent progenitor subpopulations—including CD69+ MPPs with long-term engraftment potential, CLL1+ myeloid-biased MPPs, and CLL1−CD69− erythroid-biased MPPs—that were previously obscured in single-modality analyses [21].
Visualization and Interpretation of Integrated Data
Multimodal integration enables more confident cell type annotation through complementary evidence. The weighted nearest neighbor graph facilitates the identification of cell populations that consistently cluster across modalities, increasing confidence in annotation results.
To validate annotations, examine concordance between protein and RNA expression for key markers:
Additionally, identify cluster-specific markers across all measured modalities to functionally characterize populations:
This multimodal marker identification provides stronger evidence for functional roles than any single modality alone.
The Scientist's Toolkit
Table 3: Essential Research Reagents and Computational Tools
| Resource | Type | Function | Example Application |
|---|---|---|---|
| 10X Genomics Single Cell Multiome ATAC + Gene Expression | Wet-lab Kit | Simultaneously profiles gene expression and chromatin accessibility in same nucleus | Paired measurement of transcriptome and regulome in HSPCs [74] |
| DNA-barcoded Antibodies | Reagent | Quantifies surface protein abundance alongside transcriptome | CITE-seq profiling of stem cell surface markers (CD34, CD38, CD90) [73] |
| Seurat R Toolkit | Software | Comprehensive package for single-cell multimodal analysis | Data integration, visualization, and clustering of multi-omics data [73] |
| Signac | Software | Specialized toolkit for single-cell epigenomics analysis | Processing and analysis of scATAC-seq data alongside transcriptomic data [75] |
| Harmony | Algorithm | Efficient batch effect correction across samples | Integration of multi-sample multi-omics datasets before WNN analysis [74] |
| PALMO | Platform | Longitudinal multi-omics analysis platform | Tracking stem cell population dynamics across timepoints [78] |
Workflow Diagram
Workflow Diagram Title: Multi-omic Data Integration Pipeline
Discussion and Best Practices
Applications in Stem Cell Research
Multimodal integration approaches have proven particularly valuable for elucidating stem cell biology. In hematopoietic stem and progenitor cells, integrated analysis has revealed previously unrecognized heterogeneity, identifying functionally distinct subpopulations through their combined transcriptomic, epigenomic, and proteomic signatures [21]. These findings demonstrate how multi-omics data can uncover biologically meaningful subdivisions within traditionally defined stem cell populations.
The weighted nearest neighbor approach enables researchers to determine which modalities contribute most significantly to cell type identification. In stem cell systems, we often observe that protein markers provide crucial resolution for identifying primitive subsets, while transcriptomics reveals functional states and developmental trajectories [73] [21]. Epigenetic data complements these by identifying regulatory programs that maintain stem cell identity or prime cells for differentiation.
Troubleshooting and Quality Assessment
Successful multimodal integration requires careful quality assessment at multiple stages:
- Modality-specific QC: Remove technical outliers separately for each data type before integration
- Integration diagnostics: Use metrics like integration consistency score [77] to detect alignment failures
- Biological validation: Verify that multimodal clusters correspond to functionally distinct populations through known markers
When integration yields poor results, consider:
- Adjusting the number of dimensions included from each modality
- Increasing the harmony theta parameter for more aggressive batch correction
- Verifying that all modalities capture the same biological populations
Future Directions
The field of single-cell multi-omics is rapidly evolving, with emerging methods extending integration to three or more modalities [77]. For stem cell research, incorporating spatial transcriptomics and proteomics will provide crucial context for understanding niche interactions. Computational methods are also advancing toward more sophisticated deep learning approaches that can better model complex relationships across modalities while handling the technical noise inherent in single-cell data [72] [77].
As these technologies mature, we anticipate that confident, multimodal annotation will become the standard for defining stem cell populations, ultimately accelerating their therapeutic application in regenerative medicine and drug development.
Single-cell RNA sequencing (scRNA-seq) has revolutionized stem cell research by enabling the dissection of cellular heterogeneity at unprecedented resolution. A critical step in this analysis is clustering, where cells are grouped based on gene expression profiles to identify distinct stem cell populations and states [79]. However, the reliability of this process is often compromised by clustering inconsistency due to stochastic processes in the algorithms themselves [14]. This methodological instability presents a significant challenge for researchers seeking to draw robust biological conclusions about stem cell populations, their differentiation pathways, and functional heterogeneity.
To address these challenges, two advanced computational frameworks have emerged: SeuratExtend, which expands the popular Seurat toolkit with enhanced analytical and visualization capabilities, and scICE (single-cell Inconsistency Clustering Estimator), which specifically evaluates and improves clustering reliability [80] [14]. When applied to stem cell research, these tools offer complementary strengths—SeuratExtend provides an integrated environment for comprehensive analysis, while scICE ensures the clustering results underlying these analyses are stable and reproducible.
This application note details protocols for leveraging both tools within a cohesive Seurat-based workflow for stem cell population analysis, emphasizing practical implementation for researchers, scientists, and drug development professionals.
SeuratExtend: An Enhanced Ecosystem for Single-Cell Analysis
Built upon the widely adopted Seurat framework, SeuratExtend addresses key limitations in the scRNA-seq analysis ecosystem by strategically integrating essential tools and databases into a unified R package [63]. It enhances the standard Seurat workflow through four key innovations: advanced functional and pathway analysis with integrated databases (Gene Ontology, Reactome), seamless integration of Python-based tools (scVelo, Palantir, SCENIC) via R interface, enhanced visualization capabilities with publication-ready graphics, and utility functions for common tasks like gene identifier conversion [80] [63].
For stem cell researchers, this integration is particularly valuable when studying developmental trajectories, gene regulatory networks, and cellular heterogeneity in complex populations such as hematopoietic stem and progenitor cells (HSPCs) [2]. The package's ability to bridge R and Python environments eliminates the need for dual-language proficiency while providing access to specialized algorithms for trajectory inference and gene regulatory network analysis [63].
scICE: Ensuring Clustering Reliability
The scICE tool specifically addresses the critical problem of clustering inconsistency in scRNA-seq analysis. Conventional clustering algorithms like Leiden and Louvain contain stochastic processes that can yield different results across runs depending on random seeds—in worst-case scenarios, altering seeds can cause previously detected clusters to disappear or entirely new clusters to emerge [14]. This variability significantly undermines the reliability of identified stem cell populations and subsequent biological interpretations.
scICE introduces a novel approach to evaluating clustering consistency using the Inconsistency Coefficient (IC), which measures the stability of cluster labels across multiple runs with different random seeds [14] [81]. Unlike conventional consensus clustering methods that require computationally intensive processes, scICE achieves up to 30-fold speed improvement while providing robust consistency evaluation, making it practical for large datasets exceeding 10,000 cells [14]. This performance advantage is particularly valuable in stem cell research where sample sizes continue to grow with technological advancements.
Table 1: Comparative Analysis of SeuratExtend and scICE
| Feature | SeuratExtend | scICE |
|---|---|---|
| Primary Function | Extended scRNA-seq analysis and visualization | Clustering consistency evaluation |
| Core Innovation | Integration of multiple databases and Python tools | Inconsistency Coefficient (IC) metric |
| Key Applications | Pathway analysis, trajectory inference, GRN reconstruction | Reliable cluster number selection, stability assessment |
| Computational Efficiency | Moderate resource requirements | Up to 30x faster than conventional consensus methods |
| Stem Cell Research Value | Comprehensive characterization of populations and states | Validation of identified stem cell subpopulations |
Integrated Workflow Architecture
The complementary relationship between these tools within a stem cell analysis pipeline can be visualized through their architectural integration:
Application Protocols for Stem Cell Research
Protocol 1: Clustering Consistency Assessment with scICE
Principle: Evaluate the consistency of clustering results across multiple runs using the Inconsistency Coefficient (IC) to identify stable stem cell populations [14].
Materials:
- Processed scRNA-seq data (count matrix after quality control)
- R environment (v4.0.0 or higher)
- scICE R package
Procedure:
- Data Preparation: Begin with a quality-controlled Seurat object containing stem cell transcriptomes. Ensure cells with high mitochondrial content (>5%) and extreme feature counts have been filtered [2].
Parameter Range Identification:
Consistency Evaluation:
Stable Cluster Identification:
Result Interpretation:
Technical Notes: The IC metric is calculated by comparing multiple cluster labels generated by varying random seeds in the Leiden algorithm. It quantifies similarity using element-centric similarity, which provides an intuitive and unbiased comparison of cluster labels [14]. The computational efficiency of scICE stems from its avoidance of conventional consensus matrix construction, instead relying on parallel processing of clustering tasks [14].
Protocol 2: Comprehensive Stem Cell Characterization with SeuratExtend
Principle: Utilize SeuratExtend's enhanced functionality for in-depth analysis of identified stem cell populations, including pathway analysis, trajectory inference, and regulatory network reconstruction.
Materials:
- Seurat object with validated clusters from scICE
- SeuratExtend R package
- Pre-configured Python environment (for trajectory analysis tools)
Procedure:
- Enhanced Visualization:
# Visualize multiple stem cell markers simultaneously
FeaturePlot3(seurat_object, feature.1 = "CD34",
 feature.2 = "PROM1", feature.3 = "KIT")
Pathway and Functional Analysis:
Trajectory Analysis:
Gene Regulatory Network Analysis:
Technical Notes: SeuratExtend uses the reticulate framework to integrate Python tools, creating a conda environment named "seuratextend" containing all required packages [63]. For gene identifier conversion, localized databases improve reliability and performance compared to online biomaRt queries [82].
Protocol 3: Integrated Workflow for Hematopoietic Stem Cell Analysis
Principle: Combine scICE and SeuratExtend in a unified workflow to identify and characterize reliable hematopoietic stem and progenitor cell (HSPC) subpopulations from umbilical cord blood samples [2].
Materials:
- CD34+ or CD133+ HSPCs from human umbilical cord blood
- 10x Genomics Chromium platform for scRNA-seq
- Cell Ranger pipeline for initial data processing
Procedure:
- Data Generation and Preprocessing:
Clustering Validation:
Population Characterization:
Differentiation Trajectory Analysis:
Technical Notes: When working with limited HSPC numbers, fixation protocols compatible with 10x Genomics Flex assays can preserve biology while reducing processing urgency [83]. The "pseudobulk" approach of merging CD34+ and CD133+ datasets may reveal shared transcriptional programs [2].
Research Reagent Solutions
Table 2: Essential Research Reagents and Computational Tools
| Item | Function | Example Application |
|---|---|---|
| Chromium Single Cell 3' Kit | scRNA-seq library preparation | Transcriptome profiling of HSPC subpopulations [2] |
| CD34/CD133 Antibody Panels | FACS sorting of stem cells | Isolation of HSPCs from umbilical cord blood [2] |
| SeuratExtend R Package | Extended scRNA-seq analysis | Pathway analysis and trajectory inference in stem cells [80] |
| scICE R Package | Clustering consistency evaluation | Reliable identification of stem cell subpopulations [14] |
| biomaRt Database | Gene identifier conversion | Cross-species comparison of stem cell markers [82] |
| Python Environment | Tool integration platform | Running scVelo, Palantir, and SCENIC algorithms [63] |
Results Interpretation and Technical Considerations
Evaluating Clustering Reliability
When applying scICE to stem cell datasets, interpretation of IC values is crucial for determining clustering reliability:
Table 3: Interpretation Guide for scICE Results
| IC Value | Interpretation | Recommended Action |
|---|---|---|
| < 1.005 | High consistency | Proceed with biological interpretation |
| 1.005 - 1.02 | Moderate inconsistency | Consider cluster merging or verify with markers |
| > 1.02 | High inconsistency | Exclude from further analysis |
The IC threshold of 1.005 corresponds to approximately 0.25% of cells exhibiting membership inconsistency across clustering runs, providing a stringent cutoff for reliable stem cell population identification [14] [81]. Application of scICE to 48 real and simulated datasets demonstrated that only ~30% of clustering numbers between 1 and 20 showed consistent results, highlighting the importance of this validation step [14].
Visualizing Analytical Workflows
The integrated analytical process for stem cell population analysis can be summarized as:
Troubleshooting Common Issues
Low Clustering Consistency: If scICE returns high IC values across multiple resolutions, consider increasing the number of highly variable genes or adjusting the principal component count in initial Seurat processing.
Integration Challenges: For Python tool integration issues, verify the conda environment configuration using
reticulate::conda_list()and ensure all required packages are installed in the "seuratextend" environment [63].Gene Conversion Limitations: When converting gene identifiers between human and mouse, approximately 10-15% of genes may lack direct homologs. Verify critical stem cell markers (e.g., CD34, PROM1) individually [82].
The integration of scICE for clustering validation and SeuratExtend for extended analysis creates a robust framework for stem cell population investigation. This combined approach addresses both methodological reliability and analytical depth, enabling researchers to draw more confident conclusions about stem cell heterogeneity, differentiation trajectories, and regulatory mechanisms.
As single-cell technologies continue to advance, with increasing cell numbers and multi-modal measurements, such integrated computational frameworks will become increasingly essential for extracting meaningful biological insights from complex stem cell systems. The protocols outlined here provide a foundation for implementing these powerful tools in both basic research and drug development contexts.
Within the broader context of optimizing the Seurat workflow for clustering and analyzing stem cell populations, managing technical noise is a critical prerequisite for revealing authentic biological signals. Single-cell RNA sequencing (scRNA-seq) data is inherently confounded by non-biological variation, which can obscure meaningful results and lead to misinterpretation of cellular identities and states. Two predominant sources of such technical noise are cell cycle effects and mitochondrial contamination. Cell cycle phase heterogeneity can drive expression variation that is unrelated to cell type, potentially conflating cycling and non-cycling cells within stem cell progenitor compartments. Concurrently, high mitochondrial RNA content often serves as a proxy for cell stress or apoptosis, compromising the integrity of the data. This protocol details a robust methodology for identifying, quantifying, and regressing out these confounding factors using the Seurat package, thereby refining downstream clustering and analysis for more accurate biological discovery in stem cell research.
The following tables summarize the key quality control metrics and gene sets used in the protocols below. These provide a reference for researchers to implement the procedures and interpret their results.
Table 1: Key Quality Control (QC) Metrics for Single-Cell Data Filtering
| QC Metric | Description | Typical Filtering Threshold | Biological/Technical Interpretation |
|---|---|---|---|
| nFeature_RNA | Number of unique genes detected per cell | 200 - 2500 (dataset dependent) [7] | Filters low-quality cells (low counts) and potential doublets (high counts) |
| percent.mt | Percentage of reads mapping to mitochondrial genome | <5% [7] or <20% [84] | Filters dying, stressed, or low-quality cells with cytoplasmic RNA loss |
| percent.ribo | Percentage of reads mapping to ribosomal genes | >5% (dataset dependent) [84] | Retains cells with sufficient ribosomal content; varies by cell type |
| S.Score | Score based on expression of S-phase marker genes [85] | Used for regression, not filtering | Quantifies activity of the cell cycle S phase |
| G2M.Score | Score based on expression of G2/M-phase marker genes [85] | Used for regression, not filtering | Quantifies activity of the cell cycle G2/M phase |
Table 2: Standard Gene Lists for Cell Cycle Scoring
| Gene List | Source | Number of Genes | Function |
|---|---|---|---|
| s.genes | Tirosh et al., 2015 [85] [86] | 43 (human) | Marker genes for the DNA replication (S) phase |
| g2m.genes | Tirosh et al., 2015 [85] [86] | 54 (human) | Marker genes for the G2/M phase (growth and mitosis) |
Experimental Protocols
Mitochondrial Contamination: QC and Regression
High mitochondrial read percentage is a hallmark of low-quality or dying cells, as mitochondrial transcripts are over-represented when cytoplasmic RNA is lost due to perforated cell membranes [84]. The following protocol outlines the steps for quantification and correction.
Detailed Methodology:
Calculate Percentage: Using a Seurat object, compute the percentage of counts originating from mitochondrial genes. This requires a species-specific pattern to identify these genes (e.g.,
^MT-for human,^mt-for mouse).Visualize and Filter: Visually inspect the QC metrics using violin plots or scatterplots. Subsequently, filter out cells deemed to be of low quality based on predetermined thresholds.
Regress Out Variation: The mitochondrial signal can be regressed out during the data scaling step. This process does not remove the cells but adjusts the expression values to mitigate the influence of this technical variable.
Alternatively, the
SCTransformnormalization workflow can be used, which also incorporates avars.to.regressparameter for this purpose [87].
Cell Cycle Effect: Scoring and Regression
Variation in transcriptomes due to the cell cycle can dominate the principal component analysis (PCA), making it difficult to distinguish true cell types [85]. This protocol allows for the calculation of cell cycle scores and their removal from the data.
Detailed Methodology:
Assign Cell Cycle Scores: Score each cell based on its expression of predefined S and G2/M phase markers. This function adds
S.Score,G2M.Score, and a predictedPhase(G1, S, G2M) to the metadata.Visualize Phase Separation: Run PCA using the cell cycle genes to confirm that they drive a significant portion of the variation in the data. Cells should separate clearly by phase.
Regress Out Scores: Regress out the quantitative
S.ScoreandG2M.Scorefrom the expression data. It is critical to regress both scores simultaneously to avoid creating artificial differences [85].After regression, a PCA run on the variable genes should no longer return principal components associated with cell cycle genes.
Workflow Visualization
The following diagram illustrates the integrated logical workflow for handling both mitochondrial contamination and cell cycle effects within the standard Seurat preprocessing pipeline.
The Scientist's Toolkit
Table 3: Essential Research Reagent Solutions for Technical Noise Regression
| Item | Function/Description | Application in Protocol |
|---|---|---|
| Seurat R Package | A comprehensive toolkit for single-cell genomics data analysis [85] [7]. | The primary software environment for executing the entire workflow, from data input to final regression. |
| Cell Cycle Gene List | A curated list of S-phase and G2/M-phase marker genes, originally from Tirosh et al., 2015 [85]. | Used as the reference set for the CellCycleScoring() function to calculate phase-specific scores for each cell. |
| Species-Specific Mitochondrial Gene Pattern | A regular expression (e.g., ^MT- for human) to identify mitochondrial genes in the count matrix. |
Enables the PercentageFeatureSet() function to accurately calculate the percent.mt QC metric. |
| SCTransform Algorithm | A modern normalization and variance stabilization method based on a regularized negative binomial model [67] [87]. | An alternative to NormalizeData, FindVariableFeatures, and ScaleData that can also regress out percent.mt and other variables. |
| High-Quality Reference Transcriptomes | Annotated genomes (e.g., GRCh38, GRCm39) for accurate alignment and quantification of gene expression. | The foundational step that ensures mitochondrial and cell cycle genes are correctly identified and quantified in the initial count matrix. |
Strategies for Analyzing Rare Stem Cell Subpopulations through Sub-clustering
Within seemingly homogeneous stem cell populations lies significant transcriptional heterogeneity, containing rare subpopulations critical for processes like differentiation, self-renewal, and drug resistance. Identifying these rare populations requires specialized bioinformatic strategies that move beyond standard clustering approaches. This protocol details a comprehensive framework using Seurat alongside specialized tools like scCAD to detect and characterize rare stem cell subtypes through advanced sub-clustering methodologies.
Foundational Seurat Workflow for Initial Clustering
Data Preprocessing and Quality Control
Begin with standard preprocessing to establish a high-quality dataset for downstream rare cell analysis [7] [88].
- Cell Filtering: Filter out cells with unique feature counts <200 or >2,500 and mitochondrial counts >5% to remove low-quality cells and doublets [7].
- Normalization: Employ the
LogNormalizemethod with a scale factor of 10,000 to normalize feature expression measurements for each cell [7]. - Feature Selection: Identify the top 2,000 highly variable features using the
vstmethod inFindVariableFeatures()to highlight biological signal [7]. - Scaling: Scale the data using
ScaleData()to shift mean expression to 0 and variance to 1 across cells, giving equal weight in downstream analyses [7].
Dimensionality Reduction and Initial Clustering
- Linear Dimension Reduction: Perform PCA on scaled data using variable features. Select principal components based on elbow plots for downstream analysis [7].
- Clustering: Apply the Leiden algorithm to cluster cells based on selected PCs, using a resolution parameter typically between 0.4-1.2 for initial population separation [88].
- Non-linear Visualization: Generate UMAP embeddings for visualizing initial clustering results and identifying potential rare populations for further investigation [88].
Table 1: Key Preprocessing Steps for Stem Cell Data
| Step | Function | Key Parameters | Purpose in Rare Cell Analysis |
|---|---|---|---|
| Quality Control | subset() |
nFeature_RNA > 200 & nFeature_RNA < 2500 & percent.mt < 5 |
Remove low-quality cells that obscure rare populations |
| Normalization | NormalizeData() |
normalization.method = "LogNormalize", scale.factor = 10000 |
Standardize expression levels for cross-cell comparison |
| Variable Features | FindVariableFeatures() |
selection.method = "vst", nfeatures = 2000 |
Identify genes driving heterogeneity |
| Scaling | ScaleData() |
features = all.genes |
Equalize gene influence prior to PCA |
| Clustering | FindClusters() |
resolution = 0.8 (adjustable) |
Initial partitioning of cellular landscape |
Advanced Sub-clustering Strategies for Rare Population Identification
Iterative Cluster Decomposition with scCAD
For systematic identification of rare cell types obscured in initial clustering, implement the scCAD (Cluster decomposition-based Anomaly Detection) method [19].
Protocol:
- Ensemble Feature Selection: Combine initial clustering labels with random forest models to preserve differentially expressed genes in rare cell types, overcoming limitations of using only highly variable genes [19].
- Iterative Cluster Decomposition: Decompose major clusters from initial clustering through iterative re-clustering based on the most differential signals within each cluster [19].
- Cluster Merging and Anomaly Scoring: Merge clusters with closest Euclidean distance between centers, then employ an isolation forest model using candidate differentially expressed gene lists to calculate anomaly scores for all cells [19].
- Rare Cluster Identification: Compute an independence score by assessing overlap between highly anomalous cells and those within each cluster, serving as a measure of each cluster's rarity [19].
Workflow for scCAD Rare Cell Detection
Multiscale Clustering (MSC) Framework
Implement the Multiscale Clustering approach to construct sparse cell-cell correlation networks for unsupervised identification of cell types and subtypes across multiple resolutions [89].
Protocol:
- Locally Embedded Network Construction: Utilize graph embedding techniques on a topological sphere to deterministically identify nearest neighbors for each cell without specifying kNN parameters [89].
- Low-quality Edge Filtering: Filter edges through evaluation of low similarity and edge centrality to produce sparse, clustered cell networks [89].
- Top-down Hierarchical Clustering: Iteratively split parent cell networks into more coherent and compact subnetworks using the AdaptSplit algorithm, which assesses improvements in compactness and intracluster connectivity at each split [89].
- Hierarchy Exploration: Continue iterative splitting until no child cluster shows improved quality over predecessors, completing the search for cell hierarchy that reveals rare subtypes [89].
Guided Sub-clustering of Target Populations
For hypothesis-driven investigation of specific stem cell populations:
Protocol:
- Population Isolation: Extract cells belonging to a cluster of interest using Seurat's
subset()function. - Re-run Variable Features: Identify features variable within the specific subpopulation using
FindVariableFeatures()on the subset. - Sub-clustering: Re-cluster the population at higher resolution (1.2-2.0) to reveal substructure [88].
- Differential Expression Testing: Identify marker genes distinguishing new subclusters using
FindAllMarkers()with min.pct = 0.25 and logfc.threshold = 0.25.
Validation and Downstream Analysis
Confirming Rare Population Identity
- Multi-method Validation: Cross-reference rare populations identified through different algorithms (e.g., scCAD, MSC, and Seurat sub-clustering) to confirm biological relevance [19] [89].
- Marker Gene Expression: Verify expression of known rare stem cell markers alongside novel differentially expressed genes [88].
- Functional Characterization: Perform pathway enrichment analysis on rare population gene signatures to identify potential biological roles.
Differential Abundance Analysis
Detect statistically significant changes in rare population proportions between experimental conditions using specialized tools:
Protocol:
- Prepare Input Data: Format cell type counts and metadata for each sample.
- Run scCODA: Utilize the scCODA package specifically designed for differential abundance analysis in low-sample cases for non-rare cell types [88].
- Interpret Results: Identify conditions where rare populations show significant expansion or depletion, providing insights into functional importance.
Table 2: Tool Comparison for Rare Cell Analysis
| Tool | Methodology | Strengths | Performance |
|---|---|---|---|
| scCAD [19] | Iterative cluster decomposition with anomaly detection | Superior rare cell identification accuracy (F1=0.417) | 24-48% improvement over other methods |
| MSC [89] | Sparse network construction with top-down hierarchy | Identifies biologically meaningful cell hierarchies | Effective across noise levels and cluster sizes |
| GiniClust [88] | Gini index-based gene selection with density-based clustering | Effective for rare cell detection | Sacrifices performance on larger clusters |
| RaceID [89] | Identification of outlier cells within clusters | Designed specifically for rare cell identification | Competent performance in benchmark studies |
| Seurat [90] | Shared nearest neighbor modularity optimization | Excellent for non-malignant cells; integrated workflow | High clustering quality in cancer benchmarks |
Implementation Considerations
Addressing Technical Artifacts
- Batch Effect Correction: For multi-sample studies, integrate datasets using Harmony or scVI prior to sub-clustering to prevent technical variation from obscuring rare biological signals [88].
- Ambient RNA Correction: Employ SoupX or CellBender to account for background mRNA contamination that may particularly affect rare cell identification [91].
- Doublet Detection: Utilize DoubletFinder or similar algorithms to remove multiplets that can mimic rare cell populations [88].
Limitations and Caveats
- Unsupervised Clustering Challenges: Standard unsupervised approaches may not accurately reflect biological distinctions; CD4+ and CD8+ T cells show mixing in clusters regardless of feature selection method [56].
- Validation Imperative: Computational predictions of rare populations require experimental validation through protein markers, functional assays, or independent methodologies [56] [88].
- Resolution-Specific Interpretation: Rare population identification depends heavily on clustering parameters; explore multiple resolutions and interpret findings accordingly.
Rare Cell Validation Workflow
The Scientist's Toolkit
Table 3: Essential Research Reagent Solutions
| Tool/Resource | Function | Application Context |
|---|---|---|
| Seurat [7] | Comprehensive single-cell analysis platform | Foundational clustering, visualization, and differential expression |
| scCAD [19] | Cluster decomposition-based anomaly detection | Specialized identification of rare cell types in complex data |
| MSC [89] | Multiscale clustering framework | Construction of cell hierarchies and subtype discovery |
| CellChat [92] | Cell-cell communication analysis | Inferring signaling networks involving rare populations |
| Monocle3 [92] | Trajectory and pseudotime analysis | Positioning rare cells in differentiation trajectories |
| DoubletFinder [88] | Doublet detection | Removing technical artifacts that mimic rare cells |
| SoupX [88] | Ambient RNA correction | Reducing background noise for clearer rare cell signals |
| PanglaoDB [88] | Curated cell type markers | Annotation of rare population identity |
| scCODA [88] | Differential abundance testing | Quantifying rare population changes across conditions |
| 10x Genomics [91] | Single-cell platform | Generating input data for rare cell analysis |
Validating Cluster Identity and Benchmarking Against Alternative Methods
Assessing Clustering Consistency and Robustness with scICE
Single-cell RNA sequencing (scRNA-seq) has revolutionized stem cell research by enabling the investigation of cellular heterogeneity at unprecedented resolution. A fundamental step in scRNA-seq analysis is clustering, which groups cells with similar gene expression profiles to identify distinct cell types or states. In stem cell biology, this is particularly crucial for identifying novel progenitor populations, understanding differentiation trajectories, and characterizing cellular responses to experimental conditions. However, widely used clustering algorithms, such as the Leiden algorithm implemented in popular analysis toolkits like Seurat, exhibit significant stochasticity, producing different results across runs with different random seeds [14]. This inconsistency can manifest as disappearing clusters or the emergence of entirely new clusters merely by changing the random seed, potentially leading to unreliable biological interpretations and hampering reproducibility in stem cell research.
The scICE (single-cell Inconsistency Clustering Estimator) framework addresses these critical limitations by providing a systematic approach to evaluate clustering consistency and identify robust clustering solutions. Unlike conventional consensus methods that are computationally prohibitive for large datasets, scICE achieves up to a 30-fold improvement in speed while comprehensively evaluating clustering reliability across different cluster numbers [14]. This application note details the integration of scICE within the standard Seurat workflow for stem cell population analysis, providing experimental protocols and validation strategies to enhance the robustness of clustering-based discoveries.
Theoretical Foundation: The scICE Framework
Quantifying Clustering Inconsistency
The core innovation of scICE is the Inconsistency Coefficient (IC), a robust metric that quantifies the stability of clustering results across multiple runs. The IC calculation involves several sophisticated steps:
- Multiple Label Generation: scICE runs the Leiden clustering algorithm multiple times (typically 50-100 iterations) on the same dataset while varying only the random seed, collecting all resulting cluster labels [14].
- Element-Centric Similarity Calculation: For each pair of cluster labels, scICE computes the Element-Centric Similarity (ECS), which provides an unbiased comparison of cluster assignments by accounting for both cluster membership and structure [14]. The ECS is derived from affinity matrices that capture similarity structures between cells based on shared cluster memberships.
- Similarity Matrix Construction: All pairwise ECS values are assembled into a similarity matrix S, where each element ( S{ij} ) represents the similarity between cluster labels ( ci ) and ( c_j ) [14].
- IC Calculation: The final IC value is computed using the inverse of ( pSp^T ), where ( p ) represents the probability vector of different label occurrences [14].
An IC value close to 1 indicates highly consistent clustering results, occurring either when all cluster labels are nearly identical or when one dominant label emerges across iterations. As IC values increase above 1, they indicate greater inconsistency, typically when multiple distinct clustering solutions appear with similar probabilities [14].
Computational Efficiency
scICE achieves remarkable computational efficiency through two key strategies. First, it eliminates the need for the computationally expensive consensus matrix used in traditional methods, instead relying on the more efficient similarity matrix approach. Second, it implements parallel processing that distributes clustering tasks across multiple cores, significantly reducing processing time [14]. This efficiency makes rigorous consistency evaluation feasible even for large stem cell datasets exceeding 10,000 cells.
Table 1: Interpretation Guide for Inconsistency Coefficient Values
| IC Value Range | Interpretation | Recommended Action |
|---|---|---|
| 1.00 - 1.02 | High Consistency | Clusters are highly reliable; suitable for downstream analysis |
| 1.02 - 1.05 | Moderate Consistency | Clusters are generally reliable; minor inconsistencies unlikely to affect major conclusions |
| 1.05 - 1.10 | Low Consistency | Clusters show significant instability; interpret with caution or explore alternative parameters |
| >1.10 | High Inconsistency | Clusters are unreliable; should not be used for biological interpretation |
Integration of scICE with Seurat Workflow for Stem Cell Research
Comprehensive Experimental Protocol
The following protocol details the integration of scICE into a standard Seurat-based analysis workflow for stem cell populations, encompassing quality control, normalization, clustering, and consistency assessment.
A. Sample Preparation and Data Acquisition
- Cell Source: Utilize embryonic stem cells (ESCs), induced pluripotent stem cells (iPSCs), or adult stem cells (ASCs) relevant to your research question [93]. For stem cell-based embryo models (SCBEMs), adhere to ISSCR guidelines regarding culture endpoints and transplantation prohibitions [94].
- scRNA-seq Library Preparation: Follow established single-cell protocols (e.g., 10X Genomics, Smart-seq2) with appropriate quality controls. Include spike-in controls and unique molecular identifiers (UMIs) to ensure data quality.
- Sequencing: Aim for a minimum of 50,000 reads per cell with appropriate depth to capture stem cell heterogeneity. Include both positive controls (known cell mixtures) and negative controls (empty wells) to assess technical variability.
B. Quality Control and Preprocessing
- Data Import: Load raw count matrices into Seurat using
Read10X()for Cell Ranger outputs orRead10X_h5()for HDF5 formats [7]. Initial Filtering: Apply standard quality thresholds:
Mitochondrial DNA Calculation:
Comprehensive QC Metrics: Apply additional quality controls as detailed in Table 2.
- Data Filtering: Remove low-quality cells based on established thresholds:
Table 2: Quality Control Metrics for Stem Cell scRNA-seq Data
| QC Metric | Description | Stem Cell-Specific Considerations | Typical Thresholds |
|---|---|---|---|
| nFeature_RNA | Number of genes detected per cell | Stem cells may exhibit different complexity profiles; establish baseline for your cell type | 200-2500 genes/cell |
| nCount_RNA | Total number of UMIs per cell | Varies by stem cell type and differentiation state | 500-10,000 UMIs/cell |
| percent.mt | Percentage of mitochondrial reads | Varies by metabolic state; pluripotent stem cells may have distinct profiles | <5-10% |
| percent.ribo | Percentage of ribosomal reads | May indicate translational state; monitor but use flexible thresholds | Context-dependent |
| Doublet Score | Probability of multiple cells | Stem cell aggregates may increase doublet risk | Remove top 5-10% |
C. Normalization, Scaling, and Feature Selection
Normalization: Apply log-normalization to account for sequencing depth:
Highly Variable Feature Identification:
Data Scaling: Regress out unwanted sources of variation:
D. Dimensionality Reduction and Initial Clustering
Principal Component Analysis:
Nearest Neighbor Graph Construction:
Initial Clustering:
UMAP Visualization:
E. scICE Consistency Assessment
Installation and Setup:
Consistency Evaluation Across Resolutions:
Interpretation and Robust Cluster Selection:
F. Downstream Analysis with Validated Clusters
Conserved Marker Identification:
Differential Expression Analysis:
Biological Validation: Integrate clustering results with stem cell-specific knowledge bases and functional annotations to ensure biological relevance.
Workflow Visualization
The following diagram illustrates the integrated Seurat-scICE workflow for robust clustering of stem cell populations:
Integrated Seurat-scICE Workflow for Stem Cell Analysis
Validation and Interpretation Framework
Comprehensive Cluster Validation Strategy
Robust validation of clustering results requires multiple complementary approaches beyond consistency assessment:
- Classifier-Based Corroboration: Train supervised classifiers (e.g., SVM) on cluster assignments and assess classification accuracy using cross-validation. High accuracy indicates well-separated clusters [95].
- Confound Analysis: Test whether identified clusters simply reflect technical artifacts (batch effects, sequencing depth) or biological covariates (cell cycle stage) rather than genuine cell types [95].
- Biological Plausibility Assessment: Evaluate whether marker genes for each cluster align with established stem cell biology and expected differentiation lineages [93] [94].
- Stability Across Algorithms: Verify that similar clusters emerge using different clustering algorithms (e.g., hierarchical clustering, K-means) [95].
Interpretation Guidelines for Stem Cell Biology
When interpreting scICE-validated clusters in stem cell research:
- Developmental Continuums: Recognize that stem cell populations often exist along differentiation continua rather than discrete clusters. Use trajectory inference methods (e.g., Monocle, PAGA) to complement clustering results.
- Rare Population Identification: Apply scICE to subclustering approaches to identify rare progenitor populations with increased confidence.
- Cross-Condition Comparisons: When comparing stem cell populations across experimental conditions (e.g., knockout vs wild-type, different differentiation protocols), ensure clustering consistency within each condition before performing comparative analyses.
Table 3: Troubleshooting Common Clustering Issues in Stem Cell Data
| Problem | Potential Causes | scICE Signature | Solutions |
|---|---|---|---|
| High inconsistency across all resolutions | Excessive technical noise or insufficient informative features | IC >1.1 across all parameters | Increase QC stringency; Adjust variable feature selection; Integrate SCTransform normalization |
| Inconsistent rare populations | Stochastic assignment of small cell groups | Variable IC across subclustering attempts | Increase number of scICE iterations; Adjust graph parameters to enhance local connectivity |
| Batch-driven clustering | Strong technical batch effects masking biological signals | Consistent clusters within batches but not across them | Apply batch correction methods (Harmony, CCA) before clustering |
| Over-clustering | Resolution too high, splitting homogeneous populations | Multiple high-IC solutions at adjacent resolutions | Select lower resolution with good IC; Validate with biological markers |
Research Reagent Solutions
Table 4: Essential Computational Tools for Robust Stem Cell Clustering
| Tool/Resource | Function | Application in Stem Cell Research |
|---|---|---|
| Seurat | Comprehensive scRNA-seq analysis platform | Primary framework for data processing, visualization, and initial clustering |
| scICE R package | Clustering consistency evaluation | Identifies robust clustering solutions for reliable stem cell population identification |
| DoubletFinder | Doublet detection and removal | Critical for stem cell cultures prone to aggregation and doublet formation |
| SoupX | Ambient RNA contamination removal | Improves data quality in dense stem cell cultures |
| SCENIC | Gene regulatory network inference | Identifies key transcription factors driving stem cell identities and fate decisions |
| Slingshot | trajectory inference | Maps differentiation pathways from pluripotent to specialized cell states |
| CellMarker database | Cell type marker repository | References known stem cell and differentiation markers for annotation validation |
The integration of scICE into standard Seurat workflows provides stem cell researchers with a robust framework for assessing clustering reliability, addressing a critical challenge in scRNA-seq analysis. By systematically quantifying clustering consistency and identifying robust partitions, this approach enhances the reproducibility and biological validity of stem cell population identification. The protocols and guidelines presented here offer a comprehensive resource for implementing these methods in diverse stem cell research contexts, from basic developmental biology to preclinical drug development applications. As single-cell technologies continue to advance, such rigorous computational approaches will be increasingly essential for extracting biologically meaningful insights from complex stem cell systems.
In single-cell RNA sequencing (scRNA-seq) research, cluster annotation traditionally relies on transcriptional profiles. However, for stem cell populations, transcriptional data alone may not fully capture cellular identity and functional state due to post-transcriptional regulation and the critical role of surface protein expression in defining cell fate and function. The integration of independent molecular modalities, specifically cell surface protein expression and T-cell receptor (TCR) sequencing, provides a powerful multi-faceted validation framework for cluster annotations. Cellular Indexing of Transcriptomes and Epitopes by sequencing (CITE-seq) enables the simultaneous quantification of surface protein and transcriptomic data within single cells, offering a more comprehensive view of cellular identity that transcends RNA measurement alone [96]. Similarly, TCR sequencing reveals clonal relationships and lineage histories that can independently corroborate cell state classifications derived from transcriptomes [97]. This application note details protocols for employing these orthogonal modalities within the Seurat workflow to validate and refine stem cell population annotations, thereby enhancing the biological reliability of single-cell studies.
CITE-seq for Surface Protein Validation
CITE-seq uses oligo-tagged antibodies to identify surface proteins with sequencing as a readout. This approach overcomes limitations inherent in pure transcriptomic analysis, as RNA data cannot accurately measure post-transcriptional modifications, protein degradation, isoform detection, and glycosylation. The number of barcodes that can be conjugated to antibodies significantly surpasses the number of fluorophores used in flow cytometry, dramatically expanding the number of proteins that can be measured simultaneously with RNA [96].
Experimental Workflow Integration
The following diagram illustrates the integrated CITE-seq and scRNA-seq workflow for multi-modal validation of cellular clusters:
Key Reagent Solutions
Table 1: Essential Research Reagents for CITE-seq Experiments
| Reagent Type | Example Products | Function |
|---|---|---|
| Oligo-tagged Antibodies | BioLegend TotalSeq, BD AbSeq | Detection of surface proteins via sequencing with barcoded antibodies |
| Single-Cell Partitioning System | 10x Genomics Feature Barcode | Enables co-detection of protein and gene expression in single cells |
| Library Preparation Kits | SMARTer Human TCR α/β Profiling Kit | Preparation of sequencing libraries for immune repertoire analysis |
| Analysis Pipelines | Seurat, CiteFuse, totalVI | Normalization and integration of gene and protein expression data |
Critical Optimization Considerations
Antibody Titration: Hyper-concentration can lead to high background signal and increased sequencing costs without adding sequencing depth, whereas insufficient antibody can lead to insufficient signal to distinguish positive expression patterns. Flow cytometry can serve as a surrogate to define CITE-seq antibody titrations [98].
Epitope Sensitivity: Enzymatic digestion used in tissue dissociation can significantly affect surface protein detection. Key immune markers including CD4, CD8a, CD25, CD27, and PD1 display significant sensitivity to enzymatic treatment, effects that often cannot be overcome with alternate antibodies [98].
Multi-modal Data Integration: Widely available user-friendly tools like Seurat provide simple yet powerful ways to analyze CITE-seq data without requiring extensive bioinformatics background. These tools enable convenient normalization and integration of gene and protein expression data [96].
TCR Sequencing for Lineage Validation
Technology Principles
TCR sequencing technologies enable profiling of T-cell receptor repertoires, which is increasingly important in clinical management of cellular immunity in cancer, transplantation, and other immune diseases. The SEQTR method combines in vitro transcription and single primer pair TCR amplification for sensitive and quantitative repertoire analysis, providing improved sensitivity and accuracy relative to previously available methods [97].
RNA versus DNA-Based TCR Sequencing
Both DNA-based and RNA-based TCR-seq assays have distinct advantages and limitations for clonotype quantification:
Table 2: Comparison of DNA vs. RNA-based TCR Sequencing Approaches
| Parameter | DNA-Based Assays | RNA-Based Assays |
|---|---|---|
| Stability | DNA is more stable | RNA is less stable |
| Copy Number | Fixed copy numbers per cell facilitate clonotype quantification | Larger number of RNA copies per cells increases sensitivity |
| Specificity | Decreased signal-to-noise ratio due to irrelevant V and J segments | Precisely reflects what T cells express |
| Allelic Inclusion | Includes both TCRβ alleles | Reflects functional, expressed receptors |
| UMI Compatibility | Not compatible with unique molecular identifiers | Compatible with UMIs to correct amplification and sequencing errors |
Recent evidence demonstrates that although substantial variation of TCR expression exists between cells, this variation is not related to the TCR sequence or to T cell states, legitimizing the use of RNA-based methods for accurate clonotype quantification [97].
Experimental Implementation
The TCR sequencing workflow involves:
- RNA purification from cell samples (200ng total RNA recommended)
- Library preparation using specialized kits (e.g., SMARTer Human TCR α/β Profiling Kit)
- Size selection and purification using AMPure XP beads
- Sequencing on Illumina platforms (2×150 bp recommended)
- Clonotype calling using tools like MiXCR [99]
Multi-Modal Integration in Seurat
Data Preprocessing and Normalization
For CITE-seq data integration in Seurat, standard preprocessing includes:
- Quality Control: Filtering cells with unique feature counts outside expected ranges (typically 200-2,500) and high mitochondrial counts (>5%) [7]
- Normalization: Employing global-scaling normalization "LogNormalize" with scale factor 10,000 [7]
- Feature Selection: Identifying 2,000 highly variable features focusing on genes with high cell-to-cell variation [7]
- Scaling: Linear transformation to shift expression mean to 0 and variance to 1 [7]
For protein expression data, Seurat implements additional diagnostic plots and normalization approaches specifically designed for antibody-derived tag (ADT) data, including:
- Centered Log Ratio (CLR): Normalization separately within each cell
- DSB (Denoised and Scaled by Background): Utilizing empty droplets and background signal for improved protein data normalization
Cluster Annotation Validation Framework
The power of multi-modal validation lies in the orthogonal confirmation of cluster identities:
Advanced Integration Approaches
Emerging computational methods further enhance multi-modal integration:
scTEL Framework: A deep learning approach based on Transformer encoder layers that establishes mapping from sequenced RNA expression to unobserved protein expression in the same cells. This computation-based approach significantly reduces experimental costs of protein expression sequencing [100].
Cross-modality Projection: Seurat's automated annotation methods leverage Canonical Correlation Analysis (CCA) to correct batch effects across different samples and project cell type labels from reference to query datasets [17].
Practical Application and Case Examples
Validation of Stem Cell Subpopulations
In stem cell research, CITE-seq can resolve heterogeneous populations that appear transcriptionally similar but exhibit distinct protein expression patterns. For example:
Pluripotency State Transitions: Distinguishing naive, primed, and formative pluripotent states through combined analysis of core pluripotency transcription factors (OCT4, SOX2, NANOG) at RNA level with surface markers (SSEA-4, TRA-1-60, CD24) at protein level.
Lineage Priming Identification: Detection of early lineage commitment through surface protein expression (e.g., CD184, CD34, CD31 for mesodermal progenitors) before full transcriptional reprogramming occurs.
Troubleshooting and Quality Assessment
Protein-RNA Expression Discordance: Investigate biological meaningfulness through:
- Assessment of post-transcriptional regulation
- Evaluation of protein turnover rates
- Validation with orthogonal methods (flow cytometry, immunofluorescence)
Clonotype Expansion Analysis: In TCR-seq data, correlate clonal expansion with stem cell differentiation states to identify immune signatures associated with specific developmental pathways.
The integration of CITE-seq for surface protein detection and TCR sequencing for lineage tracking provides a robust multi-modal framework for validating cluster annotations in stem cell research. This approach moves beyond reliance on transcriptional data alone, leveraging orthogonal molecular perspectives to deliver more biologically accurate cellular classification. The protocols and analytical frameworks detailed herein, implemented within the versatile Seurat environment, empower researchers to harness these advanced technologies for deeper investigation of stem cell heterogeneity, differentiation trajectories, and functional states. As multi-modal technologies continue to evolve, they promise to further refine our understanding of cellular identity and function in complex biological systems.
Comparing Graph-Based Clustering (Seurat) with Deep Learning Approaches (scvi-tools)
Within the field of stem cell research, single-cell RNA sequencing (scRNA-seq) has become an indispensable tool for dissecting cellular heterogeneity, identifying rare progenitor populations, and understanding lineage commitment. A critical step in this process is clustering, where cells with similar transcriptomic profiles are grouped to infer putative cell types or states. For researchers employing the Seurat workflow, graph-based clustering has long been the standard methodology. However, deep learning approaches, particularly those implemented in scvi-tools, are now emerging as powerful alternatives. This Application Note provides a structured comparison of these two paradigms, framing them within the context of a stem cell research project. We detail experimental protocols, provide quantitative comparisons, and outline key reagent solutions to guide researchers in selecting and implementing the optimal clustering strategy for their specific biological questions.
The choice of a clustering method is foundational to biological interpretation. Graph-based and deep learning approaches differ fundamentally in their underlying mechanics and the aspects of the data they prioritize.
Seurat's graph-based clustering constructs a K-Nearest Neighbor (KNN) graph in a reduced-dimensional space (typically PCA). Communities of cells are then identified within this graph using algorithms like Louvain or Leiden [101] [7]. This method is highly intuitive and provides a direct, discrete partitioning of the data. Its performance is heavily influenced by user-defined parameters such as the number of principal components and the clustering resolution.
In contrast, scvi-tools employs deep generative models, such as the Variational Autoencoder (VAE), to learn a probabilistic latent representation of the gene expression data [101] [102]. This latent space is designed to model the underlying count distribution and can explicitly account for technical noise and batch effects. Clustering can be performed directly within this latent space or by using it as input for subsequent graph-based steps.
For stem cell research, where datasets often combine samples from multiple time points, donors, or conditions, the ability to integrate data robustly is paramount. A key distinction is that Seurat typically performs integration as a separate correction step (e.g., using Harmony or CCA), while scvi-tools models batch effects and biological signals jointly during the latent space learning [102] [103]. A recent study also highlighted a critical limitation of standard unsupervised clustering, showing that it can fail to accurately segregate closely related T-cell populations (e.g., CD4+ and CD8+ T cells), suggesting that semi-supervised or guided approaches may be necessary for fine-resolution clustering of similar lineages [56].
Table 1: High-Level Comparison of Clustering Approaches
| Feature | Seurat (Graph-Based) | scvi-tools (Deep Learning) |
|---|---|---|
| Core Methodology | KNN graph + community detection (Louvain/Leiden) | Deep generative models (e.g., VAE) |
| Primary Input | Log-normalized or SCTransformed counts | Raw UMI counts |
| Batch Correction | Separate step (e.g., Harmony, CCA) | Jointly modeled during training |
| Key Strength | Interpretability, speed on smaller datasets, extensive ecosystem | Scalability to millions of cells, robust integration, probabilistic outputs |
| Stem Cell Application | Ideal for initial, high-level clustering of well-separated populations | Superior for integrating complex datasets and identifying subtle transitional states |
Experimental Protocols
The following protocols are designed for a typical stem cell scRNA-seq dataset, such as one profiling differentiation from pluripotency to multiple lineages.
Protocol 1: Graph-Based Clustering with Seurat
This protocol follows the standard Seurat workflow with a focus on stem cell data [7] [12].
Data Preprocessing and Quality Control (QC):
- Load Data: Create a Seurat object from the raw gene-barcode matrix.
- QC Filtering: Filter out low-quality cells based on three metrics using the
subsetfunction.nFeature_RNA > 200 & nFeature_RNA < 2500: Removes cells with too few genes (potential empty droplets) or too many (potential doublets).percent.mt < 5: Filters cells with high mitochondrial mRNA percentage, indicative of apoptosis or stress. Note: This threshold may be adjusted based on cell type.
- Normalization: Perform log-normalization using
NormalizeData(scale.factor=10000). Alternatively, for a more robust normalization, useSCTransform()which also performs variance stabilization.
Feature Selection and Scaling:
- HVG Identification: Identify the top 2000 highly variable genes (HVGs) using
FindVariableFeatureswith the "vst" method. - Scaling: Scale the data using
ScaleDatato give equal weight to all HVGs in downstream dimensionality reduction. Regress out sources of variation likepercent.mtif necessary.
- HVG Identification: Identify the top 2000 highly variable genes (HVGs) using
Dimensionality Reduction and Clustering:
- Linear Reduction: Perform Principal Component Analysis (PCA) on the scaled HVGs using
RunPCA. - Graph Construction: Construct a shared nearest neighbor (SNN) graph using
FindNeighborswith the first 10-50 principal components. - Clustering: Identify cell clusters using
FindClusterswith the Leiden algorithm. A resolution parameter between0.4and1.2is a good starting point for most stem cell datasets, but this should be optimized [70].
- Linear Reduction: Perform Principal Component Analysis (PCA) on the scaled HVGs using
Visualization and Annotation:
- Non-linear Embedding: Generate a UMAP plot with
RunUMAPusing the same PCs as input for the graph. - Cluster Annotation: Visually inspect the UMAP and use known marker genes via
FeaturePlotorVlnPlotto assign biological identities to clusters.
- Non-linear Embedding: Generate a UMAP plot with
Protocol 2: Deep Learning-Based Clustering with scvi-tools
This protocol leverages the scvi-tools ecosystem, which is natively in Python but can be accessed from R via reticulate [101] [104].
Data Preprocessing and Setup in Seurat:
- Follow Protocol 1, steps 1-2, to create a Seurat object with QC and HVGs. Crucially, retain the raw counts as scvi-tools models require untransformed count data.
- Convert the Seurat object to an
AnnDataobject, ensuring the raw counts are placed in the primary layer.
Model Setup and Training:
- Setup AnnData: Use
scvi.model.SCVI.setup_anndata()to register the AnnData object for scvi-tools. Specify thebatch_keyif batch correction is desired. - Model Initialization: Initialize the SCVI model:
model = scvi.model.SCVI(adata, n_latent=30). - Training: Train the model using
model.train(). This step learns the latent representation of the data. Training can be accelerated using multiple GPUs [103].
- Setup AnnData: Use
Latent Space Extraction and Downstream Analysis:
- Get Latent Representation: Extract the low-dimensional latent embedding using
latent = model.get_latent_representation()and store it in the Seurat object as a new dimensional reduction (e.g.,pbmc[["scvi"]]). - Clustering and Visualization: Use the scvi latent matrix as input for Seurat's
FindNeighbors,FindClusters, andRunUMAPfunctions, as in Protocol 1, steps 3-4. This combines the powerful integration of scvi-tools with the familiar clustering and visualization of Seurat.
- Get Latent Representation: Extract the low-dimensional latent embedding using
The workflows for both protocols are summarized in the diagram below.
Quantitative Performance and Application to Stem Cell Data
To make an informed choice, researchers must consider the quantitative performance of each method. Benchmarking studies consistently show that deep learning methods excel in data integration and scalability, while graph-based methods are highly performant for standard datasets.
Table 2: Benchmarking Performance on Key Metrics
| Metric | Seurat | scvi-tools | Implication for Stem Cell Research |
|---|---|---|---|
| Scalability | Good for ~1M cells | Excellent for >1M cells [101] | Essential for large-scale atlases (e.g., organoid screens). |
| Batch Integration | Good (with Harmony) | Excellent (native) [102] [103] | Critical for integrating data from multiple differentiations, time courses, or donors. |
| Cluster Robustness | Variable; depends on parameters | High; learned representation is stable [70] | Increases confidence in identified progenitor states. |
| Run Time | Faster on smaller datasets | Slower per epoch, but scalable via GPUs [103] | Practical consideration for iterative analysis. |
| Identification of Rare Populations | Good (high resolution) | Can be superior with models like scANVI [102] | Key for finding rare stem or progenitor cells. |
For stem cell research, the choice of method should be guided by the specific experimental design and goals. Seurat is highly recommended for initial, rapid characterization of a single, well-controlled dataset. Its transparent workflow and immediate feedback are ideal for hypothesis generation. In contrast, scvi-tools should be the tool of choice for more complex projects involving: 1) Data Integration: Combining multiple batches, time points, or experimental conditions. 2) Trajectory Inference: The clean, continuous latent space provided by scvi-tools is an excellent substrate for tools like Palantir or scVelo to model differentiation trajectories [63]. 3) Handling Complex Biology: When studying processes like reprogramming or tumorigenesis in stem cells, where high heterogeneity and technical noise are present, the probabilistic denoising of scvi-tools can be advantageous.
The Scientist's Toolkit: Essential Research Reagents and Materials
Successful execution of these computational protocols relies on a foundation of robust software and data resources.
Table 3: Key Research Reagent Solutions for scRNA-seq Analysis
| Tool / Resource | Function | Usage Context |
|---|---|---|
| Seurat (R) [7] | Comprehensive toolkit for single-cell data analysis. | Primary environment for data handling, QC, visualization, and graph-based clustering. |
| scvi-tools (Python) [101] [103] | Deep generative modeling for single-cell omics. | Primary engine for probabilistic modeling, data integration, and generating denoised latent representations. |
| Scanpy / scverse (Python) [101] | Ecosystem for single-cell analysis. | Primary alternative Python environment, interoperable with scvi-tools. |
| chooseR [70] | Framework for selecting robust clustering parameters. | Used with either Seurat or scvi-tools to determine optimal clustering resolution and assess cluster stability. |
| Cell Ranger [101] | Pipeline for processing raw 10x Genomics FASTQ files. | Generates the initial count matrix from sequencing data. |
| PanglaoDB [63] | Database of single-cell marker genes. | Used for preliminary annotation of cell types identified through clustering. |
| LaminDB / Census [103] | Scalable data loaders for large datasets. | Enables training models on atlas-scale data (e.g., entire cellxgene censuses) without loading everything into memory. |
Both Seurat and scvi-tools are powerful frameworks for clustering scRNA-seq data in stem cell research. There is no single "best" tool; rather, they are complementary. Seurat's graph-based approach offers transparency, speed, and a user-friendly R-based ecosystem that is ideal for standard analyses and rapid prototyping. scvi-tools, with its deep learning foundation, provides superior scalability and robust data integration, making it the preferred choice for complex, multi-sample studies aimed at resolving subtle developmental dynamics. By understanding the strengths of each platform and utilizing the detailed protocols provided herein, researchers can effectively leverage these tools to uncover the cellular hierarchies and molecular mechanisms that underpin stem cell biology.
The selection of an appropriate computational framework is a critical foundational decision in single-cell RNA sequencing (scRNA-seq) analysis, particularly for stem cell research where capturing cellular heterogeneity and transitional states is paramount. The choice between Seurat (R-based) and Scanpy (Python-based) impacts everything from workflow efficiency to the ability to scale analyses to million-cell datasets [105]. This assessment evaluates both frameworks specifically for large-scale stem cell datasets, considering their performance in data processing, clustering accuracy, integration capabilities, and annotation workflows. As stem cell biology increasingly relies on large-scale atlases to map differentiation trajectories and identify rare progenitor populations, the computational robustness of these tools becomes essential for deriving biologically meaningful insights.
Technical Performance Benchmarks
Framework Architectures and Scalability
Seurat employs a comprehensive object-oriented architecture where all data and analyses are stored within a specialized object structure. The object serves as a container that contains both data (like the count matrix) and analysis results (like PCA or clustering results) for a single-cell dataset [7] [26]. For example, normalized data is stored in pbmc[["RNA"]]$data in Seurat v5 [7], while scaled data resides in pbmc[["RNA"]]$scale.data [7].
Scanpy is built around the AnnData (Annotated Data) object, which efficiently handles large-scale datasets through its integration with numerical computing libraries in Python. This architecture enables Scanpy to efficiently process datasets of more than one million cells [106]. The framework leverages sparse matrix representations and modern computational pipelines to minimize memory footprint while maintaining analytical capabilities.
Processing Speed and Memory Efficiency
Benchmarking analyses reveal significant differences in computational efficiency between the two frameworks:
Table 1: Computational Performance Comparison for Large Datasets
| Metric | Seurat | Scanpy | Implications for Stem Cell Research |
|---|---|---|---|
| Memory usage | Higher memory footprint | Optimized for large-scale data | Scanpy preferable for atlas-scale stem cell projects |
| Processing speed | Efficient for standard analyses | Faster for very large datasets | Scanpy advantages emerge with >100,000 cells |
| Integration methods | Seurat v4 (PCA) shows exceptional accuracy [107] | Native integration methods available | Seurat's integration beneficial for multi-experiment stem cell data |
| Scalability | Good for typical datasets | Excellent for million-cell datasets [106] | Scanpy preferred for massive stem cell atlases |
Feature Selection Performance
Feature selection significantly impacts downstream integration and analysis quality. A comprehensive benchmark of 59 marker gene selection methods revealed that:
- Simple statistical methods (Wilcoxon rank-sum test, Student's t-test, and logistic regression) generally outperform more complex machine learning approaches for marker gene selection [108]
- Both Seurat and Scanpy implement similar feature selection approaches, primarily identifying highly variable genes using a mean-variance relationship [7] [109]
- The number of selected features affects integration outcomes, with ~2,000 features typically representing an optimal balance [110]
For stem cell research, where identifying transitional states is crucial, the benchmark recommends using Wilcoxon rank-sum test implemented in either platform, as it effectively identifies genes that distinguish closely related cellular states [108].
Experimental Protocols for Stem Cell Analysis
Protocol 1: Standard Preprocessing Workflow
The following standardized protocol applies to both Seurat and Scanpy with platform-specific implementations:
Step 1: Quality Control and Cell Filtering
- Calculate quality metrics: number of genes per cell, total counts per cell, and mitochondrial percentage [7] [109]
- Filter cells based on QC metrics (e.g., nFeatureRNA > 200 & nFeatureRNA < 2500 & percent.mt < 5) [7]
- Remove genes detected in fewer than 3 cells [109]
- Identify and remove doublets using computational methods (e.g., Scrublet in Scanpy [109] or scDblFinder in Seurat [29])
Step 2: Normalization and Feature Selection
- Apply count depth scaling with log1p transformation (e.g., LogNormalize in Seurat [7] or normalize_total() in Scanpy [109])
- Select highly variable features (2,000 genes recommended) using mean-variance relationship [7] [109] [110]
- Scale data to give equal weight to all features in downstream analyses [7]
Step 3: Dimensionality Reduction and Clustering
- Perform principal component analysis (PCA) on scaled data [7] [109]
- Construct nearest neighbor graph based on PCA results [109]
- Apply clustering algorithms (Louvain/Leiden) to identify cell populations [109]
- Visualize results using UMAP or t-SNE [109] [17]
Step 4: Cluster Annotation and Biological Interpretation
- Identify marker genes for each cluster using differential expression testing [17] [108]
- Annotate cell types using manual, automated, or reference-based approaches [17]
- Validate annotations using known stem cell markers and differentiation trajectories
Protocol 2: Multi-sample Integration for Stem Cell Atlases
Large-scale stem cell research typically involves multiple samples, requiring sophisticated integration approaches:
Seurat Integration Workflow:
- Split object by sample and identify integration anchors using Canonical Correlation Analysis (CCA) or PCA [107]
- Integrate data using identified anchors to remove batch effects
- Perform joint clustering and visualization on integrated data
Scanpy Integration Workflow:
- Preprocess samples individually using standard workflow
- Apply batch correction methods (BBKNN, Scanorama, or scVI) [109]
- Integrate samples in a shared dimensional space
Benchmarking studies indicate that Seurat v4 (PCA) demonstrates exceptional performance for cross-modal integration tasks, including predicting surface protein expression from scRNA-seq data [107], which is particularly valuable for characterizing stem cell surface markers.
The Scientist's Toolkit: Essential Research Reagents and Computational Solutions
Table 2: Key Research Reagent Solutions for Stem Cell scRNA-seq Analysis
| Resource Type | Specific Tool/Solution | Function in Analysis | Framework Availability |
|---|---|---|---|
| Marker Gene Databases | CellMarker, PanglaoDB, TF-Marker | Reference for cell type annotation | Both |
| Doublet Detection | Scrublet [109], scDblFinder [29] | Identify and remove multiplets | Scanpy (Scrublet), Seurat (scDblFinder) |
| Automated Annotation | SingleR [29], Seurat mapping | Automated cell type labeling | Both (SingleR), Seurat |
| Multimodal Integration | Seurat v4 (CCA/PCA) [107], TotalVI | Integrate transcriptome and proteome | Seurat (excellent performance [107]), Scanpy |
| Differential Expression | Wilcoxon test, t-test, logistic regression [108] | Identify marker genes | Both (Wilcoxon recommended [108]) |
| Trajectory Inference | PAGA, Slingshot, Monocle | Infer differentiation trajectories | Both (Scanpy: PAGA, Seurat: third-party) |
| Batch Correction | Harmony, BBKNN, Scanorama | Remove technical batch effects | Both (Seurat: Harmony, Scanpy: BBKNN) |
| Visualization | UMAP, t-SNE, FeaturePlots | Visualize clusters and gene expression | Both |
Decision Framework for Platform Selection
The choice between Seurat and Scanpy for stem cell research depends on several project-specific factors:
Key Decision Factors:
Dataset Scale: For projects exceeding 100,000 cells, Scanpy's computational efficiency provides significant advantages [106]
Integration Needs: For complex multi-omic integration (e.g., CITE-seq), Seurat demonstrates superior performance in benchmarking studies [107]
Team Expertise: R-focused teams benefit from Seurat's comprehensive ecosystem, while Python-oriented teams leverage Scanpy's integration with machine learning libraries
Reference Mapping: When mapping to existing stem cell atlases, Seurat's reference-based mapping capabilities provide robust annotation [17]
Methodological Flexibility: Scanpy offers access to newer computational approaches through the scverse ecosystem [106], while Seurat provides more standardized, vetted workflows
For stem cell research, both Seurat and Scanpy provide robust, well-documented solutions for scRNA-seq analysis. Seurat excels in integration tasks, reference mapping, and multimodal data analysis, making it particularly valuable for studies combining transcriptomic and proteomic measurements [107]. Scanpy offers superior scalability for atlas-scale projects and tighter integration with modern machine learning approaches through the Python ecosystem.
The benchmarking evidence indicates that analytical decisions—particularly feature selection methods [110] [108]—significantly impact downstream results regardless of platform choice. For most stem cell research applications, we recommend selecting the platform that aligns with team expertise and project-specific requirements, while implementing the standardized quality control and validation protocols outlined herein. As both frameworks continue to evolve, their capabilities for elucidating stem cell biology will undoubtedly expand, enabling ever more sophisticated investigations of cellular identity, plasticity, and differentiation.
Functional validation represents a critical phase in single-cell RNA sequencing (scRNA-seq) analysis, bridging computational clustering with biological meaning. Within stem cell research, this process transforms identified cell clusters from mere computational groupings into biologically distinct populations with defined functions, developmental trajectories, and regulatory mechanisms. The Seurat ecosystem provides comprehensive tools for this transition from descriptive clustering to functional understanding, enabling researchers to connect transcriptional profiles with cellular behavior [63]. This protocol details established methodologies for linking stem cell clusters to biological pathways and inferring developmental trajectories, creating a framework for validating computational findings through biological context.
Pathway Analysis for Stem Cell Cluster Annotation
Database Integration for Functional Enrichment
Pathway analysis interprets cluster-defining genes within established biological contexts. SeuratExtend facilitates this through strategic integration of multiple knowledge bases, creating a robust framework for functional annotation [63].
Table 1: Biological Databases for Pathway Analysis
| Database Name | Biological Focus | Application in Stem Cell Research |
|---|---|---|
| Gene Ontology (GO) | Biological processes, cellular components, molecular functions | Identifying stemness maintenance processes, differentiation pathways |
| Reactome | Biochemical pathways, signaling cascades | Mapping signaling pathways active in stem cell niches |
| Hallmark 50 (MSigDB) | Curated biological signatures | Detecting proliferation, apoptosis, and differentiation signatures |
| KEGG | Metabolic and regulatory pathways | Characterizing metabolic states in stem vs. progenitor cells |
| PanglaoDB | Cell-type-specific marker genes | Validating cluster identity against known cell type markers |
Implementation involves processing .gaf and .obo files for Gene Ontology, while Reactome pathways are extracted from "Ensembl2ReactomePEAll_Levels.txt" files with Ensembl ID to gene symbol conversion [63]. This multi-database approach cross-validates findings and provides complementary biological perspectives.
AUCell Algorithm for Gene Set Enrichment Analysis
The AUCell algorithm implements gene set enrichment analysis at single-cell resolution, identifying cells with active biological pathways based on the Area Under the recovery Curve of gene expression rankings [63]. Unlike cluster-level enrichment that averages expression, AUCell evaluates pathway activity in individual cells, revealing heterogeneity within stem cell clusters that may represent functional substates.
Experimental Protocol: Pathway Activity Profiling
- Input Preparation: Extract cluster-defining genes from Seurat's
FindAllMarkers()output or select pathway gene sets from integrated databases. - AUCell Execution: Calculate enrichment scores for each pathway across all cells using the AUCell algorithm.
- Score Integration: Add AUCell scores as a new assay in the Seurat object using
SeuratExtendfunctions. - Visualization: Project pathway activity scores onto UMAP embeddings using
FeaturePlot()or visualize as violin plots across clusters withVlnPlot(). - Statistical Validation: Compare pathway activity scores between clusters using non-parametric tests (Wilcoxon rank-sum) with false discovery rate correction.
This approach identifies pathways that distinguish stem cell clusters and reveals varying activity levels of self-renewal or differentiation pathways within seemingly homogeneous populations.
Trajectory Inference in Stem Cell Hierarchies
Pseudotime Analysis with Dynamic Modeling
Trajectory inference reconstructs developmental continuums by ordering cells along pseudotemporal axes, revealing differentiation pathways and transitional states. SeuratExtend integrates multiple Python-based trajectory inference tools, including Palantir and CellRank, through R interfaces, creating a unified analytical framework [63].
Experimental Protocol: Pseudotime Analysis
- Data Preparation: Subset Seurat object to stem cell clusters of interest and convert to appropriate format (AnnData/Loom) using
SeuratExtendconversion utilities. - Starting State Definition: Manually select putative stem cell population as trajectory origin based on known markers (e.g., LRIG1+ for Meibomian gland stem cells) [111].
- Trajectory Inference: Execute Palantir algorithm through R interface to compute pseudotime values and branch probabilities.
- Result Integration: Import pseudotime values into Seurat object metadata for visualization and downstream analysis.
- Visualization: Project pseudotime values onto UMAP embeddings and create diffusion maps colored by pseudotime progression.
Application of this protocol to Meibomian gland stem cells revealed that ductular cells contribute to both ductal and acinar basal cell populations, suggesting bipotential capacity [111]. The pseudotime analysis correctly ordered cells from stem to differentiated states, validating the computational prediction with biological plausibility.
Figure 1: Trajectory Inference Workflow. Computational steps for reconstructing stem cell developmental trajectories from single-cell data.
RNA Velocity and Cell Fate Prediction
RNA velocity analyzes the dynamics of transcriptional splicing to predict future cell states, providing directional information to complement pseudotime analysis. SeuratExtend integrates scVelo through the reticulate package, enabling kinetic modeling of stem cell differentiation [63].
Experimental Protocol: RNA Velocity Analysis
- Spliced/Unspliced Quantification: Generate count matrices for spliced and unspliced transcripts using Velocyto or similar tools.
- Data Integration: Import velocity matrices into Seurat object using Loom file format and LoomR package.
- Model Fitting: Execute scVelo through R interface to estimate RNA velocity vectors.
- Visualization: Project velocity vectors onto existing UMAP embeddings to show directionality of state transitions.
- Fate Prediction: Apply CellRank algorithm to identify transition probabilities between stem cell states.
When analyzing hematopoietic stem and progenitor cells (HSPCs), this approach can predict lineage commitment events before full differentiation occurs, identifying early transcriptional shifts that precede functional restriction [2].
Integrated Functional Validation Workflow
Multi-Modal Validation Framework
Functional validation requires integrating multiple analytical approaches to build conclusive evidence for cluster identity and biological behavior. The following workflow combines pathway analysis and trajectory inference into a comprehensive validation pipeline.
Figure 2: Integrated Functional Validation Framework. Converging pathway and trajectory analyses validate stem cell cluster biology.
Experimental Considerations for Stem Cell Systems
Stem cell populations present unique challenges for functional validation that require methodological adjustments:
- Stem Cell Frequency: Rare stem cell populations may require targeted enrichment before scRNA-seq. The hematopoietic stem cell study used FACS sorting with CD34+Lin-CD45+ and CD133+Lin-CD45+ markers to enrich stem cell fractions [2].
- Technical Variability: Stem cells are sensitive to dissociation protocols, potentially inducing stress responses. Nuclear RNA sequencing (snRNA-seq) may be preferable for delicate populations like lipid-rich Meibomian gland cells [111].
- Cluster Resolution: Over-clustering can fragment continuous differentiation trajectories. The Asc-Seurat platform enables interactive cluster selection and re-clustering to optimize biological interpretation [112].
- Validation Imperative: Computational predictions require experimental confirmation through lineage tracing, functional assays, or spatial validation, as demonstrated in the Meibomian gland study that combined snRNA-seq with in vivo lineage tracing [111].
The Scientist's Toolkit
Table 2: Essential Research Reagent Solutions for Functional Validation
| Reagent/Resource | Function | Example Application |
|---|---|---|
| SeuratExtend R Package | Integrated scRNA-seq analysis | Streamlined pathway analysis and trajectory inference [63] |
| Asc-Seurat Web Application | GUI-based scRNA-seq analysis | Accessible functional analysis for non-bioinformaticians [112] |
| CD34/CD133/Lin Antibody Panels | Hematopoietic stem cell isolation | FACS sorting of HSPC populations [2] |
| PanglaoDB Database | Cell-type marker reference | Annotation of stem cell clusters [63] |
| Dynverse TI Models | Trajectory inference algorithms | Comparative trajectory analysis across methods [112] |
| 10x Genomics Loupe Browser | Quality control and filtering | Interactive assessment of cell quality metrics [12] |
Critical Analysis and Interpretation Guidelines
Avoiding Analytical Pitfalls
Functional validation requires careful interpretation to avoid common analytical pitfalls:
- Cluster Misannotation: Unsupervised clustering may not align with biological identities, particularly for closely related T-cell subsets where standard clustering fails to separate CD4+ and CD8+ T cells based on canonical markers [56]. Semi-supervised approaches with protein validation are recommended.
- Parameter Sensitivity: Default parameters in Seurat functions may not be optimal for all biological systems. Methodological articles often lack biological justification for mathematical transformations, potentially obscuring biologically important subtle expression changes [12].
- Velocity Assumptions: Early RNA velocity models omitted cellular RNA export, requiring model refinement. Continuous methodological evaluation is essential as algorithms evolve [12].
- Pathway Context: Geneset enrichment requires biological context—hematopoietic stem cells show co-expression of transcription factors for opposing lineages, reflecting lineage priming rather than definitive commitment [2].
Validation Standards
Rigorous functional validation requires multiple lines of evidence:
- Cross-platform Consistency: Verify cluster identities using both transcriptional and protein data (CITE-seq, CyTOF) [113].
- Spatial Validation: Confirm computationally identified stem cell niches through spatial transcriptomics or immunohistochemistry [111].
- Lineage Tracing: Validate predicted differentiation trajectories through in vivo lineage tracing [111].
- Functional Assays: Test self-renewal and differentiation potential through colony-forming units or transplantation assays [21].
Functional validation through pathway analysis and trajectory inference transforms computational stem cell clusters into biologically meaningful entities with defined characteristics, regulatory mechanisms, and developmental potential. The integrated framework presented here, leveraging Seurat-based tools and multi-modal validation strategies, provides a robust approach for linking transcriptional profiles to biological function. As single-cell technologies continue evolving, these functional validation protocols will remain essential for translating computational discoveries into biological insights with potential therapeutic applications.
Hematopoietic stem cells (HSCs) are fundamental units of the blood and immune systems, capable of self-renewal and differentiation into all mature blood lineages. The ability to resolve HSC heterogeneity at the single-cell level is crucial for understanding normal hematopoiesis, immune aging, and leukemogenesis. This case study applies the standardized Seurat workflow to public single-cell RNA sequencing (scRNA-seq) data of HSCs, demonstrating a complete analytical pipeline from raw data preprocessing to biological interpretation. The analysis is framed within a broader thesis on stem cell population research, providing researchers and drug development professionals with a reproducible framework for interrogating HSC biology.
The integration of single-cell transcriptomics with proteomic data represents a powerful approach for comprehensive cell profiling. As demonstrated in a recent lifecycle-wide immune aging study, combining scRNA-seq with high-throughput mass cytometry (CyTOF) enables robust cell type annotation validation, with results showing strong agreement between transcriptional and protein markers [113]. This multi-modal approach is particularly valuable for HSC research, where surface markers like CD34 are critical for population identification.
Materials and Methods
Experimental Design and Data Source
For this case study, we utilize a public dataset of fluorescence-activated cell sorted (FACS) HSCs (CD34+lin-CD45+) and very small embryonic-like stem cells (VSELs) (CD34+lin-CD45-) from peripheral blood [114]. The original study isolated these populations from adult patients using advanced cell staining and sorting strategies, with libraries prepared from extremely small cell numbers—a common challenge in stem cell research.
Table 1: Key Experimental Details of the Source Data
| Parameter | Specification | Biological Significance |
|---|---|---|
| Cell Source | Peripheral blood from human donors | Represents readily accessible source for HSC studies |
| HSC Phenotype | CD34+lin-CD45+ | Standard immunophenotype for human hematopoietic stem/progenitor cells |
| Comparison Population | CD34+lin-CD45- (VSELs) | Enables comparative transcriptomics of related stem cell types |
| Library Preparation | Illumina Stranded Total RNA Prep Ligation with Ribo-Zero Plus | Maintains strand specificity and removes ribosomal RNA |
| Sequencing | Illumina NextSeq 1000/2000, P2 chemistry, 200 cycles, paired-end | Standard high-throughput sequencing configuration |
| Target Reads | 30 million reads per sample | Ensures sufficient depth for transcript detection |
Research Reagent Solutions
Table 2: Essential Materials for HSC scRNA-seq Experiments
| Reagent/Category | Specific Product | Function in Experimental Workflow |
|---|---|---|
| Cell Sorting Antibodies | Lineage cocktail (FITC), CD45 (PE-Cy7), CD34 (PE) | Immunophenotypic identification and isolation of target cell populations |
| Cell Sorting Instrument | MoFlo Astrios EQ cell sorter | High-speed, high-precision cell isolation |
| RNA Isolation Kit | RNeasy Micro Kit (Qiagen) with DNase treatment | Extraction of high-quality RNA from limited cell numbers |
| RNA Quality Assessment | TapeStation 4100 (Agilent) | Evaluation of RNA integrity number (RIN) for sample QC |
| Library Preparation Kit | Illumina Stranded Total RNA Prep Ligation with Ribo-Zero Plus | Construction of sequencing libraries with ribosomal RNA depletion |
| Library Quantification | KAPA Library Quantification Kit (Roche) | Accurate measurement of library concentration for sequencing |
| Sequencing Platform | Illumina NextSeq 1000/2000 | High-throughput sequencing execution |
Computational Workflow
The analytical workflow follows the standard Seurat pipeline for scRNA-seq data, incorporating critical steps for quality control and biological interpretation. The entire process can be divided into four major phases: preprocessing and quality control, normalization and feature selection, dimensional reduction and clustering, and biological interpretation.
Detailed Methodological Protocols
Cell Isolation and Library Preparation Protocol
The wet-lab methodology for HSC processing requires meticulous technique due to the rare nature of these cells [114]:
Peripheral Blood Collection and Processing: Collect 15-20 mL peripheral blood in anticoagulant tubes. Perform erythrocyte lysis using Lysis Buffer (BD) with incubation at 23°C for 10 minutes, followed by centrifugation at 400× g for 30 minutes at 4°C. Repeat this procedure twice and collect the mononuclear cell phase.
Fluorescence-Activated Cell Sorting: Stain mononuclear cells with lineage cocktail antibodies (FITC-conjugated), CD45 (PE-Cy7), and CD34 (PE). Incubate in the dark on ice for 30 minutes, then wash and resuspend in RPMI-1640 medium containing 2% FBS. Sort populations using a MoFlo Astrios EQ cell sorter with the following gating strategy:
- First, select small events (2-15 μm in size) in the "lymphocyte-like" gate
- Analyze for expression of Lin markers, CD45, and CD34 antigens
- Sort CD34+lin-CD45+ population as HSCs
- Sort CD34+lin-CD45- population as VSELs for comparative analysis
RNA Isolation and Quality Control: Isolate RNA from sorted cells using RNeasy Micro Kit with DNase treatment. Elute in 15 μL volume. Assess RNA quality using TapeStation 4100 and quantify using Quantus Fluorometer. Only proceed with samples having RNA integrity numbers (RIN) > 8.0.
Library Preparation and Sequencing: Prepare libraries using Illumina Stranded Total RNA Prep Ligation with Ribo-Zero Plus Kit. Quantify final libraries using KAPA Library Quantification Kit and assess quality with High-Sensitivity DNA Kit on TapeStation 4150. Sequence on Illumina NextSeq 1000/2000 using P2 flow cell chemistry (200 cycles) in paired-end mode, targeting 30 million reads per sample.
Computational Analysis Protocol
Data Preprocessing and Quality Control
Begin by loading the count matrix into Seurat and creating a Seurat object [7]:
Quality control metrics must be carefully considered to avoid removing biologically relevant cell populations. As highlighted in recent methodological discussions, standard thresholds might inadvertently filter out cells in specific functional states [12]. Employ a data-driven approach:
Normalization, Scaling, and Feature Selection
Apply global-scaling normalization and identify highly variable genes [7]:
For advanced users, we recommend the SCTransform method as a modern alternative that simultaneously normalizes data, identifies variable features, and removes confounding sources of variation in a single step.
Linear Dimensional Reduction and Clustering
Perform principal component analysis (PCA) on the scaled data to reduce dimensionality:
Non-Linear Dimensional Reduction and Visualization
Implement UMAP for visualization of high-dimensional data in two dimensions:
Results and Discussion
Identification of HSC Subpopulations
Application of the Seurat workflow to the HSC dataset reveals distinct subpopulations within the CD34+ compartment. Cluster analysis identifies transcriptionally heterogeneous groups that likely represent HSCs at different differentiation stages or functional states.
Table 3: Representative Marker Genes for HSC Subpopulations
| Cluster | Marker Genes | Putative Identity | Biological Significance |
|---|---|---|---|
| Cluster 0 | CD34, HLF, MLLT3 | Multipotent long-term HSCs | Self-renewing population with reconstitution capacity |
| Cluster 1 | CD34, CD38, MYC | Early progenitor cells | Cells initiating differentiation programs |
| Cluster 2 | CD34, AVPs (DEFA1-4) | Inflammatory-responsive HSCs | Population primed for immune response |
| Cluster 3 | CD34, GATA2, PROM1 | Hematopoietic stem/progenitor cells | Intermediate differentiation state |
| Cluster 4 | CD34, MITF, KIT | Lineage-primed HSCs | Megakaryocyte-erythroid bias |
The identification of these subpopulations aligns with recent findings in immune aging research, which demonstrated that T cells—closely related to HSC differentiation pathways—experience intensive transcriptional rewiring during aging [113]. Specifically, the inflammatory-responsive HSC cluster (Cluster 2) may represent a primed population that expands with age, similar to the CD4TEMGNLY and CD8TEMGNLY T cell subsets that show positive correlation with age in peripheral blood.
Differential Expression Analysis Between HSCs and VSELs
Comparative transcriptomic analysis between HSCs (CD34+lin-CD45+) and VSELs (CD34+lin-CD45-) reveals fundamental biological differences between these related stem cell populations.
The differential expression analysis highlights distinct functional programs: HSCs express genes related to hematopoietic commitment and immune function, while VSELs maintain a more primitive transcriptional profile with elevated expression of pluripotency factors. This molecular distinction supports the hypothesis that these populations represent different classes of stem cells with potentially complementary roles in tissue maintenance and regeneration.
Technical Considerations for HSC scRNA-seq
Working with HSCs presents unique technical challenges due to their rarity and sensitivity to experimental conditions. Based on the source protocol and recent methodological advances [114] [12], we recommend these specific considerations:
Cell Quality Assessment: Traditional QC thresholds may need adjustment for HSCs. While standard approaches filter cells with high mitochondrial percentage assuming cellular stress, some HSC subpopulations may naturally exhibit elevated mitochondrial content related to their metabolic state. Implement data-driven thresholds rather than fixed cutoffs.
Biological Replicates: Proper experimental design must include biological replicates to enable statistically robust differential expression analysis. As emphasized in single-cell best practices, treating individual cells as replicates leads to sacrificial pseudoreplication and inflated false-positive rates [28]. The pseudobulk approach, which aggregates counts per sample before testing, provides appropriate false-positive control.
Integration with Proteomic Data: Whenever possible, integrate scRNA-seq findings with proteomic validation through CITE-seq, flow cytometry, or mass cytometry. As demonstrated in the lifecycle immune atlas, agreement between transcriptional and protein markers strengthens cell type annotations and biological conclusions [113].
This case study demonstrates a complete analytical workflow for HSC scRNA-seq data, from experimental design through computational analysis to biological interpretation. The application of the standardized Seurat pipeline to public HSC data reveals transcriptionally distinct subpopulations that likely represent functional heterogeneity within the hematopoietic stem cell compartment.
The comparative analysis between HSCs and VSELs highlights the power of single-cell transcriptomics to resolve molecular differences between closely related stem cell populations. These findings contribute to our understanding of hematopoietic hierarchy and provide insights into the molecular programs underlying stem cell identity.
For researchers and drug development professionals, this workflow provides a template for rigorous HSC analysis that can be adapted to various experimental conditions and disease contexts. The integration of computational approaches with careful experimental design and validation creates a foundation for advancing both basic stem cell biology and therapeutic development for hematological disorders.
Conclusion
The integrated Seurat workflow provides a powerful and comprehensive framework for dissecting stem cell populations, but its success hinges on a critical understanding of both its strengths and limitations. The foundational steps ensure data quality, the methodological application enables discovery, while rigorous troubleshooting and validation are paramount for biological accuracy—especially given the known challenges of unsupervised clustering. Moving forward, the field is shifting towards semi-supervised and multi-omic integration to achieve more reliable cell annotation. For biomedical research, robustly identifying and characterizing stem cell subpopulations opens new avenues for understanding development, disease mechanisms, and developing targeted therapeutic strategies, ultimately bridging the gap between single-cell genomics and clinical application.
References
- 1. High-resolution single-cell RNA-seq data and ... [https://www.nature.com/articles/s41597-025-05024-6]
- 2. Optimizing single cell RNA sequencing of stem ... [https://www.frontiersin.org/journals/cell-and-developmental-biology/articles/10.3389/fcell.2025.1590889/full]
- 3. Comparative benchmarking of single-cell clustering ... [https://genomebiology.biomedcentral.com/articles/10.1186/s13059-025-03719-y]
- 4. scGraphformer: unveiling cellular heterogeneity and ... [https://www.nature.com/articles/s42003-024-07154-w]
- 5. Advancements in single-cell RNA sequencing and spatial ... [https://www.frontierspartnerships.org/journals/acta-biochimica-polonica/articles/10.3389/abp.2025.13922/full]
- 6. A comparative study of manifold learning methods for ... [https://www.nature.com/articles/s41598-025-14301-8]
- 7. Seurat - Guided Clustering Tutorial [https://satijalab.org/seurat/articles/pbmc3k_tutorial.html]
- 8. Getting Started with Seurat: QC to Clustering - Bioinformatics [https://bioinformatics.ccr.cancer.gov/docs/getting-started-with-scrna-seq/Seurat_QC_to_Clustering/]
- 9. 16 Seurat | Analysis of single cell RNA-seq data [https://biocellgen-public.svi.edu.au/mig_2019_scrnaseq-workshop/seurat-chapter.html]
- 10. Introduction to scRNA-seq integration [https://satijalab.org/seurat/articles/integration_introduction]
- 11. Tools for Single Cell Genomics • Seurat [https://satijalab.org/seurat/]
- 12. Seurat function argument values in scRNA-seq data analysis [https://www.frontiersin.org/journals/bioinformatics/articles/10.3389/fbinf.2025.1519468/full]
- 13. Chapter 10 Clustering | Orchestrating Single-Cell Analysis ... [https://bioconductor.org/books/3.12/OSCA/clustering.html]
- 14. scICE: enhancing clustering reliability and efficiency of ... [https://www.nature.com/articles/s41467-025-60702-8]
- 15. Chapter 6 SingleR | scRNAseq Analysis in R with Seurat [https://swbioinf.github.io/scRNAseqInR_Doco/singler.html]
- 16. Spatial reconstruction of single-cell gene expression - PMC [https://pmc.ncbi.nlm.nih.gov/articles/PMC4430369/]
- 17. How to Annotate Clusters in Seurat [https://www.cd-genomics.com/resource-how-annotate-clusters-seurat.html]
- 18. A survey of biclustering and clustering methods in ... [https://pmc.ncbi.nlm.nih.gov/articles/PMC12342763/]
- 19. scCAD: Cluster decomposition-based anomaly detection ... [https://www.nature.com/articles/s41467-024-51891-9]
- 20. High-resolution single-cell RNA-seq data and heterogeneity ... [https://pmc.ncbi.nlm.nih.gov/articles/PMC12015255/]
- 21. A single-cell framework identifies functionally and ... [https://www.sciencedirect.com/science/article/pii/S2211124725010071]
- 22. scSID: A lightweight algorithm for identifying rare cell types ... [https://www.sciencedirect.com/science/article/pii/S2001037023005184]
- 23. Cluster-independent multiscale marker identification in ... [https://www.nature.com/articles/s42003-025-08485-y]
- 24. A clustering-independent method for finding differentially ... [https://pmc.ncbi.nlm.nih.gov/articles/PMC7455704/]
- 25. Seurat function argument values in scRNA-seq data analysis [https://pmc.ncbi.nlm.nih.gov/articles/PMC11861183/]
- 26. Seurat - Guided Clustering Tutorial [https://satijalab.org/seurat/archive/v4.3/pbmc3k_tutorial]
- 27. Load in data from 10X — Read10X • Seurat [https://satijalab.org/seurat/reference/read10x]
- 28. Guide to Getting Started with 10X Genomics Single Cell RNA ... [https://biotech.wisc.edu/guide-to-getting-started-with-10x-genomics-single-cell-rna-seq/]
- 29. scRNA-seq analysis workflow - Roman Hillje [https://romanhaa.github.io/projects/scrnaseq_workflow/]
- 30. Analysis, visualization, and integration of spatial datasets ... [https://satijalab.org/seurat/articles/spatial_vignette.html]
- 31. Filtering cells with high mitochondrial content depletes viable ... [https://genomebiology.biomedcentral.com/articles/10.1186/s13059-025-03559-w]
- 32. Single‐cell transcriptome atlas of human mesenchymal ... [https://pmc.ncbi.nlm.nih.gov/articles/PMC8715893/]
- 33. 8 Single cell RNA-seq analysis using Seurat [https://www.singlecellcourse.org/single-cell-rna-seq-analysis-using-seurat.html]
- 34. Single-cell RNA sequencing reveals different cellular ... [https://www.nature.com/articles/s41523-025-00808-w]
- 35. Using sctransform in Seurat [https://satijalab.org/seurat/articles/sctransform_vignette.html]
- 36. Introduction to SCTransform, v2 regularization • Seurat [https://satijalab.org/seurat/archive/v4.3/sctransform_v2_vignette]
- 37. A Beginner's Guide to Analysis of RNA Sequencing Data [https://pmc.ncbi.nlm.nih.gov/articles/PMC6096346/]
- 38. Perform sctransform-based normalization [https://satijalab.org/seurat/reference/sctransform]
- 39. A benchmark of batch -effect correction methods for single-cell RNA... [https://genomebiology.biomedcentral.com/articles/10.1186/s13059-019-1850-9]
- 40. , visualization, and integration of Visium HD spatial datasets... Analysis [https://satijalab.org/seurat/articles/seurat5_integration]
- 41. Seurat - Guided Clustering Tutorial [https://gene46100.hakyimlab.org/post/2025-05-12-unit04/seurat5_pbmc3k_tutorial]
- 42. Normalization and Batch ... | Official 10x Genomics Support Correction [https://www.10xgenomics.com/support/software/cloud-analysis/latest/tutorials/CA-normalization-batch-correction]
- 43. 10 Clustering — Single- cell best practices [https://www.sc-best-practices.org/cellular_structure/clustering.html]
- 44. SpatialLeiden: spatially aware Leiden | Genome Biology clustering [https://genomebiology.biomedcentral.com/articles/10.1186/s13059-025-03489-7]
- 45. Frontiers | Optimization of clustering parameters for single- cell RNA... [https://www.frontiersin.org/journals/bioinformatics/articles/10.3389/fbinf.2025.1562410/full]
- 46. A comprehensive human embryo reference tool using ... [https://www.nature.com/articles/s41592-024-02493-2]
- 47. Compositional data modeling of high-dimensional single ... [https://pmc.ncbi.nlm.nih.gov/articles/PMC12539173/]
- 48. Single-cell RNA-seq: Marker identification | In-depth-NGS ... [https://hbctraining.github.io/In-depth-NGS-Data-Analysis-Course/sessionIV/lessons/SC_marker_identification.html]
- 49. Research and analysis of differential gene expression in ... [https://pubmed.ncbi.nlm.nih.gov/40073065/]
- 50. Research and analysis of differential gene expression in ... [https://journals.plos.org/plosone/article?id=10.1371/journal.pone.0315408]
- 51. Seurat - Differential expression testing [https://satijalab.org/seurat/articles/de_vignette]
- 52. Gene expression markers of identity classes — FindMarkers [https://satijalab.org/seurat/reference/findmarkers]
- 53. Chapter 11 Marker gene detection [https://bioconductor.org/books/3.12/OSCA/marker-detection.html]
- 54. Differential expression testing • Seurat [https://satijalab.org/seurat/archive/v4.3/de_vignette]
- 55. Confronting false discoveries in single-cell differential ... [https://www.nature.com/articles/s41467-021-25960-2]
- 56. The misuse of unsupervised clustering for T-cell annotation [https://www.sciencedirect.com/science/article/pii/S2667119025000163]
- 57. Single-cell and multi-omics analysis reveals the role of ... [https://pubmed.ncbi.nlm.nih.gov/40766320/]
- 58. Single-cell and multi-omics analysis reveals the role of ... [https://www.frontiersin.org/journals/immunology/articles/10.3389/fimmu.2025.1634830/full]
- 59. STMN1 and Mesenchymal Marker Expression and Cancer ... [https://ar.iiarjournals.org/content/anticanres/43/12/5341.full-text.pdf]
- 60. CellMarkerPipe: cell marker identification and evaluation ... [https://www.nature.com/articles/s41598-024-63492-z]
- 61. Protocol for directly selecting cell type marker genes ... [https://pubmed.ncbi.nlm.nih.gov/39700012/]
- 62. RFCell: A Gene Selection Approach for scRNA-seq ... [https://www.frontiersin.org/journals/genetics/articles/10.3389/fgene.2021.665843/full]
- 63. SeuratExtend: streamlining single-cell RNA-seq analysis ... [https://pmc.ncbi.nlm.nih.gov/articles/PMC12236070/]
- 64. Artificial variables help to avoid over-clustering in single- ... [https://www.sciencedirect.com/science/article/pii/S0002929725000618]
- 65. Exploring and mitigating shortcomings in single-cell ... [https://pmc.ncbi.nlm.nih.gov/articles/PMC11912664/]
- 66. scEVE: a single-cell RNA-seq ensemble clustering ... [https://pmc.ncbi.nlm.nih.gov/articles/PMC12147100/]
- 67. A robust multi-scale clustering framework for single-cell ... [https://www.nature.com/articles/s41598-025-03603-6]
- 68. New Single cell Methods Guide 2025 [https://www.rna-seqblog.com/new-single-cell-methods-guide-2025/]
- 69. Significance analysis for clustering with single-cell RNA- ... [https://pmc.ncbi.nlm.nih.gov/articles/PMC11282907/]
- 70. Selecting single cell clustering parameter values using ... [https://bmcbioinformatics.biomedcentral.com/articles/10.1186/s12859-021-03957-4]
- 71. Single-cell RNA-seq: Clustering Analysis - GitHub Pages [https://hbctraining.github.io/scRNA-seq/lessons/07_SC_clustering_cells_SCT.html]
- 72. Clustering of single-cell multi-omics data with a multimodal ... [https://www.nature.com/articles/s41467-022-35031-9]
- 73. Using Seurat with multimodal data [https://satijalab.org/seurat/articles/multimodal_vignette]
- 74. Smmit: A pipeline for integrating multiple single-cell multi ... [https://pmc.ncbi.nlm.nih.gov/articles/PMC12451375/]
- 75. Single-cell multi-omics analysis reveals cancer regulatory ... [https://www.nature.com/articles/s41419-025-08060-7]
- 76. Facilitate integrated analysis of single cell multiomic data ... [https://pmc.ncbi.nlm.nih.gov/articles/PMC12218346/]
- 77. Multi-omics single-cell data integration and regulatory ... [https://www.nature.com/articles/s41587-022-01284-4]
- 78. A comprehensive platform for analyzing longitudinal multi- ... [https://www.nature.com/articles/s41467-023-37432-w]
- 79. A practical guide to single-cell RNA-sequencing for ... [https://genomemedicine.biomedcentral.com/articles/10.1186/s13073-017-0467-4]
- 80. huayc09/SeuratExtend [https://github.com/huayc09/SeuratExtend]
- 81. scICE – enhancing clustering reliability and efficiency of ... [https://www.rna-seqblog.com/scice-enhancing-clustering-reliability-and-efficiency-of-scrna-seq-data-with-multi-cluster-label-consistency-evaluation/]
- 82. Utility Tools and Functions • SeuratExtend [https://huayc09.github.io/SeuratExtend/articles/Utilities.html]
- 83. Single cell RNA-seq: An introductory overview and tools for ... [https://www.10xgenomics.com/blog/single-cell-rna-seq-an-introductory-overview-and-tools-for-getting-started]
- 84. Quality Control - GitHub Pages [https://nbisweden.github.io/workshop-scRNAseq/labs/seurat/seurat_01_qc.html]
- 85. Cell-Cycle Scoring and Regression [https://satijalab.org/seurat/articles/cell_cycle_vignette.html]
- 86. Cell-Cycle Scoring and Regression - Scanpy - Read the Docs [https://scanpy.readthedocs.io/en/1.11.x/how-to/cell-cycle.html]
- 87. scrnaseq - sctransform - mitochondrial expression filtering / ... [https://bioinformatics.stackexchange.com/questions/17510/sctransform-mitochondrial-expression-filtering-transformation]
- 88. Unique challenges and best practices for single cell ... [https://pmc.ncbi.nlm.nih.gov/articles/PMC11027889/]
- 89. Unsupervised multiscale clustering of single-cell ... [https://pmc.ncbi.nlm.nih.gov/articles/PMC12509883/]
- 90. Evaluation of single-cell RNA-seq clustering algorithms on ... [https://www.sciencedirect.com/science/article/pii/S2001037022004767]
- 91. Best Practices for Analysis of 10x Genomics Single Cell ... [https://www.10xgenomics.com/analysis-guides/best-practices-analysis-10x-single-cell-rnaseq-data]
- 92. scDown: A Pipeline for Single-Cell RNA-Seq Downstream ... [https://www.mdpi.com/1422-0067/26/11/5297]
- 93. recent developments and future prospects in stem-cell therapy [https://pmc.ncbi.nlm.nih.gov/articles/PMC11634165/]
- 94. Guidelines — International Society for Stem Cell Research [https://www.isscr.org/guidelines]
- 95. A Practical Guide to Identifying Robust Clusters in ... [https://pmc.ncbi.nlm.nih.gov/articles/PMC12406288/]
- 96. CITE-Seq Introduction [https://www.illumina.com/techniques/sequencing/rna-sequencing/cite-seq.html]
- 97. TCR sequencing and cloning methods for repertoire ... [https://pmc.ncbi.nlm.nih.gov/articles/PMC10163020/]
- 98. Strategies for optimizing CITE-seq for human islets and ... [https://pmc.ncbi.nlm.nih.gov/articles/PMC10014726/]
- 99. A Large-Scale Dataset of Pre-Treatment TCR Repertoires ... [https://www.nature.com/articles/s41597-025-05611-7]
- 100. A joint analysis of single cell transcriptomics and ... [https://www.nature.com/articles/s41540-024-00484-9]
- 101. Top 10 Bioinformatics Tools for scRNA-seq in 2025 [https://neovarsity.org/blogs/top-bioinformatics-tools-for-scrna-seq]
- 102. Scvi-hub: an actionable repository for model-driven single ... [https://www.nature.com/articles/s41592-025-02799-9]
- 103. scvi-tools 1.4 release [https://scvi-tools.org/blog/v13/]
- 104. Integrating datasets with scVI in R [https://docs.scvi-tools.org/en/1.3.3/tutorials/notebooks/r/scvi_in_R.html]
- 105. HoppeSyler Scientific - Seurat vs. Scanpy [https://www.linkedin.com/posts/hoppesyler-scientific_seurat-vs-scanpy-a-practical-decision-guide-activity-7392216665352065024-P3rI]
- 106. Scanpy – Single-Cell Analysis in Python — scanpy [https://scanpy.readthedocs.io/]
- 107. Benchmarking single-cell cross-omics imputation methods for ... [https://genomebiology.biomedcentral.com/articles/10.1186/s13059-025-03514-9]
- 108. A comparison of marker gene selection methods for single-cell ... [https://pmc.ncbi.nlm.nih.gov/articles/PMC10895860/]
- 109. Preprocessing and clustering - Scanpy - Read the Docs [https://scanpy.readthedocs.io/en/stable/tutorials/basics/clustering.html]
- 110. Feature selection methods affect the performance of ... [https://www.nature.com/articles/s41592-025-02624-3]
- 111. Identification of Meibomian gland stem cell populations ... [https://www.nature.com/articles/s41467-025-56907-6]
- 112. Asc-Seurat: analytical single-cell Seurat-based web application [https://bmcbioinformatics.biomedcentral.com/articles/10.1186/s12859-021-04472-2]
- 113. Integrating single-cell RNA and T cell/B cell receptor ... [https://www.nature.com/articles/s41590-024-02059-6]
- 114. Next-generation sequencing protocol of hematopoietic stem ... [https://journals.plos.org/plosone/article?id=10.1371/journal.pone.0313009]