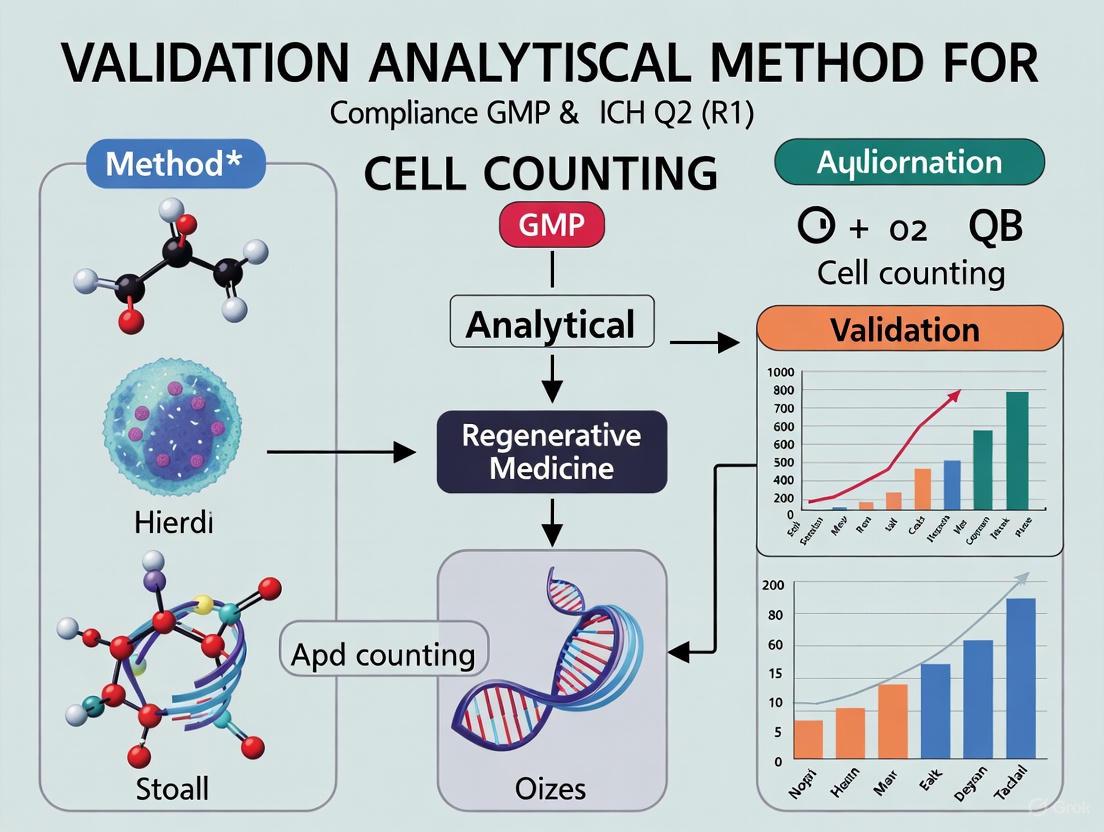
A Practical Guide to Validating Cell Counting Methods for GMP Compliance Under ICH Q2(R1)
This article provides a comprehensive roadmap for researchers, scientists, and drug development professionals tasked with validating cell counting methods in a Good Manufacturing Practice (GMP) environment.
A Practical Guide to Validating Cell Counting Methods for GMP Compliance Under ICH Q2(R1)
Abstract
This article provides a comprehensive roadmap for researchers, scientists, and drug development professionals tasked with validating cell counting methods in a Good Manufacturing Practice (GMP) environment. Aligned with ICH Q2(R1) guidelines, the content spans from foundational regulatory principles and method selection to detailed validation protocols for parameters like accuracy, precision, and linearity. It further addresses common troubleshooting scenarios and offers a comparative analysis of manual versus automated counting technologies, delivering a complete framework to ensure the quality, safety, and efficacy of cell-based therapies.
GMP and ICH Q2(R1) Fundamentals: Building a Compliant Foundation for Cell Counting
This guide provides a comparative analysis of cell counting methods within the context of Good Manufacturing Practice (GMP) for Advanced Therapy Medicinal Products (ATMPs), framing the evaluation within the rigorous requirements of analytical method validation as per ICH Q2(R1).
The Evolving GMP Landscape for ATMPs
The regulatory framework for ATMPs is dynamic, with significant recent developments aimed at ensuring product quality and patient safety. The European Medicines Agency (EMA) has proposed revisions to Part IV of its GMP guidelines specific to ATMPs, focusing on alignment with the revised Annex 1 for sterile medicinal products, integration of ICH Q9 (Quality Risk Management) and ICH Q10 (Pharmaceutical Quality System) principles, and adaptation to new technologies like automated systems and single-use systems [1]. Furthermore, a new EMA Guideline on clinical-stage ATMPs came into effect in July 2025, serving as a primary multidisciplinary reference for clinical trial applications [2]. The International Society for Stem Cell Research (ISSCR) has endorsed these updates, recommending their integration into the main body of EudraLex Volume 4 for more consistent guidance [3]. Simultaneously, new guidance has been issued for managing raw materials, which pose unique challenges as they often come from non-traditional sources (animal, human) and may not be covered by pharmacopeias [4].
Cell Counting: A Critical yet Challenging Analytical Method in ATMP GMP
Cell counting is a foundational analytical procedure in ATMP development and manufacturing. Accurate counts are essential for process control (e.g., monitoring growth, transfection), determining seeding densities, and calculating final product dosage [5] [6]. However, achieving accurate and reliable cell counting is notoriously challenging. A 2020 survey revealed that only 18% of respondents from key industries had high confidence in their cell viability assay results [5]. The complexity stems from several factors:
- Cell Heterogeneity: ATMPs consist of diverse cell types (e.g., MSCs, T cells, hiPSCs) with varying sizes, shapes, and tendencies to clump or aggregate [5].
- Viability Assessment: Distinguishing live from dead cells is user-defined and can be based on membrane integrity, metabolic activity, or proliferative capacity, leading to a spectrum of results [5].
- Process-Related Impurities: The presence of cellular debris, magnetic beads used in cell selection, or components of the suspension medium (e.g., DMSO) can significantly interfere with counting accuracy [5] [6].
Within a GMP environment, any analytical method, including cell counting, must be formally validated to ensure it is fit for its intended purpose. The core principles of ICH Q2(R1) validation include demonstrating accuracy, precision (repeatability, intermediate precision), specificity, range, linearity, and robustness.
Comparative Analysis of Cell Counting Methods
The following table summarizes the key cell counting methods, their operating principles, and their performance characteristics in the context of ATMP manufacturing and ICH Q2(R1) validation.
Table 1: Comparison of Cell Counting Methods for ATMP Applications
| Cell Counting Method | Description | Advantages | Disadvantages & GMP Validation Considerations |
|---|---|---|---|
| Hemocytometer (Manual) [5] [7] | Manual counting using a specialized chamber (e.g., Bürker) under a microscope. | Low cost; suitable for various cell types; direct visualization [5]. | Time-consuming; highly susceptible to human error, leading to poor precision; operator-dependent, challenging to validate for intermediate precision [5] [7]. |
| Automated Image Analysis [5] [7] | Uses optical, electronic, and image processing to count and classify cells (e.g., NucleoCounter NC-100). | Fast speed; high throughput; high precision; automated, reducing operator bias [5] [7]. | Relatively high cost; can be influenced by sample type and condition (e.g., clumps, beads); requires validation of software algorithm [5] [6]. |
| Impedance Cell Counter [5] | Detects changes in electrical resistance as cells pass through an electric field. | Fast speed; high throughput; high precision; automated [5]. | Relatively high cost; inability to differentiate between live and dead cells, failing specificity for viability [5]. |
| Flow Cytometer [5] | Uses optical and electronic tech. to measure multiple parameters of individual cells labeled with fluorescent markers. | High throughput; multi-parameter analysis (size, fluorescence); high sensitivity and accuracy; uses internal calibration microspheres for accuracy [5]. | High cost; requires complex operation and technical experience; stringent requirements for instrument qualification and validation [5]. |
Supporting Experimental Data: Automated vs. Manual Counting Validation
A key study directly compared an automated fluorescence imaging-based method (NucleoCounter NC-100) against the manual hemocytometer for counting human induced pluripotent stem cells (hiPSCs) in a cGMP environment [7]. The validation, performed in accordance with ICH Q2(R1) principles, demonstrated that the automated method showed superior precision (reproducibility) and was validated for accuracy, specificity, range, and linearity [7]. This study provides concrete experimental evidence that automation can effectively replace traditional manual methods, paving the way for more reliable and standardized cell counting in GMP facilities [7].
Experimental Protocol for Cell Counting Method Evaluation
For a method to be suitable for GMP use, its performance must be rigorously evaluated. The International Organization for Standardization (ISO) provides robust guidance in ISO 20391-2:2019, which outlines an experimental design and statistical analysis to quantify counting method performance [6].
The workflow below illustrates the key stages of this experimental design.
Diagram 1: Method Evaluation Workflow
Detailed Methodology [6]:
- Define Sample Types: The evaluation should use cells representative of the entire manufacturing process. This includes samples from different stages, such as:
- Peripheral Blood Mononuclear Cells (PBMCs) after Ficoll separation.
- T cells isolated via positive selection (with magnetic beads attached) and negative selection (without beads).
- Prepare Dilution Series: Create a series of dilutions (e.g., 1:1, 1:2, 1:3, 1:4, 1:5) of the cell sample using an appropriate buffer like Dulbecco's Phosphate Buffered Saline (dPBS) supplemented with Human Serum Albumin (HSA). The concentrations should span the expected operating range of the instrument.
- Assign Random IDs: Each sample tube in the dilution series is assigned a random identification number to prevent operator bias during counting.
- Execute Replicate Counts: For each dilution, multiple sample tubes are prepared (e.g., n=3), and each tube is counted multiple times (e.g., 3 replicates) by the instrument/method being evaluated.
- Statistical Analysis: Data is analyzed according to ISO 20391-2. Key metrics include:
- Proportionality Index: Assesses whether the measured cell concentration is directly proportional to the expected concentration across dilutions. An ideal method has a proportionality index of 1.
- % Coefficient of Variation (%CV): Measures precision. Lower %CV across replicate observations indicates higher repeatability.
The Scientist's Toolkit: Key Reagents and Materials
The table below lists essential materials used in cell counting experiments for ATMP workflows, based on the cited protocols [6].
Table 2: Research Reagent Solutions for Cell Counting in Cell Therapy Workflows
| Item | Function / Application | Example |
|---|---|---|
| Leukopak | Starting material for obtaining human immune cells for therapy manufacturing. | Cryopreserved Leukopak (StemCell Technologies) [6]. |
| Cell Separation Medium | Isolation of peripheral blood mononuclear cells (PBMCs) from whole blood via density gradient centrifugation. | Ficoll-Paque (Cytiva) [6]. |
| Magnetic Beads | Isolation of specific cell types (e.g., T cells) through positive or negative selection. | Dynabeads CD3/CD28 (Positive Selection) / Dynabeads Untouched Human T cells Kit (Negative Selection) [6]. |
| Cell Culture Buffer / Medium | Washing, diluting, and suspending cells during processing; choice of medium can critically impact counting accuracy. | HBSS, CTS Immune Cell SR, Hanks’ Balanced Salt Solution, dPBS with Human Serum Albumin [5] [6]. |
| Fluorescent Stains | Used in many automated systems to distinguish viable and non-viable cells based on membrane integrity. | Acridine Orange (AO) for total cells, Propidium Iodide (PI) for dead cells [5]. |
The choice of cell counting method is a critical decision in ATMP development with direct implications for product quality and regulatory compliance. While traditional manual methods are still used, automated systems, particularly image-based and flow cytometry-based platforms, offer demonstrably superior precision, accuracy, and linearity, making them more amenable to validation under ICH Q2(R1). Successful integration of any counting method into a cGMP workflow requires a systematic, risk-based approach guided by international standards like ISO 20391-2 and a thorough understanding of the evolving regulatory expectations for ATMPs.
The International Council for Harmonisation (ICH) Q2(R1) guideline, titled "Validation of Analytical Procedures: Text and Methodology," provides a comprehensive framework for validating analytical methods used in pharmaceutical development and registration [8]. This guideline harmonizes standards to ensure that analytical procedures consistently produce reliable, accurate results that are acceptable to regulatory authorities globally [9] [8].
Originally established as two separate documents (Q2A in 1994 and Q2B in 1996), these were unified into a single integrated guidance in November 2005 [10] [8] [11]. ICH Q2(R1) serves as a foundational document that defines the key validation parameters required to demonstrate that an analytical procedure is suitable for its intended purpose, particularly for testing drug substances and products, including both chemical and biological/biotechnological products [12] [8].
The primary objective of this guideline is to provide a standardized approach to method validation, ensuring the quality, safety, and efficacy of pharmaceuticals through scientifically sound analytical data [13] [8]. For researchers and drug development professionals, understanding and implementing ICH Q2(R1) is essential for regulatory compliance and successful product registration.
Core Principles and Analytical Procedure Categories
Fundamental Concepts and Definitions
ICH Q2(R1) establishes a standardized vocabulary and methodological approach for analytical validation. An crucial distinction lies between the terms "analytical procedure" and "analytical method". The guideline specifically addresses analytical procedures, which encompass the complete process from sample collection and preparation through to the reporting of results. This is a broader concept than an "analytical method," which typically refers only to the instrumental technique or analytical principle used [11].
The guideline's principles apply to various analytical techniques used in the quality control of pharmaceuticals. While originally developed with a focus on chromatographic methods, its framework is adaptable to other technologies [11]. For any analytical procedure, the fundamental requirement is that it must be validated for its intended use, with the validation extent depending on the application [11].
Categorization of Analytical Procedures
ICH Q2(R1) classifies analytical procedures into three major types based on their purpose in assessing pharmaceutical quality. The table below outlines these categories, their primary objectives, and key validation considerations.
Table 1: Categories of Analytical Procedures as Defined by ICH Q2(R1)
| Category | Primary Objective | Key Question Answered | Critical Validation Parameters |
|---|---|---|---|
| Identification Tests [13] | To verify the identity of an analyte in a sample [13]. | "Does it contain what is declared?" [13] | Specificity (ability to discriminate analyte from similar compounds) [13]. |
| Testing for Impurities [13] | To detect and quantify (or limit) impurities in a sample [13]. | "Does it exclusively contain what is declared?" [13] | Specificity, Accuracy, Precision (for quantitative tests); Detection Limit [13]. |
| Assay Tests [13] | To quantify the major component or measure the potency of a drug substance or product [13]. | "Does it contain as much as declared?" [13] | Specificity, Linearity, Accuracy, Precision [13]. |
This categorization is crucial because it directly influences which validation parameters must be demonstrated and to what extent, ensuring that each analytical procedure is fit for its specific purpose in guaranteeing pharmaceutical quality.
Comprehensive Breakdown of Validation Characteristics
ICH Q2(R1) defines eight key validation characteristics that provide a comprehensive framework for evaluating analytical procedure performance. The following diagram illustrates the workflow for validating an analytical procedure according to this framework, showing the relationships between these core characteristics.
Specificity and Accuracy
Specificity is the ability to assess unequivocally the analyte in the presence of components that may be expected to be present, such as impurities, degradation products, and matrix components [9]. It guarantees your method can accurately discriminate between the target analyte and other components present in the sample matrix [9]. For identification tests, specificity is the most critical parameter, ensuring the procedure can correctly identify the substance in question [13].
Accuracy expresses the closeness of agreement between the value that is accepted as a true value or an accepted reference value and the value found [9]. It measures how closely your test results align with an accepted true value, typically expressed as percent recovery of a known added amount of analyte [9]. For drug substances, accuracy is typically assessed by comparison against a reference standard, while for drug products, spiked placebos or comparison to an established reference method may be used [9].
Precision, Linearity, and Range
Precision measures the degree of agreement among individual test results when the procedure is applied repeatedly to multiple samplings of a homogeneous sample [9]. It is evaluated at three levels:
- Repeatability (intra-assay precision): Expresses the precision under the same operating conditions over a short interval of time [9].
- Intermediate precision: Expresses within-laboratory variations, such as different days, analysts, or equipment [9].
- Reproducibility: Expresses the precision between different laboratories [9].
Precision is typically measured by calculating standard deviation and relative standard deviation (RSD) values, with acceptable precision generally indicated by RSD values below 2% for assay methods and below 15% for impurity determination [9].
Linearity demonstrates the ability of the method to obtain test results that are directly proportional to the concentration of analyte in the sample within a given range [9]. It is typically confirmed through correlation coefficients, with industry consensus generally considering r ≥ 0.995 acceptable for chromatographic methods and r ≥ 0.990 for bioanalytical techniques [9].
Range is the interval between the upper and lower concentrations of analyte in the sample for which it has been demonstrated that the analytical procedure has a suitable level of precision, accuracy, and linearity [9]. For assay methods, ICH Q2(R1) recommends a range of 80-120% of the target concentration [9].
Detection Limit, Quantitation Limit, and Robustness
Detection Limit (DL) is the lowest amount of analyte in a sample that can be detected but not necessarily quantified as an exact value [9]. It represents the lowest analyte concentration that can be reliably detected, though not necessarily quantified [9]. Common approaches for determining DL include signal-to-noise ratio (typically 3:1), standard deviation of the response, and visual evaluation [9].
Quantitation Limit (QL) is the lowest amount of analyte in a sample that can be quantitatively determined with suitable precision and accuracy [9]. While DL confirms the analyte's presence, QL establishes the minimum concentration for reliable quantitative measurement [9]. QL is typically determined using a signal-to-noise ratio of 10:1, standard deviation of response multiplied by a factor (usually 10), or through visual evaluation [9].
Robustness measures the capacity of a method to remain unaffected by small, deliberate variations in method parameters, such as pH, mobile phase composition, temperature, or flow rate in chromatographic methods [9]. It provides an indication of the method's reliability during normal usage and is critical for transfering methods between laboratories [9].
Table 2: Key Validation Characteristics and Their Requirements in ICH Q2(R1)
| Validation Characteristic | Definition | Typical Acceptance Criteria |
|---|---|---|
| Specificity [9] | Ability to measure analyte accurately in the presence of interfering components [9]. | No interference observed [9]. |
| Accuracy [9] | Closeness of test results to the true value [9]. | Recovery of 98-102% for drug substance; 98-102% for drug product [9]. |
| Precision [9] | Degree of agreement among individual test results [9]. | RSD < 2% for assays; RSD < 15% for impurities [9]. |
| Linearity [9] | Ability to obtain results proportional to analyte concentration [9]. | Correlation coefficient (r) ≥ 0.995 (chromatography); r ≥ 0.990 (bioanalytical) [9]. |
| Range [9] | Interval between upper and lower analyte concentrations with suitable precision, accuracy, and linearity [9]. | 80-120% of target concentration (assays); reporting threshold to 120% of specification (impurities) [9]. |
| Detection Limit [9] | Lowest concentration of analyte that can be detected [9]. | Signal-to-noise ratio of 3:1 [9]. |
| Quantitation Limit [9] | Lowest concentration of analyte that can be quantified with acceptable precision and accuracy [9]. | Signal-to-noise ratio of 10:1 [9]. |
| Robustness [9] | Capacity to remain unaffected by small, deliberate variations in method parameters [9]. | System suitability criteria met despite variations [9]. |
Practical Application in Cell Therapy and Bioanalysis
Implementing ICH Q2(R1) in Cell Counting Method Validation
The validation of cell counting methods exemplifies the practical application of ICH Q2(R1) principles in the rapidly advancing field of cell and gene therapies. Accurate cell counting is critical for proper dosage administration in therapies like CAR-T cells, where inaccuracies may lead to inefficacy or unwanted autoimmune responses in patients [14].
However, applying ICH Q2(R1) to cell counting presents unique challenges. According to ISO Cell Counting Standards, accuracy cannot be readily applied in the traditional sense for cell counting methods because there are currently no reference materials for live mammalian cells that are certified for cell concentration [14]. This limitation requires researchers to employ alternative validation approaches.
In practice, the evaluation of cell counting method accuracy needs to be indirectly assessed by orthogonal comparative methods [14]. Furthermore, the ISO Cell Counting Standard Part 2 describes a protocol to simultaneously evaluate precision (repeatability), coefficient of determination (R²), and proportionality as key performance indicators for cell counting methods [14].
Case Study: Validation of T Cell Metabolic Potential Assessment
A practical example of ICH Q2(R1) implementation in cellular therapy appears in the validation of a method evaluating T cell metabolic potential using Seahorse technology. Researchers addressed the method's inter-assay variability by incorporating a JURKAT tumor cell line as an internal quality control material in each experiment [15].
This approach specifically targeted the validation parameters of precision and robustness by using a homogeneous and stable control material to reduce between-plate variation [15]. The validation study followed ICH Q2(R1) guidelines to confirm the method's specificity, accuracy, precision, linearity, and range under defined experimental conditions [15].
This case demonstrates how ICH Q2(R1) principles can be adaptively applied to novel bioanalytical techniques, contributing to improved robustness and potentially supporting Good Manufacturing Practices (GMP)-compliant validation for quality control in T cell-based therapies production [15].
Essential Research Reagent Solutions
The successful implementation of validated analytical procedures requires specific reagent solutions and materials. The following table details key components used in the featured T cell metabolic potential experiment and their functions.
Table 3: Research Reagent Solutions for T Cell Metabolic Potential Assessment
| Reagent/Material | Function/Purpose | Application Context |
|---|---|---|
| JURKAT Cell Line [15] | Homogeneous and stable control material to monitor inter-assay variability [15]. | Internal Quality Control for T cell metabolism studies [15]. |
| XF Cell MitoStress Kit [15] | Contains compounds to evaluate basal, stressed and maximal glycolysis and OXPHOS parameters [15]. | T cell metabolic potential assessment [15]. |
| Oligomycin [15] | ATP synthase inhibitor; added to assess glycolytic capacity [15]. | Seahorse XF MitoStress Test [15]. |
| Carbonyl Cyanide 4-(Trifluoromethoxy)phenylhydrazone (FCCP) [15] | Mitochondrial uncoupler; added to assess maximal respiratory capacity [15]. | Seahorse XF MitoStress Test [15]. |
| Glucose-Containing Medium [15] | Provides energy substrate for cellular metabolism during assessment [15]. | Baseline metabolic measurements [15]. |
Recent Developments: Transition to ICH Q2(R2) and Q14
While ICH Q2(R1) remains the current implemented guideline, the ICH has recently adopted updated versions to address evolving analytical technologies and applications. The revision to ICH Q2(R2) and the introduction of ICH Q14 ("Analytical Procedure Development") represent significant advancements in the standards governing analytical procedure development and validation [16].
Key enhancements in these updated guidelines include:
- Introduction of a lifecycle approach that advocates for continuous validation and assessment throughout the method's operational use, rather than treating validation as a one-time event [16].
- Enhanced method development practices that incorporate Quality by Design (QbD) principles, focusing on defining the Analytical Target Profile (ATP) early in the process [16] [11].
- Refinements to validation parameters including more comprehensive requirements for accuracy and precision, and mandatory robustness testing tied to the lifecycle approach [16].
These updates are particularly relevant for biologics and complex analytical techniques, as the original ICH Q2(R1) was primarily designed around the needs of traditional small molecule drugs and lacked specific guidance for the unique challenges posed by biologics [16].
The ICH Q2(R1) framework provides an essential foundation for ensuring the reliability and consistency of analytical procedures in pharmaceutical development and quality control. By defining clear validation characteristics and requirements, this guideline enables researchers and drug development professionals to demonstrate that their analytical methods are scientifically sound and fit for their intended purposes.
As the pharmaceutical landscape evolves with increasingly complex biologics and cell-based therapies, the principles of ICH Q2(R1) remain relevant, even as the framework itself advances with the recent adoption of ICH Q2(R2) and Q14. Understanding these core principles is crucial for developing robust, validated analytical procedures that meet regulatory expectations and ensure product quality, safety, and efficacy.
Publish Comparison Guides
In the development and manufacturing of cell and gene therapies, accurate cell counting is a foundational analytical procedure that directly impacts product identity, purity, potency, and safety [17]. For advanced therapy medicinal products (ATMPs), cell counting is not merely a preliminary step; it is a potency assay, determining the therapeutic dose delivered to a patient [18]. A subpotent batch can lead to lack of efficacy, while an overpotent one may cause adverse reactions [19]. Consequently, validating the cell counting method according to rigorous standards is not optional—it is a regulatory imperative.
This guide provides a structured framework for selecting and validating cell counting methods under the International Council for Harmonisation (ICH) Q2(R1) guideline and good manufacturing practice (GMP) principles [18] [19]. We objectively compare manual and automated counting technologies, supported by experimental data, and outline the experimental protocols required to generate validation evidence.
The Regulatory Framework: ICH Q2(R1) and GMP
The ICH Q2(R1) guideline, "Validation of Analytical Procedures," defines the core validation parameters required to demonstrate that an analytical method is suitable for its intended purpose [18]. For a cell counting method used in GMP manufacturing, this typically involves assessing the following parameters [18] [19]:
- Accuracy: Expresses the closeness of agreement between the test result and an accepted reference value.
- Precision: This includes repeatability (intra-assay precision) and intermediate precision (inter-operator, inter-instrument reproducibility).
- Linearity & Range: The ability to obtain results directly proportional to the analyte (cell) concentration within a given range.
- Specificity: The ability to assess the analyte unequivocally in the presence of other components like debris or magnetic beads.
A significant challenge in cell counting is the general lack of universally available reference materials for live mammalian cells, making direct accuracy assessment difficult [14] [20]. To address this, standards organizations have developed alternative approaches. The ISO 20391-2 standard provides an experimental design based on a dilution series, which uses the principle of proportionality as an internal control to quantify method performance in the absence of a reference material [14] [21] [20].
The following diagram illustrates the logical relationship between the regulatory framework, the analytical challenge, and the standardized solution for method evaluation.
Comparison of Cell Counting Methods and Performance Data
Cell counting methods fall into two broad categories: manual hemocytometers and automated systems. Automated systems can be further divided into image-based cytometers and flow-based systems.
Performance Comparison Table
The table below summarizes key characteristics and performance data from published studies comparing these methods.
| Method Category | Specific Method/Instrument | Precision (Average %CV) | Linearity (R²) | Key Advantages | Key Limitations |
|---|---|---|---|---|---|
| Manual | Bürker Hemocytometer [18] [19] | 10.0% - 14.5% [22] | 0.993 - 0.998 [22] | Pharmacopeia reference; low equipment cost [18]. | Low throughput; high operator dependency & variability [19] [22]. |
| Manual | Neubauer Improved Hemocytometer [23] | ~13.4% [22] | Information missing | Widely used; reasonable technical performance [23]. | Subjective; time-consuming; moderate precision [23]. |
| Automated Image-Based | NucleoCounter NC-100 [19] | Higher than manual [19] | Information missing | High precision; fast; cGMP validated for hiPSCs [19]. | Higher instrument cost; requires specific consumables. |
| Automated Image-Based | CellDrop System (Avg. of 3 instruments) [22] | 4.7% - 6.9% [22] | 0.996 - 0.999 [22] | High precision & linearity; time savings (<10 sec/sample) [22]. | Information missing |
| Automated Flow-Based | Flow Cytometry (SSC or fluorescence) [23] | Deficient accuracy and precision [23] | Information missing | High reproducibility; agreement between flow methods [23]. | Deficient accuracy/precision for microspores; high cost [23]. |
Contextualizing the Data
The data in the table reveals clear trends. Automated image-based counters, such as the CellDrop and NucleoCounter, consistently demonstrate superior precision (lower %CV) and excellent linearity (R² > 0.99) compared to manual methods [19] [22]. One study noted that flow cytometry, while excellent for cell population analysis, showed deficient accuracy and precision for counting plant microspores, highlighting that the "best" method is context-dependent and must be validated for the specific cell type [23].
Experimental Protocols for Method Evaluation and Validation
To generate the comparative data presented, researchers employ standardized experimental designs. Two primary protocols are used: one for general method performance evaluation and another for formal validation per ICH Q2(R1).
Evaluating Performance with ISO 20391-2 Dilution Series
This protocol is ideal for selecting or qualifying a method before full GMP validation. It assesses precision and proportionality without a reference material [14] [21] [20].
- Objective: To evaluate the quality of a cell counting method by calculating precision (%CV) and a proportionality index (PI).
- Cell Sample: A homogeneous stock solution of the cell type of interest (e.g., T cells, hiPSCs).
- Experimental Design:
- Create a dilution series from the stock (e.g., 1:1, 1:2, 1:3, 1:4, 1:5) using independent dilution steps [21].
- Verify dilution integrity by weighing pipetted volumes to confirm accuracy [23].
- For each dilution level, prepare multiple replicate sample tubes (e.g., n=3).
- Assign random IDs to tubes to eliminate counting bias.
- Count each replicate multiple times (e.g., k=3) using the method under evaluation.
- Statistical Analysis:
- Precision: Calculate the % Coefficient of Variation (%CV) for the replicate measurements at each dilution level. Lower %CV indicates higher repeatability [20].
- Proportionality: Plot the measured cell concentration against the dilution factor. A high coefficient of determination (R²) and a Proportionality Index (PI) close to 1 indicate that the count is linearly proportional to the dilution, a hallmark of a robust method [14] [20].
The workflow for this experimental design is summarized in the following diagram.
Validation Protocol per ICH Q2(R1) for GMP
For formal method validation, the protocol is expanded to meet specific ICH criteria [18] [19].
- Objective: To validate a cell counting method for accuracy, precision, linearity, and range according to ICH Q2(R1).
- Reference & Test Methods: The pharmacopeial method (e.g., Bürker hemocytometer) is often used as the reference comparator against the new automated method [18] [19].
- Experimental Design:
- Accuracy: Compare results from the test method against the reference method using a statistically significant number of samples from different batches.
- Precision (Repeatability & Intermediate Precision):
- Repeatability: One operator counts the same homogeneous sample multiple times in one session.
- Intermediate Precision: Different operators count the same sample on different days or with different instruments.
- Linearity & Range: Prepare a series of samples across a specified range of concentrations (e.g., from 2.5 x 10⁵ cells/mL to 2.0 x 10⁶ cells/mL). The method's response should be linear across this "range," which is the intended operating concentration [18] [22].
- Specificity: Test the method's ability to distinguish viable cells from dead cells or debris, and to count cells in complex matrices (e.g., with magnetic beads present from cell isolation) [21].
The Scientist's Toolkit: Essential Research Reagent Solutions
The following table details key materials and reagents commonly used in cell counting experiments for therapy development.
| Item | Function / Application | Examples / Notes |
|---|---|---|
| Hemocytometer | Manual cell counting chamber. Reference method in validation. | Bürker (in Eur. Ph.) [18] [19], Neubauer Improved [23]. |
| Automated Cell Counter | Instrument for rapid, reproducible cell counting and viability. | Image-based (NucleoCounter [19], CellDrop [22]); Flow-based (Flow cytometer [21] [23]). |
| Vital Stain | Distinguishes live from dead cells for viability assessment. | Trypan Blue [18] [22]. |
| Fluorescent Stain | Used with fluorescent-capable automated counters for viability. | Propidium Iodide (PI) stains dead cells [23]; Acridine Orange (AO) stains all nuclei. |
| Lysing Solution | Removes red blood cells from samples like leukopaks or blood. | Tuerk's solution [18]; commercial ammonium chloride-based buffers. |
| Magnetic Beads | Isolate target cells (e.g., T cells) from a heterogeneous mixture. | Bead-bound cells (positive selection) pose a challenge for some image algorithms [21]. |
| Buffer with Protein | Diluent for creating cell dilution series; protein prevents adhesion. | dPBS with Human Serum Albumin (HSA) [21]. |
Selecting and validating a cell counting method is a critical, multi-faceted process in cell therapy development. The experimental data clearly shows that automated image-based systems offer significant advantages in precision, speed, and reproducibility over manual hemocytometers, making them strong candidates for GMP workflows [19] [22].
The recommended path forward is a two-stage approach:
- Method Selection & Qualification: Use the ISO 20391-2 dilution series framework to objectively compare the performance of different methods for your specific cell type and process. This provides data-driven evidence for selecting a fit-for-purpose method [14] [20].
- Formal GMP Validation: Once a method is selected, conduct a full ICH Q2(R1) validation for parameters like accuracy (vs. a reference), precision, linearity, and range. This generates the formal evidence required for regulatory submissions and product batch release [18] [19].
By adhering to these structured experimental protocols, researchers and drug developers can ensure the reliability of a fundamental measurement, thereby underpinning the quality, safety, and efficacy of advanced cell and gene therapies.
The Critical Role of Cell Counting as a Potency Test in Cell Therapy Products
In the tightly regulated field of cell therapy, potency testing stands as a critical gatekeeper, serving as definitive evidence that a therapeutic product possesses the specific biological activity required to achieve its intended clinical effect. Among the various analytical methods employed, cell counting emerges as a surprisingly fundamental potency test. Recent analysis of regulatory documents for the 31 U.S. Food and Drug Administration (FDA)-approved cell therapy products (CTPs) reveals that measurements of cell viability and count constitute the most frequently used category of potency tests, employed by 61% (19 of 31) of all approved CTPs [24]. This article explores the critical role of cell counting within the potency testing landscape, objectively comparing the performance of different counting methodologies and framing their validation within the rigorous requirements of current Good Manufacturing Practice (cGMP) and ICH Q2(R1).
The Regulatory Imperative: Cell Counting in Approved Therapies
Prevalence in Approved Products
The justification for treating cell counting as a potency test is strongly supported by regulatory precedent. A comprehensive 2025 review of FDA-approved CTPs found that each product employs an average of 3.4 potency tests, with "Viability and count" representing the single largest category, accounting for 52% (37 of 71) of all non-redacted potency tests [24]. This data underscores that regulatory agencies do not view cell counting as a mere quality check, but as a fundamental measurement of a product's therapeutic capacity.
Potency Testing Framework
Within the regulatory framework, potency is defined as "the specific ability or capacity of the product to affect a given result" [25]. For cell therapies, where the active substance is the cell itself, the quantity of viable cells directly constitutes the product's "strength." Consequently, cell counting serves multiple critical functions:
- Dose Determination: Directly determines the number of viable cells administered to a patient.
- Process Control: Monitors cell expansion and health during manufacturing.
- Product Consistency: Ensures batch-to-batch uniformity in the final product.
- Stability Indicating: Tracks product degradation over time [26] [17].
The table below summarizes the prevalence of different potency test categories for FDA-approved CTPs, demonstrating the dominance of viability and count measurements [24].
Table 1: Categories of Potency Tests Used in 31 FDA-Approved Cell Therapy Products
| Potency Test Category | Number of Tests | Percentage of Non-Redacted Tests | CTPs Using This Category |
|---|---|---|---|
| Viability and Count | 37 | 52% | 19 (61%) |
| Expression | 19 | 27% | 20 (65%) |
| Bioassays | 7 | 7% | 7 (23%) |
| Genetic Modification | 6 | 9% | 6 (19%) |
| Histology | 2 | 3% | 2 (6%) |
Method Comparison: Manual vs. Automated Cell Counting
Performance Attribute Validation
Cell counting methods must be rigorously validated according to ICH Q2(R1) guidelines to ensure their suitability for cGMP environments. The following table synthesizes data from multiple validation studies comparing manual hemocytometry with automated counting systems, highlighting key performance differences [26] [19] [27].
Table 2: Performance Comparison of Cell Counting Methods in cGMP Environments
| Validation Parameter | Manual Hemocytometer | Semi-Automated (Countess) | Fully Automated (Vi-CELL XR) |
|---|---|---|---|
| Accuracy | Reference Method | >95% vs. Hemocytometer | >95% vs. Hemocytometer |
| Precision (CV%) | 5-10% (Viable Cells) | <10% (Total); <5% (Viable) | <5% (Intra-operator) |
| Linearity Range | 2.5×10⁵–8.0×10⁶ cells/mL | 1×10⁴–1×10⁷ cells/mL | 5×10⁴–1×10⁷ cells/mL |
| Sample Volume | 50 μL | 20 μL | 500 μL |
| Analysis Time | Sample Concentration-Dependent | <1 minute | <2.5 minutes |
| Staining Options | Multiple (TB, Erythrosin B, etc.) | Trypan Blue primarily | Trypan Blue primarily |
| Operator Dependency | High | Moderate | Low |
Analytical Workflow and Decision Process
The validation of cell counting methods follows a systematic workflow aligned with cGMP principles, from initial method selection through to routine implementation. The diagram below illustrates this analytical lifecycle and the key decision points for method suitability.
Experimental Protocols for Method Validation
Validation According to ICH Q2(R1)
For a cell counting method to be acceptable in a cGMP environment, it must undergo comprehensive validation. The following protocols are adapted from published validation studies and align with ICH Q2(R1) requirements [26] [27].
Accuracy Assessment Protocol
- Objective: Demonstrate that the alternative method (automated counter) provides results equivalent to the reference method (manual hemocytometer).
- Materials: Cell suspension (e.g., CHO-K1, U937, or hiPSCs), trypan blue solution (0.4%-0.8%), hemocytometer, automated cell counter (e.g., NucleoCounter NC-100, Vi-CELL XR, or Countess).
- Procedure:
- Prepare a homogeneous cell suspension at approximately 1×10⁶ cells/mL.
- For manual counting: Mix 50 μL cell suspension with 50 μL trypan blue. Load 20 μL onto hemocytometer. Count viable (unstained) cells in four corner squares.
- For automated counting: Follow manufacturer's instructions for sample loading and analysis.
- Analyze at least five independent samples by both methods.
- Calculate accuracy as percentage agreement: (Automated count/Manual count) × 100%.
- Acceptance Criterion: Accuracy ≥90% compared to reference method [27].
Precision and Repeatability Testing
- Objective: Determine intra-assay (repeatability) and inter-operator (intermediate precision) variability.
- Materials: Cell suspension at low, medium, and high concentrations within the linear range.
- Procedure:
- Prepare three cell suspensions at 2×10⁵, 1×10⁶, and 5×10⁶ cells/mL.
- For intra-assay precision: A single operator performs ten replicate counts of each concentration in one session.
- For inter-operator precision: Three different operators each perform five replicate counts of the same cell suspensions.
- Calculate coefficient of variation (CV%) for each concentration: (Standard Deviation/Mean) × 100%.
- Acceptance Criterion: CV% <10% for total cells; CV% <5% for viable cells [26].
GMP-Compliant Sample Preparation
Standardized sample preparation is critical for reproducible cell counting results. The workflow below outlines the optimal procedure for viable cell counting using trypan blue exclusion in a GMP environment.
The Scientist's Toolkit: Essential Reagents and Materials
Successful implementation of cell counting as a potency test requires specific, qualified reagents and materials. The following table details essential components and their functions in a GMP-compliant workflow.
Table 3: Essential Research Reagent Solutions for Cell Counting Validation
| Reagent/Material | Function | GMP Considerations | Example Products |
|---|---|---|---|
| Trypan Blue Solution | Viability stain; distinguishes viable/non-viable cells | Concentration standardization (0.4-0.8%); qualification of each lot | Gibco Trypan Blue; Vi-CELL XR Quad Pak Reagent |
| Size Standard Beads | Instrument calibration and verification | Certified reference materials with traceable documentation | Coulter CC Size Standard Mix; ViaCheck Control Beads |
| Viability Controls | Assay performance qualification | Pre-defined viability levels (0%, 50%, 75%, 90%, 100%) | ViaCheck Control Beads (0-100% viability) |
| Counting Chambers | Sample containment for analysis | Disposable preferred to avoid cross-contamination | Bürker chamber; Fast Read 102; Countess chamber slides |
| PBS/Dilution Buffer | Sample dilution to counting range | Sterile, endotoxin-free, qualified for cell culture | Gibco PBS; Phosphate Buffered Saline 1X |
Strategic Implementation in Cell Therapy Development
Phase-Appropriate Validation
The American Society of Gene & Cell Therapy (ASGCT) emphasizes that potency assurance strategies should be phase-appropriate throughout product development [28]. In early-phase trials, cell counting may serve as the primary potency test, with validation evolving as the product advances. This approach is particularly relevant for autologous therapies with limited batch numbers and significant patient-to-patient variability.
Integration with Potency Assay Matrix
For many advanced CTPs, particularly those with complex mechanisms of action like CAR-T cells, cell counting rarely stands alone as the sole potency measure. Instead, it functions as part of a comprehensive potency assay matrix that may include:
- Expression analysis (e.g., CAR expression by flow cytometry)
- Functional bioassays (e.g., cytokine release, cytotoxicity)
- Genomic assays (e.g., vector copy number) [24] [29]
This multi-attribute approach provides orthogonal verification of product quality and biological function, with cell counting serving as the foundational element that ensures proper dosing of viable cellular material.
Cell counting maintains a critical, though sometimes underestimated, role as a potency test for cell therapy products. Its prominence in regulatory submissions for approved products, combined with its direct relationship to product dosing and quality, justifies its position as an essential release parameter. The validation of cell counting methods according to ICH Q2(R1) guidelines ensures that this fundamental measurement provides the accuracy, precision, and reliability required in cGMP manufacturing. As the cell therapy field continues to evolve with increasingly complex products, cell counting will remain the bedrock upon which additional, more specialized potency measures are built, together ensuring that patients receive therapies with consistent quality and predictable biological activity.
In the development and manufacturing of cell and gene therapies, accurate cell counting is a fundamental analytical procedure critical for dosing, potency assessment, and process control. This process is governed by a framework of regulatory requirements and supplementary standards, primarily the ICH Q2(R1) validation guideline, the European Pharmacopoeia (Ph. Eur.), and the ISO 20391 cell counting standards [19] [14]. While ICH Q2(R1) provides the overarching principles for validating analytical procedures, the Ph. Eur. and ISO standards offer specific, practical guidance for implementing these principles in the context of cell counting [19] [5]. The Ph. Eur., as a legally binding document in Europe, provides specific methods and acceptance criteria, with its 10th edition including a manual hemocytometer method as a reference point [19] [7]. In parallel, the ISO 20391 series addresses the unique challenges of counting complex biological entities by providing a standardized framework for evaluating method performance, particularly in the absence of certified reference materials [14] [20]. This guide objectively compares these frameworks and their application in a Current Good Manufacturing Practice (cGMP) environment for cell-based therapies.
Core Standards Comparison and Interrelationship
The following table summarizes the key characteristics, roles, and requirements of the three core documents governing cell counting validation.
Table 1: Comparison of Core Cell Counting Standards and Guidelines
| Feature | ICH Q2(R1) | European Pharmacopoeia (Ph. Eur.) | ISO 20391 (Parts 1 & 2) |
|---|---|---|---|
| Primary Role | Regulatory guideline for validating analytical methods [19] | Legal compendium of official methods and specifications [19] | International standard for evaluating counting method performance [14] [5] |
| Status | Regulatory requirement | Legally binding in member states [19] | Voluntary technical standard |
| Key Focus | General principles for accuracy, precision, specificity, etc. [19] | Providing specific, compendial methods like the hemocytometer [19] | Statistical analysis and experimental design for counting processes [14] [20] |
| Approach to Accuracy | Direct assessment of accuracy required | Implied via use of a compendial reference method [19] | Indirect assessment via proportionality and precision in the absence of reference materials [14] [20] |
The interaction between these documents forms a complete validation strategy. ICH Q2(R1) sets the goals, the Ph. Eur. can provide a validated reference method, and ISO 20391 supplies the tools to evaluate and compare methods against that reference or to qualify a new method when no reference exists [19] [14] [20].
Figure 1: The complementary roles of ICH, Ph. Eur., and ISO standards in achieving a validated cell counting method.
Experimental Validation: An Automated vs. Manual Case Study
A pivotal study demonstrating the practical application of these standards validated an automated fluorescence-based system (NucleoCounter NC-100) against the Ph. Eur. manual hemocytometer method for counting human induced pluripotent stem cells (hiPSCs) manufactured under cGMP [19] [7]. The validation strategy was explicitly designed to comply with EudraLex cGMP regulations and ICH Q2(R1) indications [19].
Detailed Experimental Protocol
The methodology provides a template for a standards-compliant validation [19]:
- Sample Preparation: hiPSCs were expanded under defined cGMP conditions. Cells were dissociated into a single-cell suspension for counting.
- Reference & Test Methods: The manual Bürker hemocytometer (as per Ph. Eur. 10th edition) served as the reference method. The automated NucleoCounter NC-100 was the test method.
- Validation Parameters & Testing:
- Accuracy: Assessed by comparing results from the automated method against the manual reference method across a range of concentrations.
- Specificity: Evaluated the method's ability to distinguish live from dead cells using fluorescent dyes (e.g., acridine orange and propidium iodide).
- Precision:
- Intra-operator reproducibility: Multiple replicates by a single operator.
- Inter-operator reproducibility: Multiple replicates by different operators.
- Range and Linearity: Cells were serially diluted and counted to establish the concentration range over which the method provides accurate and linear results.
Key Experimental Data and Results
The study generated quantitative data demonstrating the comparative performance of the two methods, summarized in the table below.
Table 2: Experimental Performance Data from hiPSC Counting Validation Study [19]
| Performance Parameter | Manual Hemocytometer (Ph. Eur.) | Automated NC-100 System |
|---|---|---|
| Precision (Reproducibility) | Lower (Higher operator-dependent variability) | Higher (Superior intra- and inter-operator reproducibility) |
| Operational Speed | Time-consuming | Significantly faster |
| Dependence on Operator | High | Low (Automated process) |
| Overall Effectiveness for cGMP | Less effective for large-scale manufacturing | More effective, supporting clinical-scale production |
The conclusion was that the automated method showed higher precision and operational efficiency and was successfully validated for use in the cGMP manufacturing of hiPSCs, fulfilling ICH Q2(R1) criteria [19].
Implementing ISO 20391 for Method Evaluation and Comparison
The ISO 20391-2 standard provides a robust, statistical framework for evaluating cell counting method performance, which is particularly valuable when a Ph. Eur. method is unsuitable or when comparing multiple methods for "fitness-for-purpose" [14] [21] [20].
The Dilution Series Experimental Workflow
The core of the ISO 20391-2 approach is a dilution series experimental design that uses the principle of proportionality as an internal control.
Figure 2: ISO 20391-2 experimental workflow for evaluating counting method performance.
Protocol for ISO 20391-2 Compliant Study
- Sample Preparation: A homogeneous stock cell suspension is prepared. The cell type and suspension medium should reflect the intended real-world application [21] [20].
- Independent Dilution Series: A series of dilutions (e.g., 1:1, 1:2, 1:3, 1:4, 1:5) is prepared independently from the stock. Dilution integrity should be verified, for example, by using calibrated scales to measure pipetted volumes [20].
- Replication and Randomization: For each dilution level, multiple sample replicates are prepared (e.g., n=3). All samples are randomized and blinded before counting to prevent operator bias [21].
- Measurement: Each replicate is counted multiple times using the counting method(s) under evaluation.
- Statistical Analysis and Key Metrics:
The Scientist's Toolkit: Essential Reagents and Materials
The following table catalogues key materials required for executing the cell counting validation protocols described in this guide.
Table 3: Essential Research Reagent Solutions for Cell Counting Validation
| Item | Function / Description | Example Use Case |
|---|---|---|
| Bürker Hemocytometer | A glass counting chamber with a calibrated grid for manual microscopy-based cell counting. | Reference method as specified in the European Pharmacopoeia [19]. |
| Fluorescence Imaging-Based Counter | Automated instrument (e.g., NucleoCounter systems) using dyes to identify and count live/dead cells. | Validated test method for high-precision, reproducible counting in cGMP [19]. |
| Viability Stains (e.g., Acridine Orange/Propidium Iodide) | Fluorescent dyes that distinguish live (AO+, PI-) from dead (AO+, PI+) cells based on membrane integrity. | Used in automated systems for specific live/dead quantification [19] [5]. |
| Trypan Blue | A diazo dye excluded by viable cells with intact membranes; used for manual viability assessment. | Standard stain for manual hemocytometer counting [30]. |
| Appropriate Suspension Medium (e.g., PBS with HSA) | A buffer that maintains cell integrity and staining efficacy during the counting process. | Critical for accurate counts; culture medium is often preferred over saline to maintain staining [5] [21]. |
| Magnetic Beads (for Cell Therapy) | Beads used for isolating specific cell types (e.g., T-cells) from heterogeneous mixtures. | Counting in the presence of beads requires method adjustment to avoid skewing results [21]. |
Navigating the supplementary standards for cell counting reveals a cohesive, multi-tiered system. The ICH Q2(R1) guideline provides the foundational validation objectives. The European Pharmacopoeia offers established, legally recognized reference methods against which new technologies can be benchmarked. The ISO 20391 standards deliver the critical statistical tools and experimental designs to rigorously evaluate, compare, and qualify cell counting methods, especially in the absence of a reference material. For researchers and drug development professionals, the synergistic application of these standards, as demonstrated in the cited case studies, provides a robust pathway to ensuring that cell counting methods are not only validated per regulatory doctrine but are also fit-for-purpose in the complex and evolving landscape of cellular therapeutics.
From Theory to Practice: Designing and Executing Your Validation Protocol
Within the stringent framework of current Good Manufacturing Practice (cGMP), the Validation Master Plan (VMP) serves as the foundational document ensuring that all aspects of a regulated manufacturing process are well-established, documented, and controlled to guarantee consistent product quality [31]. For researchers and drug development professionals working with advanced therapies like human induced pluripotent stem cells (hiPSCs), the VMP provides the critical roadmap for qualifying facilities, equipment, and processes, and importantly, for validating essential analytical methods such as cell counting [19] [7]. This guide objectively compares cell counting methods, situating their validation within the comprehensive context of the VMP and the analytical standards of ICH Q2(R1), providing the experimental data and protocols necessary for robust, compliant implementation [18] [32] [12].
What is a Validation Master Plan (VMP)?
The Validation Master Plan (VMP), also known as a Master Validation Plan, is a high-level strategic document that functions as a central guide and roadmap for an organization's entire validation program [31] [33] [34]. It outlines the overall philosophy, approach, and activities required to demonstrate that facilities, equipment, systems, and manufacturing processes are fit for their intended purpose and capable of consistently delivering a high-quality product [33] [35].
In regulated industries, consistency and quality are mandatory, not optional. The VMP is the document that proves control over manufacturing operations to regulatory agencies like the FDA and EMA [33]. Although the FDA's 21 CFR part 210 and 211 do not formally mandate a VMP, it is often the first document an FDA inspector requests [34]. Within the European Union, a VMP is a formal regulatory requirement outlined in the EU GMP Guide, Annex 15 [34] [35]. The VMP eliminates ambiguity by forcing internal stakeholders to agree upon a unified validation strategy, thereby demonstrating a proactive, organized approach to compliance and quality [31] [34].
The Critical Link Between the VMP and Analytical Method Validation
The VMP provides the overarching structure under which specific validation activities, such as Process Validation, Cleaning Validation, and Analytical Method Validation, are planned and executed [34]. For cell-based therapies like hiPSCs, the cell count is a potency test, directly indicating the product's therapeutic dose [18]. Therefore, validating the cell counting method is not an isolated activity; it is an integral part of the control strategy for an Advanced Therapy Medicinal Product (ATMP) [19] [7]. The VMP dictates the framework for this validation, ensuring it complies with cGMP regulations and relevant guidelines, such as ICH Q2(R1) [19] [7]. This integrated approach paves the way for all cGMP facilities pursuing the manufacturing of clinically relevant cell therapies [19].
Core Components of a Validation Master Plan
A robust VMP is structured around several key components that together create a comprehensive and defensible validation program.
Validation Policy and Objectives: This section articulates the company's philosophy and commitment to validation, setting the tone for the entire document and showing regulators that quality is built into the company culture [33] [34].
Organizational Structure and Responsibilities: Clarity of roles is crucial. This component defines the structure of the validation team and outlines specific duties, from senior management providing oversight to Quality Assurance approving protocols and reports [31] [34] [35]. The team typically includes representatives from Quality Assurance, Production, Quality Control, Engineering, and Validation [34].
Facility, System, and Process Summary: The VMP provides a summary of all facilities, systems, equipment, and processes to be validated, often using a matrix to identify the required level of qualification (e.g., DQ, IQ, OQ, PQ) and validation (Process, Cleaning, Computer System) for each item [34] [35].
Validation Strategies: This is the "how" section, describing the specific methodologies for different validation types, including Process Validation, Equipment/System Qualification, Cleaning Validation, and Computer System Validation (CSV) [33] [34]. The strategy should be risk-based, focusing efforts on aspects most critical to product quality and patient safety [31] [34].
Documentation Standards and Protocols: This section establishes the rules for all validation paperwork, specifying the formats for protocols and reports and outlining the review and approval process [33] [34]. A validation protocol is a detailed plan stating how a specific validation will be conducted, including objectives, responsibilities, test methods, and acceptance criteria [34].
Change Control and Ongoing Management: The VMP is a living document. A change management process must be defined to handle revisions to the plan or validated states, ensuring the system remains in a validated state throughout its lifecycle [35].
Analytical Method Validation for Cell Counting: ICH Q2(R1) Framework
For a cell counting method to be used in the cGMP release of a drug product, it must be rigorously validated to prove it is fit for its intended purpose. The ICH Q2(R1) guideline, "Validation of Analytical Procedures: Text and Methodology," provides the internationally harmonized framework for this validation [12]. It defines the key performance characteristics that must be evaluated [32] [12].
Key Validation Parameters and Acceptance Criteria
The following parameters, as defined by ICH Q2(R1), are typically assessed for a quantitative cell counting assay [18] [32]:
- Accuracy: Expresses the closeness of agreement between the value found and a reference value. For cell counting, this is often demonstrated by comparing a new method against a reference method like the Bürker hemocytometer [18].
- Precision: This includes repeatability (intra-assay precision under the same conditions) and intermediate precision (variation between different analysts, instruments, or days). It is often measured using the percent relative standard deviation (%RSD) [32].
- Specificity: The ability to unequivocally measure the analyte (e.g., viable cells) in the presence of other components like cell debris or impurities [32].
- Linearity and Range: The ability to obtain results directly proportional to the analyte concentration within a specified range. The range is the interval between the upper and lower levels of analyte that have been demonstrated to be determined with suitable levels of precision, accuracy, and linearity [18].
- Robustness: A measure of the method's reliability when small, deliberate variations in method parameters (e.g., incubation time, dye concentration) are introduced [32].
Comparative Analysis of Cell Counting Methods
The choice of cell counting method involves a critical balance between regulatory acceptance, precision, speed, and practicality in a GMP environment. The following table provides a structured, data-driven comparison of three common methods.
Table 1: Objective Comparison of Cell Counting Methods in a GMP Context
| Feature | Bürker Hemocytometer (Manual) | Fast Read 102 (Disposable) | NucleoCounter NC-100 (Automated) |
|---|---|---|---|
| Regulatory Status | Reference method described in the European Pharmacopoeia [18] | Validated alternative method [18] | Validated alternative method [19] [7] |
| Principle | Bright-field microscopy with trypan blue exclusion [18] | Bright-field microscopy with trypan blue exclusion [18] | Fluorescence microscopy with AO/DAPI stains [19] |
| Precision (CV%) - Viable Cells | Not specified (operator-dependent) | <5% (intra-operator) [18] | Higher than manual method [19] [7] |
| Precision (CV%) - Total Cells | Not specified (operator-dependent) | <10% (intra-operator) [18] | Higher than manual method [19] [7] |
| Key Advantage | Regulatory reference standard [18] | Disposable; avoids cleaning validation and cross-contamination [18] | High precision and speed; reduced operator dependency [19] [7] |
| Key Disadvantage | Operator-dependent and time-consuming [19] [18] | Still a manual process, though simpler [18] | Software may require 21 CFR Part 11 compliance [18] |
| GMP/GLP Suitability | Suitable, but prone to human error and requires extensive training | Highly suitable, single-use simplifies compliance [18] | Highly suitable for high-throughput cGMP manufacturing [19] |
Abbreviations: CV%, Coefficient of Variation Percentage; AO, Acridine Orange; DAPI, 4',6-diamidino-2-phenylindole.
Experimental Protocols for Cell Counting Method Validation
To ensure reproducibility and regulatory acceptance, the validation of a cell counting method must follow a detailed, pre-approved protocol. The workflows below and the subsequent reagent toolkit outline the critical steps for a comparative validation study.
Workflow for Validating an Alternative Cell Counting Method
Detailed Experimental Methodology
The validation of an automated or disposable counting method typically follows a comparative approach against the pharmacopeial reference method.
Cell Sample Preparation: As demonstrated in validations for hiPSCs and mesenchymal stem cells (MSCs), the process begins with the preparation of cell samples relevant to the therapy [19] [18]. For hiPSCs, this involves culture and expansion under defined conditions. Mononuclear cells (MNCs) can be isolated from peripheral blood using a density gradient centrifugation (e.g., Hystopaque at 1.077 g/ml) [18].
Sample Dilution and Range Finding: A critical step is to prepare a series of serial dilutions of the cell sample to establish the linear range of the counting method. One study established that a dilution range between 1:8 and 1:128 was optimal for obtaining a linear slope value close to 1 [18].
Accuracy and Precision Testing: Two or more operators perform multiple counts of the same homogeneous sample using both the reference method (Bürker hemocytometer) and the alternative method (e.g., NucleoCounter NC-100 or Fast Read 102) [19] [18]. Accuracy is determined by the closeness of agreement between the two methods. Precision (repeatability and intermediate precision) is calculated from the series of measurements, expressed as the average, standard deviation, and coefficient of variation (CV%) [18]. Acceptance criteria, such as a CV of less than 10% for total cells and less than 5% for viable cells, should be pre-defined [18].
The Scientist's Toolkit: Essential Reagents and Materials
Table 2: Key Research Reagent Solutions for Cell Counting Validation
| Item | Function/Application | Example from Literature |
|---|---|---|
| Bürker Hemocytometer | Reference method for manual cell counting; a ruled glass chamber for microscopic cell enumeration [19] [18]. | Described in European Pharmacopoeia as a standard [18]. |
| NucleoCounter NC-100 | Automated, fluorescence-based cell counter; used for validated, high-precision counting in hiPSC manufacturing [19] [7]. | Validated for cGMP manufacturing of hiPSCs, showing high precision [19]. |
| Fast Read 102 Slide | A disposable cell counting chamber; eliminates cleaning and cross-contamination risks in GMP [18]. | Validated as an accurate and precise alternative to the Bürker chamber [18]. |
| Trypan Blue Dye | A vital dye used to distinguish viable (unstained) from non-viable (blue) cells in bright-field methods [18]. | Used for viability assessment in the validation of the Fast Read 102 method [18]. |
| Acridine Orange (AO) / DAPI | Fluorescent stains used in the NucleoCounter system to label total and dead cells, enabling automated viability calculation [19]. | Part of the fluorescence imaging-based system [19]. |
| Cell Culture Media | Provides the nutrient environment for growing and maintaining cell lines like hiPSCs and MSCs prior to counting [18]. | E.g., MesenCult Proliferation Kit for MSCs; specific media for hiPSCs [18]. |
| Density Gradient Medium | Used to isolate specific cell populations, such as mononuclear cells (MNCs), from complex mixtures like whole blood [18]. | E.g., Hystopaque at 1.077 g/ml density [18]. |
The journey from research to clinically applicable cell therapies is paved with rigorous quality controls, centrally guided by a Validation Master Plan. This document is not merely a regulatory formality but a powerful business tool that orchestrates all validation activities, including the critical validation of analytical methods like cell counting [31] [33]. As demonstrated, modern automated and disposable counting methods can be successfully validated per ICH Q2(R1) to show superior precision and efficiency compared to traditional manual methods, making them highly suitable for the high-stakes environment of cGMP manufacturing [19] [18] [7]. For scientists and drug developers, a well-constructed VMP, supported by scientifically sound and thoroughly documented method validations, is indispensable for ensuring that transformative advanced therapies are consistently safe, pure, and efficacious for patients.
In the field of pharmaceutical development and advanced therapy manufacturing, the reliability of analytical methods is non-negotiable. For cell counting—a critical potency test that determines product dose—method validation under Good Manufacturing Practice (GMP) guidelines provides this assurance [18]. The International Council for Harmonisation (ICH) Q2(R1) guideline forms the bedrock of this process, outlining the key parameters that must be demonstrated to prove a method is suitable for its intended use [18] [19]. This guide provides a detailed, step-by-step framework for validating three of these essential parameters—Accuracy, Precision, and Specificity—within the context of cell counting for GMP-compliant research and drug development.
The Foundation: ICH Q2(R1) and GMP
The validation of any analytical method, including cell counting, must be structured around a formal validation master plan compliant with regulatory standards [18]. The ICH Q2(R1) guideline, "Validation of Analytical Procedures," is the internationally accepted standard for this purpose [36]. It defines the various validation characteristics and provides a clear framework for their demonstration.
For Advanced Therapy Medicinal Products (ATMPs) and other cell-based products, manufacturing must comply with GMP principles, and the quality control cycle must ensure product safety and efficacy from raw materials to final release [18] [19]. In this context, the cell count is not merely a number; it is a potency test, directly linked to the product's therapeutic dose and, therefore, requires rigorous validation [18]. The objective is to generate documented evidence that the cell counting method is consistently accurate, precise, and specific.
Core Definitions: Accuracy, Precision, and Specificity
Understanding the precise definitions of these parameters is the first step toward their proper validation.
- Accuracy is defined as the closeness of agreement between the measured value and a value accepted as a conventional true value or an accepted reference value [37] [18] [36]. It measures the trueness of your results, often expressed as a percentage recovery of the known value [36].
- Precision expresses the closeness of agreement (degree of scatter) between a series of measurements obtained from multiple samplings of the same homogeneous sample under the prescribed conditions [37] [18]. It is considered at three levels:
- Repeatability (Intra-assay Precision): Precision under the same operating conditions over a short interval of time [18] [36].
- Intermediate Precision: Precision within a single laboratory, accounting for variations like different analysts, different instruments, and different days [36].
- Reproducibility: Precision between different laboratories, often assessed for method standardization [36].
- Specificity is the ability of the method to assess the analyte unequivocally in the presence of other components that may be expected to be present, such as impurities, degradants, or sample matrix [37] [36]. A specific method should yield results for the target analyte only, free from interference [37].
The relationship between accuracy and precision is best understood visually: a method can be precise (tightly clustered results) but not accurate (clustered away from the true value), or accurate (centered on the true value) but not precise (widely scattered). The goal is to be both accurate and precise.
Experimental Protocols for Validation
This section outlines detailed experimental methodologies for validating accuracy, precision, and specificity in cell counting.
Experimental Protocol for Accuracy
The accuracy of a cell counting method is typically validated by comparison against a reference method [18] [19].
Step-by-Step Procedure:
- Obtain a Reference Standard: Use a sample of cells with a known concentration, determined using a reference method. The Bürker chamber (or other hemocytometers like Neubauer) is often considered the reference method as described in the European Pharmacopoeia [18] [19].
- Prepare Serial Dilutions: Create a series of dilutions of the cell sample to cover a defined range of concentrations (e.g., low, mid, and high) [37].
- Analyze with Test Method: Count the cells in each dilution using the method being validated (e.g., the disposable Fast Read 102 device or an automated system like the NucleoCounter NC-100) [18] [19].
- Calculate % Accuracy: For each known concentration, calculate the accuracy using the formula: % Accuracy = (Measured Value / Known Value) * 100 [36].
- Establish Acceptance Criteria: The method is considered accurate if the mean recovery percentage at each concentration level falls within a pre-defined range (e.g., 80-120%). Coefficients of variation (CV) of less than 10% are often used as a benchmark [18].
Experimental Protocol for Precision
Precision is validated by repeatedly measuring the same homogeneous sample and calculating the variability.
Step-by-Step Procedure:
- Prepare a Homogeneous Cell Suspension: Ensure the sample is well-mixed to guarantee homogeneity.
- Repeatability (Intra-assay Precision):
- A single analyst performs multiple cell counts (e.g., n=6 or more) of the same sample in a single session using the same instrument [36].
- Calculate the average, standard deviation, and coefficient of variation (CV%) for the results.
- Intermediate Precision:
- Establish Acceptance Criteria: The precision is acceptable if the CV% is below a specified threshold. For cell counts, a CV of less than 10% for total cells and under 5% for viable cells has been successfully used in validation studies [18].
Experimental Protocol for Specificity
Specificity ensures that the cell count is not influenced by other components in the sample matrix.
Step-by-Step Procedure:
- Prepare a Matrix Blank: Prepare a sample that contains all the components of the sample except for the target cells (e.g., culture medium with all additives but no cells) [37].
- Analyze the Blank: Perform the cell counting procedure on the matrix blank.
- Analyze the Test Sample: Perform the count on the actual cell sample.
- Evaluate for Interference: The method is considered specific if no significant signal is detected in the matrix blank, while a clear signal is present in the test sample [37]. This demonstrates that the method is not detecting non-cellular components as false positives.
Comparative Data: Manual vs. Automated Cell Counting
The following tables summarize experimental validation data comparing traditional manual counting with emerging automated methods, as documented in published studies.
Table 1: Summary of Validated Cell Counting Methods in GMP Research
| Counting Method | Key Feature | Validation Parameters Demonstrated | Reported Performance (from cited studies) |
|---|---|---|---|
| Bürker Chamber [18] [19] | Reference method; glass, non-disposable | Accuracy (as reference), Precision, Specificity | Considered the reference standard, but operator-dependent and time-consuming [19]. |
| Fast Read 102 [18] | Disposable slide; avoids washing | Accuracy, Precision (intra/inter-operator), Linearity, Range | CV <10% (total cells); CV <5% (viable cells). Meets acceptance criteria for GMP [18]. |
| NucleoCounter NC-100 [19] | Automated, fluorescence-based | Accuracy, Specificity, Intra-/Inter-operator Reproducibility, Range, Linearity | Higher precision than manual method; faster; validated for use with hiPSCs in cGMP [19]. |
Table 2: Comparison of Performance Metrics in Validation Studies
| Validation Parameter | Manual Hemocytometer (e.g., Bürker) | Automated System (e.g., NucleoCounter) |
|---|---|---|
| Precision (CV%) | Subject to higher operator variability [19]. | Higher precision demonstrated; less dependent on operator [19]. |
| Intermediate Precision | Requires multiple analysts to validate [18]. | Validated to show high reproducibility between operators [19]. |
| Specificity | Relies on analyst's ability to distinguish cells from debris. | Often uses fluorescent dyes (e.g., for viability) for enhanced specificity [19]. |
| Throughput | Time-consuming [19]. | Rapid, enabling higher throughput in quality control [19]. |
The Scientist's Toolkit: Essential Research Reagents & Materials
The following materials are essential for executing the validation protocols described above.
Table 3: Essential Materials and Reagents for Cell Counting Validation
| Item | Function / Description | Example Use in Validation |
|---|---|---|
| Cell Counting Chamber | Device for microscopically visualizing and counting cells. | Bürker chamber as a reference method [18]; disposable Fast Read 102 as an alternative [18]. |
| Vital Dye (e.g., Trypan Blue) | Stains non-viable cells with compromised membranes. | Used to assess cell viability simultaneously with total cell count, a key aspect of potency [18]. |
| Lysing Solution (e.g., Tuerk Solution) | Lyses red blood cells in samples like whole blood or bone marrow. | Validates specificity and accuracy in complex matrices by removing interfering cells [18]. |
| Automated Cell Counter | Instrument that automates sample preparation and/or analysis. | NucleoCounter NC-100 system, validated for higher precision and speed in cGMP settings [19]. |
| Reference Cell Sample | A homogeneous cell suspension with a characterized concentration. | Serves as the "known value" for accuracy experiments and for preparing serial dilutions [37]. |
Workflow and Logical Diagrams
The following diagram illustrates the logical sequence and decision points in the analytical method validation process for cell counting.
Diagram 1: Analytical method validation workflow.
The validation of precision involves multiple tiers of testing, as shown in the workflow below.
Diagram 2: Precision validation breakdown.
Validation of accuracy, precision, and specificity is a mandatory, non-negotiable component of developing a GMP-compliant cell counting method. As demonstrated, this process requires a meticulous, step-by-step experimental approach guided by the ICH Q2(R1) framework. The comparative data shows that while manual methods like the Bürker chamber serve as a foundational reference, modern disposable and automated systems can offer enhanced precision, efficiency, and robustness, making them increasingly suitable for the high-stakes environment of advanced therapy manufacturing. By adhering to these structured protocols, scientists and drug development professionals can ensure the reliability of their potency data, thereby safeguarding product quality and patient safety.
In the context of Current Good Manufacturing Practice (cGMP) for Advanced Therapy Medicinal Products (ATMPs), the validation of analytical methods is not merely a regulatory formality but a fundamental requirement to ensure product quality, safety, and efficacy. Human induced pluripotent stem cells (hiPSCs) and other cell-based therapies must be manufactured as ATMPs meeting stringent cGMP requirements, where large-scale cell expansion necessitates reliable and accurate cell counting methods for dose determination [19] [7]. The International Council for Harmonisation (ICH) Q2(R1) guideline defines linearity as the ability of an analytical procedure to obtain test results directly proportional to the concentration (amount) of analyte in the sample within a given range. The range is the interval between the upper and lower concentration of analyte for which suitable levels of precision, accuracy, and linearity have been demonstrated. For cell counting — a critical potency test — establishing linearity and range validates that the method provides accurate cell concentration measurements across the entire spectrum of concentrations encountered during production and quality control, from dilute starting materials to concentrated final products [18]. This guide objectively compares different cell counting methods and provides detailed experimental protocols for establishing their linearity and range, supporting robust method validation within a cGMP framework.
Method Comparison: Manual vs. Automated Cell Counting
The conventional reference method for cell counting, often described in pharmacopeias such as the European Pharmacopoeia, is manual counting using a hemocytometer (e.g., Bürker chamber). However, this method is highly dependent on operator expertise and is time-consuming, creating a bottleneck in cGMP manufacturing [19] [7]. Automated systems, such as fluorescence imaging-based counters (e.g., NucleoCounter NC-100), have emerged as alternatives promising improved precision and speed. The table below summarizes a comparative performance validation study conducted under cGMP regulations for ATMP manufacturing.
Table 1: Performance Comparison of Manual vs. Automated Cell Counting Methods
| Performance Characteristic | Manual Hemocytometer (Bürker) | Automated NucleoCounter NC-100 | Validation Guidelines |
|---|---|---|---|
| Accuracy | Accepted reference method [18] | Demonstrated agreement with the reference method [19] [7] | ICH Q2(R1), EudraLex cGMP |
| Precision (Reproducibility) | Lower precision; higher operator dependency [19] | Higher intra- and inter-operator reproducibility [19] [7] | ICH Q2(R1) |
| Linearity and Range | Can be linear within a defined range [18] | Validated linear range demonstrated [19] [7] | ICH Q2(R1) |
| Specificity | Relies on dye exclusion (e.g., Trypan Blue) | Fluorescence imaging-based; can offer enhanced specificity [7] | ICH Q2(R1) |
| Throughput | Time-consuming [19] [7] | Faster analysis [19] [7] | N/A |
| GMP Suitability | Manual process, prone to contamination risks [18] | Disposable slides available; reduces contamination [18] | EU GMP Guidelines |
Experimental Design for Method Comparison and Linearity Assessment
A robust method comparison study is critical for assessing the systematic error, or bias, between a new (test) method and a comparative method. The following section outlines the key experimental protocols for such a study.
The Comparison of Methods Experiment
The primary purpose of this experiment is to estimate the inaccuracy or systematic error of the test method (e.g., an automated counter) against a comparative method (e.g., manual hemocytometer) using real patient or process specimens [38].
Key Design Factors:
- Comparative Method: When possible, a pharmacopeial reference method (e.g., Bürker chamber) should be used. This allows any significant differences to be attributed to the test method. If a routine method is used, discrepancies require careful interpretation and further investigation [38].
- Sample Size and Selection: A minimum of 40 different patient specimens is recommended, with 100-200 being preferable to identify sample-specific interferences. The samples must be carefully selected to cover the entire working range of the method and represent the expected sample matrix [38] [39].
- Replication and Timing: While single measurements are common, performing duplicate measurements helps identify outliers and transposition errors. The experiment should be conducted over a minimum of 5 days and multiple analytical runs to account for day-to-day variability [38] [39].
- Sample Stability: Specimens should be analyzed by both methods within two hours of each other to prevent stability-related discrepancies. Sample handling procedures must be standardized prior to the study [38].
The following workflow diagram illustrates the key stages of a method comparison study:
Experimental Protocol for Linearity and Range
This protocol assesses whether the cell counting method produces results directly proportional to the true cell concentration over a claimed range. The core technique involves preparing a series of sample dilutions from a concentrated stock.
Step-by-Step Dilution Scheme:
- Prepare a Concentrated Cell Stock: Begin with a high-density, homogeneous cell suspension whose viability and concentration have been preliminarily estimated.
- Design a Serial Dilution Series: Prepare a sequence of dilutions covering the entire anticipated range of concentrations for the method. A 1:2 or 1:3 serial dilution is often suitable. The goal is to achieve a final test range that, for example, for a device like the Fast Read 102, might be optimal between 1:8 and 1:128 dilution [18].
- Perform Dilutions Accurately: Use precise pipetting and the principle of Dilution Factors (DF). The formula
Final Volume / Solute Volume = DFis used to calculate volumes. For a 1:10 dilution, 1 part of cell stock is added to 9 parts of diluent (e.g., 20 μL cells + 180 μL buffer) [40]. - Count Cells in Each Dilution: Analyze each dilution in the series using the test method (and the comparative method, if part of a broader validation). Ensure sample stability is maintained throughout the analysis period.
- Analyze Data: Plot the measured cell concentration (or the calculated concentration based on the dilution factor) against the expected cell concentration (or dilution factor). The resulting plot and statistical analysis (e.g., double logarithm function linear fitting as per recent research [41]) are used to evaluate linearity.
Table 2: Example of a 7-Point 1:2 Serial Dilution Scheme for a Linearity Study
| Point | Description | Dilution Factor | Move Volume | Diluent Volume | Total Mixing Volume | Notes |
|---|---|---|---|---|---|---|
| 1 | Neat (Initial Stock) | 1:1 (Neat) | - | - | 240 μL | Starting point, no dilution [40] |
| 2 | First Dilution | 1:2 | 120 μL | 120 μL | 240 μL | Dilute Point 1 1:1 with diluent [40] |
| 3 | Second Dilution | 1:4 | 120 μL | 120 μL | 240 μL | Dilute Point 2 1:1 with diluent [40] |
| 4 | Third Dilution | 1:8 | 120 μL | 120 μL | 240 μL | - |
| 5 | Fourth Dilution | 1:16 | 120 μL | 120 μL | 240 μL | - |
| 6 | Fifth Dilution | 1:32 | 120 μL | 120 μL | 240 μL | - |
| 7 | Sixth Dilution | 1:64 | 120 μL | 120 μL | 240 μL | - |
Note: This table is adapted from the dilution calculations explained in [40]. Volumes include an excess to compensate for pipetting error and allow for duplicate testing.
Data Analysis and Interpretation
Graphical and Statistical Assessment
The first step in analyzing data from a linearity or method comparison study is graphical inspection [38] [39].
- Scatter Plots: Plot the test method results (y-axis) against the comparative method results (x-axis). This helps visualize the analytical range, linearity of response, and the general relationship between methods. Visually inspect for outliers and ensure the data covers the entire measurement range without gaps [39].
- Difference Plots (Bland-Altman): Plot the difference between the test and comparative method results (y-axis) against the average of the two results (x-axis). This plot is excellent for visualizing the agreement between methods, identifying constant bias, and seeing if the bias changes with the concentration level [39] [42].
After graphical inspection, calculate appropriate statistics to quantify the observed errors [38].
- Linear Regression: For data covering a wide analytical range, linear regression (e.g.,
Y = a + bX) is used to quantify the relationship. The slope (b) indicates a proportional error (a value of 1 indicates no proportional bias), and the y-intercept (a) indicates a constant error (a value of 0 indicates no constant bias). The systematic error (SE) at a critical decision concentration (Xc) can be calculated asSE = (a + b*Xc) - Xc[38]. - Correlation Coefficient (r): The correlation coefficient is primarily useful for verifying that the data range is wide enough to provide reliable estimates of the slope and intercept. An r value ≥ 0.99 is often sought, but a high r value alone does not prove method comparability, as it only measures the strength of a linear relationship, not the agreement [38] [39].
- Alternative Methods: For narrow concentration ranges or specific applications, other statistical approaches like Passing-Bablok regression or the double logarithm function linear fitting may be more appropriate. The latter method, which involves taking the logarithm of both the test and reference values before linear fitting, has been proposed as a more rigorous way to demonstrate the degree of data proportionality required by the ICH Q2 definition of linearity [41].
The Scientist's Toolkit: Essential Research Reagent Solutions
The successful execution of a validation study requires specific materials and reagents. The following table details key items and their functions.
Table 3: Essential Reagents and Materials for Cell Counting Validation
| Item | Function in Validation | Example Products / Types |
|---|---|---|
| Cell Counting Chamber | The platform for microscopic cell enumeration. Disposable chambers reduce contamination risk and cleaning validation needs. | Bürker chamber (reference method [18]), Fast Read 102 [18], Neubauer chamber |
| Vital Dye | Distinguishes viable from non-viable cells based on membrane integrity. Critical for assessing accuracy in viability counting. | Trypan Blue [18] |
| Lysing Solution | Lyses red blood cells in samples like whole blood or bone marrow to allow accurate counting of nucleated cells. | Tuerk solution [18] |
| Dilution Buffer | A compatible buffer (e.g., PBS) used to create serial dilutions for linearity and range studies. Maintains cell stability during testing. | Phosphate Buffered Saline (PBS) [18] |
| Automated Cell Counter | An instrument that automates cell counting and viability analysis, often offering improved precision and throughput. | NucleoCounter NC-100 (fluorescence-based [19] [7]) |
Establishing linearity and range is a foundational element of analytical method validation for cell counting in cGMP-compliant ATMP manufacturing. While traditional manual hemocytometers remain the pharmacopeial reference standard, automated systems offer demonstrated advantages in precision, reproducibility, and operational efficiency, making them highly suitable for the rigorous demands of clinical-grade cell production [19] [7]. A successful validation strategy requires a meticulously planned experimental design, incorporating a sufficient number of samples across the relevant concentration range, a well-executed dilution scheme, and a thorough data analysis plan that combines graphical techniques with appropriate statistical methods. By adhering to these principles and protocols, researchers and drug development professionals can robustly validate cell counting methods, ensuring the reliability of potency measurements and ultimately contributing to the quality and safety of advanced cell therapies.
In the field of advanced therapy medicinal products (ATMPs), such as cell-based therapies, determining accurate cell count and viability is a critical potency test essential for ensuring product safety and efficacy [26]. This process must comply with Good Manufacturing Practice (GMP) guidelines and the International Conference on Harmonisation (ICH) Q2(R1) validation principles [26] [19]. For researchers and drug development professionals, selecting an appropriate cell counting method involves balancing regulatory compliance, practical efficiency, and analytical performance.
The Fast Read 102 is a disposable plastic counting chamber that offers a potential solution to some challenges posed by traditional methods. This case study objectively compares its performance against other counting alternatives, supported by experimental data, and frames the discussion within the broader context of validating analytical methods according to GMP and ICH Q2 R1 standards.
Fast Read 102 Disposable Chamber
The Fast Read 102 is a single-use, manual counting slide made of PMMA (methacrylate) [43] [44]. Each slide contains 10 independent counting chambers, each with a standard volume of 7 µL and a depth of 0.1 mm [45] [43] [44]. The grid in each chamber consists of 10 large squares (1x1 mm each), further subdivided to facilitate counting [45] [46]. Its primary advantages include elimination of cleaning, reduced cross-contamination risk, and compliance with single-use requirements in clean environments like Cell Factories [26] [46].
Common Counting Alternatives
- Traditional Hemocytometers (e.g., Bürker Chamber): The reference method described in the European Pharmacopoeia [26] [19]. These are non-disposable, glass chambers (e.g., Bürker, Neubauer) that require careful cleaning and pose a risk of carryover contamination [26].
- Automated Cell Counters (e.g., NucleoCounter NC-100): Fluorescence imaging-based systems that automate sample preparation and analysis [19]. These offer higher throughput but require software compliance with 21 CFR Part 11 and a more significant initial investment [26] [19].
Experimental Validation & Performance Comparison
Validation Framework and Protocol
To be utilized in a GMP setting, any analytical method must undergo a formal validation process. The validation of the Fast Read 102 for cell therapy products (CTPs) was designed in accordance with ICH Q2 guidelines, assessing the following performance characteristics [26]:
- Accuracy: Closeness of agreement between the value found and the value accepted as a conventional true value.
- Precision: Closeness of agreement between a series of measurements (including intra-assay repeatability).
- Linearity: The ability to obtain test results directly proportional to the analyte concentration within a given range.
The experimental workflow for the validation study is summarized in the diagram below.
Cell Products and Reagents: The validation utilized two distinct cell types relevant to therapy: Mononuclear Cells (MNCs) isolated from peripheral blood for immunotherapy, and Mesenchymal Stem Cells (MSCs) isolated from bone marrow for regenerative medicine [26]. Viability was assessed using Trypan Blue dye, while total cell counts from whole blood or bone marrow employed Tuerk solution as a lysing agent [26].
Procedure: The accuracy was first evaluated by comparing the Fast Read 102 directly against the Bürker chamber. Once accuracy was confirmed, further tests for precision and linearity were conducted exclusively using the Fast Read 102. Two operators performed multiple counts to determine intra- and inter-operator precision. Linearity was assessed by counting a series of sample dilutions to find the optimal range [26].
The following table synthesizes the key quantitative findings from the validation study, comparing the performance of the Fast Read 102 against the reference method and an automated alternative.
| Validation Parameter | Fast Read 102 (Manual) | Bürker Chamber (Manual Reference) | Automated Counter (e.g., NC-100) |
|---|---|---|---|
| Accuracy | Demonstrated agreement with Bürker chamber [26] | Reference method per European Pharmacopoeia [26] [19] | Validated against manual reference method [19] |
| Precision (CV) | <10% (total cells); <5% (viable cells) [26] | Subject to operator expertise; more variable [19] | Higher precision than manual methods [19] |
| Linearity Range | Optimal in 1:8 to 1:128 dilution range [26] | Information missing | Validated for specific hiPSC concentrations [19] |
| Key Advantage | Disposable; no cleaning; reduces contamination [26] [46] | Regulatory standard [26] | High speed; minimal operator dependency [19] |
| GMP Compliance | Validated for GMP; avoids waste disposal issues [26] [46] | Compliant, but cleaning validation required [26] | Software must comply with 21 CFR Part 11 [26] |
Interpretation of Validation Data
The data confirms that the Fast Read 102 method is accurate, precise, and linear within the identified range, meeting all pre-defined acceptance criteria for a GMP quality control method [26]. The coefficient of variation (CV) for precision was under the strict threshold of 10% for total cells and 5% for viable cells, indicating excellent repeatability [26]. The established linear range (1:8 to 1:128 dilution) ensures that results are proportional to the true cell concentration, which is vital for calculating accurate cell doses for therapy.
The Scientist's Toolkit: Essential Reagents and Materials
The table below lists key materials and reagents required for performing a validated cell count, as featured in the cited experiments.
| Item | Function / Description |
|---|---|
| Fast Read 102 Slide | Disposable 10-chamber slide for manual cell counting; standardizes volume and eliminates cleaning [26] [46]. |
| Bürker Chamber | Non-disposable glass hemocytometer; the reference method described in the European Pharmacopoeia [26]. |
| Trypan Blue Dye | Vital dye used to stain non-viable cells for viability assessment in cell therapy products [26]. |
| Tuerk Solution | Lysing solution used to eliminate red blood cells for total nucleated cell counts in whole blood/bone marrow [26]. |
| NucleoCounter NC-100 | Example of an automated, fluorescence-based cell counter; offers higher throughput and reduced operator variation [19]. |
This case study demonstrates that the Fast Read 102 disposable chamber is a viable and well-validated method for cell counting in a GMP environment. Its validation package, which adheres to ICH Q2 principles, shows it provides comparable accuracy to the traditional Bürker chamber while offering significant practical advantages in terms of contamination control and operational efficiency [26].
The choice between a disposable manual chamber, a traditional hemocytometer, or an automated system depends on the specific needs of the manufacturing facility. For GMP facilities prioritizing single-use systems and minimizing cross-contamination, the Fast Read 102 presents a robust solution. For projects requiring high-throughput and minimal operator influence, automated systems, despite higher initial cost and software validation overhead, may be more suitable [19]. Ultimately, this validation underscores that modern, disposable counting devices can fully meet the rigorous standards required for the production of advanced therapeutic medicinal products.
In the field of advanced therapy medicinal products (ATMPs), such as those derived from human induced pluripotent stem cells (hiPSCs), determining accurate cell count and viability is a critical potency test that directly impacts product dosing, quality, and efficacy [19] [18]. For manufacturing these products under current Good Manufacturing Practice (cGMP) regulations, the validation of analytical methods like cell counting is not merely beneficial—it is a mandatory requirement [47] [7]. This case study details the validation of the NucleoCounter NC-100, an automated fluorescence-based cell counting system, for cGMP manufacturing of hiPSCs, following the International Conference on Harmonisation (ICH) Q2(R1) guideline on the validation of analytical procedures [19] [47].
The conventional method for cell counting, the manual hemocytometer, is the reference method described in the European Pharmacopoeia [18] [47]. However, this method is heavily dependent on operator expertise, is time-consuming, and difficult to standardize, leading to significant variability [19] [47]. Automated cell counting systems offer a solution by reducing analyst-dependent variability and analysis time, providing a methodology that can be robustly validated to serve as an official analytical procedure for ATMP manufacturing [47].
Experimental Design and Validation Protocol
Aim and Validation Strategy
The primary aim of the validation study was to demonstrate that the NucleoCounter NC-100 system is a precise, accurate, and reliable alternative to the manual Bürker hemocytometer for counting hiPSCs in a cGMP-compliant environment [47]. The validation strategy was designed in compliance with:
- ICH Q2(R1) guideline on the validation of analytical procedures.
- EudraLex cGMP regulations, specifically Volume 4, Annex 15, and Part IV covering GMP requirements for ATMPs.
- Relevant parts of the European Pharmacopoeia (10th ed.) and ISO 20391 (Biotechnology - Cell counting) [19] [47].
Instrumentation and Sample Preparation
- Test System: The proposed method was the fluorescence imaging-based NucleoCounter NC-100 system (ChemoMetec) [19] [47]. Its principle is based on the use of propidium iodide (PI), a fluorescent DNA-binding dye that is excluded by viable cells with intact membranes. Non-viable cells with compromised membranes incorporate PI, allowing the instrument to distinguish and count them separately [47].
- Reference System: The reference method was manual cell counting using a Bürker hemocytometer under a microscope. Viable cells were identified and counted based on morphology in bright field [47].
- Biological Material: The validation was conducted using research-grade hiPSC batches (n=3) to account for biological variability. The hiPSCs were expanded and then harvested into a single-cell suspension using accutase before being resuspended in PBS for counting [47].
- Personnel: The study involved two analysts to assess inter-operator reproducibility [47].
The workflow for the validation process, from sample preparation to data analysis, is illustrated below.
Validation Parameters and Experimental Protocols
The validation focused on key parameters as defined by ICH Q2(R1). The specific experimental protocols for each parameter are detailed below.
- Accuracy: This was determined by comparing the cell count results from the NucleoCounter NC-100 with those from the reference Bürker hemocytometer. The agreement between the value found and the reference value was assessed [18] [47].
- Precision: This was evaluated at two levels:
- Repeatability (Intra-assay Precision): The same homogeneous hiPSC sample was analyzed multiple times in a single run by the same operator under the same conditions [18] [47].
- Intermediate Precision (Inter-operator Reproducibility): The same homogeneous hiPSC sample was analyzed by two different analysts on different days to assess the impact of variations in operator and time [47].
- Specificity: The ability of the method to unequivocally assess the analyte (viable cells) in the presence of other components was tested. The sample matrix (PBS) was analyzed to ensure no interfering particles were mistakenly counted as cells [47].
- Linearity and Range: The linearity of the method was tested by analyzing hiPSC samples at a series of dilutions (e.g., from 1:8 to 1:128) to confirm that the results obtained are directly proportional to the concentration of cells in the sample within a specified range (e.g., 5,000–2,000,000 cells/mL for the NC-100) [18] [47].
Key Findings and Performance Data
The validation study demonstrated that the automated NucleoCounter NC-100 system met all predefined acceptance criteria for the key parameters as per ICH Q2(R1). The following table summarizes the core findings of the validation study, presenting a direct comparison between the NucleoCounter NC-100 and the manual hemocytometer method.
Table 1: Summary of Validation Results for NucleoCounter NC-100 vs. Manual Hemocytometer
| Validation Parameter | NucleoCounter NC-100 Performance | Manual Hemocytometer Performance | Key Outcome |
|---|---|---|---|
| Accuracy | High agreement with reference method [47]. | Used as the reference value [47]. | Method is accurate for hiPSC counting [47]. |
| Precision (Repeatability) | Higher precision; lower Coefficient of Variation (CV) [19] [47]. | Lower precision; higher CV due to operator subjectivity [19] [47]. | Automated method is more reproducible and robust [19]. |
| Intermediate Precision (Inter-operator) | Higher reproducibility between different analysts [47]. | Significant variation between different operators [19] [47]. | Reduces operator-dependent variability in GMP setting [47]. |
| Linearity | Demonstrated linearity within the specified range [47]. | Linearity can be affected by counting errors [18]. | Results are proportional to cell concentration [47]. |
| Range | Reliable range: 5,000–2,000,000 cells/mL [47]. | Reliable range: ~50,000–550,000 cells/mL [47]. | Wider operational range for the automated system [47]. |
| Specificity | Specific for viable cells using PI fluorescence [47]. | Based on morphology, potential for misidentification [47]. | Fluorescence-based method reliably distinguishes viable/dead cells [47]. |
Advantages in a cGMP Environment
The quantitative data confirms several operational advantages for the NucleoCounter NC-100 in a cGMP environment:
- Standardization and Reduced Variability: The automated system minimizes the "human error and bias" inherent in manual counting, where differences in pipetting, counting technique, and interpretation lead to high user-to-user variation [47] [48].
- Enhanced Traceability and Data Integrity: Unlike the manual method, which leaves "no electronic record," automated systems like the NC-100 can generate and archive PDF reports with critical data, supporting data integrity principles in GMP. With optional 21 CFR Part 11 compliant software, they provide secure audit trails and user access controls [49].
- Improved Efficiency: The automated workflow is "faster" and less "time-consuming" than the "laborious" manual process, which is critical for the large-scale cell expansion required for hiPSC-based therapies [19] [49].
Comparison with Alternative Cell Counting Technologies
While this case study focuses on the fluorescence-based NucleoCounter, other automated cell counting technologies are available. The choice of technology depends heavily on the specific application, cell type, and regulatory needs [50].
Table 2: Comparison of Automated Cell Counting Technologies
| Technology | Principle | Pros | Cons | Suitability for GMP |
|---|---|---|---|---|
| Fluorescence-Based Image Cytometry (e.g., NucleoCounter) | Fluorescent staining of cells (e.g., with PI) and digital imaging [48]. | High accuracy for viability; precise; low operator bias; often designed with GMP compliance in mind [47] [49]. | Requires fluorescent dyes (consumable cost) [50]. | High. Proven and validated for cGMP manufacturing of ATMPs [19] [47] [49]. |
| Brightfield Image Cytometry | Digital imaging of cells without fluorescence, often using contrast agents [50]. | No fluorescent dye required; can be faster and cheaper per sample [50]. | Lower accuracy for viability with clumpy cells or debris; relies on morphology [48]. | Moderate. May require extensive validation for complex cell products. |
| Electrical Impedance (Coulter Principle) | Cells passing through an aperture cause a change in electrical resistance [48]. | Precise particle count and size; no staining needed [48]. | Cannot count aggregated cells; low accuracy for viability; coincidence errors [48]. | Low. Unsuitable for cell aggregates and poor viability assessment limits its use for many ATMPs. |
| Flow Cytometry | Laser light scattering and fluorescence as cells pass in a fluid stream [48]. | High-throughput; multi-parameter analysis [48]. | Tedious sample prep; slow for simple counts; complex instrumentation; high cost [48]. | Moderate to High. Excellent for characterization, but often over-specified for routine cell counting and dosing. |
The relationship between different cell counting methods and their core characteristics can be visualized as follows.
The Scientist's Toolkit: Essential Reagents and Materials
The successful validation and implementation of an automated fluorescence-based cell counting method rely on a set of essential materials.
Table 3: Key Research Reagent Solutions for Validation
| Item | Function in Validation | Example from Case Study |
|---|---|---|
| Fluorescence-Based Cell Counter | The core instrument for the proposed automated method. Must undergo Installation, Operational, and Performance Qualification (IQ/OQ/PQ). | NucleoCounter NC-100 or NC-202 [47] [49]. |
| Reference Hemocytometer | The reference method against which accuracy is assessed, as per pharmacopeial standards. | Bürker chamber [47]. |
| Viability Fluorescent Dye | A dye that selectively stains non-viable cells for the automated count. It is the basis for specificity. | Propidium Iodide (PI) [47]. |
| Validated Cell Line | A biologically relevant cell type used to perform the validation. Multiple batches account for variability. | Human induced pluripotent stem cells (hiPSCs) [47]. |
| Sample Preparation Reagents | Enzymes and buffers used to create a high-quality single-cell suspension for analysis. | Accutase, Dulbecco's Phosphate Buffered Saline (d-PBS) [47]. |
| IQ/OQ/PQ Kits | Standardized materials used to formally qualify instrument performance before and during the validation. | Commercially available kits (e.g., from ChemoMetec) [49]. |
This case study demonstrates that the NucleoCounter NC-100 automated fluorescence-based system can be successfully validated for counting hiPSCs in accordance with ICH Q2(R1) and cGMP requirements. The data shows it is a more precise, reproducible, and efficient method compared to the traditional manual hemocytometer [19] [47]. For researchers and drug development professionals, this validation provides a clear roadmap for implementing automated cell counting in regulated environments. It paves the way for more reliable and standardized quality control in the manufacturing of advanced cell therapies, ensuring that critical parameters like cell dose—a direct measure of product potency—are determined with the highest level of confidence [18] [47].
Solving Common Challenges: From Sample Variability to Data Integrity
Addressing Inherent Variability in Starting Materials and Biological Samples
In the development and manufacturing of cell-based therapies, accurate cell counting is a critical potency assay that directly impacts dosing, process control, and final product quality. The inherent biological variability of starting materials, such as primary cells from different donors, presents a significant challenge for obtaining reliable and consistent cell counts [51]. This guide objectively compares the performance of different cell counting methods, focusing on their validation according to ICH Q2(R1) principles and their ability to manage variability in a Good Manufacturing Practice (GMP) environment [18] [19] [7].
Performance Comparison of Cell Counting Methods
The table below summarizes key performance characteristics of different cell counting methods, based on validation data from published studies.
| Counting Method | Precision (CV) | Linearity (Range) | Key Advantages | Key Limitations | Applicable Standards |
|---|---|---|---|---|---|
| Disposable Hemocytometer (Fast Read 102) | <10% (total cells); <5% (viable cells) [18] | 1:8 to 1:128 dilution [18] | Disposable; reduces cross-contamination; suitable for clean rooms [18] | Manual process; potential for human error [52] | ICH Q2(R1), European Pharmacopoeia [18] |
| Automated Fluorescence Imager (NucleoCounter NC-100) | Higher precision than manual method [19] [7] | Validated for hiPSCs [7] | High precision; faster than manual; reduced operator dependency [19] | Requires specific fluorescent stains; instrument cost [19] | ICH Q2(R1), cGMP for ATMPs [19] [7] |
| Traditional Hemocytometer (Bürker) | Lower precision than automated methods [19] | Reference method in European Pharmacopoeia [18] [19] | Low cost; widely recognized [52] [53] | Time-consuming; high operator dependency; requires cleaning [18] [52] [19] | ICH Q2(R1), European Pharmacopoeia [18] |
| Flow Cytometry | Capable of highly accurate counts [52] | N/A | Can distinguish cell types by markers; high information content [52] | Expensive; complex setup; not dedicated to counting [52] | ISO 20391 [14] |
| Coulter Counter | Accurate for cells of differing sizes [52] | N/A | Fast; good for blood cells; measures cell size [52] | Cannot distinguish live/dead cells; requires more maintenance [52] | N/A |
Experimental Protocols for Method Evaluation and Validation
Protocol 1: Validation of a Disposable Hemocytometer per ICH Q2(R1)
This protocol, used to validate the Fast Read 102 device, follows ICH Q2(R1) guidelines for accuracy, precision, and linearity [18].
- 1. Cell Preparation: Isolate two distinct cell types, such as mononuclear cells (MNCs) from peripheral blood and mesenchymal stem cells (MSCs) from bone marrow, to assess method performance across different morphologies [18].
- 2. Accuracy Assessment: Compare the cell count results from the disposable device against the reference method (a Bürker chamber) using the same cell suspension samples [18].
- 3. Precision (Repeatability) Testing: Have a single operator perform multiple cell counts on the same homogeneous sample to calculate intra-assay precision. The coefficient of variation (CV) for viable cell counts should be below 5% [18].
- 4. Intermediate Precision: Have a second operator repeat the counting process with independently prepared samples to assess inter-operator variability [18].
- 5. Linearity and Range Evaluation: Create a series of sample dilutions. The optimal range is identified where the slope of the line comparing expected versus observed counts is closest to 1 (e.g., between 1:8 and 1:128 dilutions) [18].
Protocol 2: Dilution Series Design for Quality Evaluation (ISO 20391-2)
This standardized protocol evaluates counting method performance in the absence of a reference material, using proportionality as an internal control [14] [20].
- 1. Sample Preparation: Begin with a well-mixed, concentrated cell suspension. For complex samples, such as T cells with attached magnetic beads, this step is critical for accurate counting [21].
- 2. Independent Dilution Series: Create a dilution series (e.g., 1:1, 1:2, 1:3, 1:4, 1:5) through independent dilution steps from the stock solution to minimize pipetting error propagation [21] [20].
- 3. Replication and Randomization: For each dilution level, prepare multiple sample replicates (e.g., n=3). Assign random IDs to all sample tubes to eliminate counting bias [21].
- 4. Counting and Data Collection: Count each replicate sample multiple times (e.g., 3 times) using the method under evaluation [21].
- 5. Statistical Analysis: Calculate quality indicators [20]:
- Precision: The Coefficient of Variation (%CV) across replicate observations.
- Proportionality: The Proportionality Index (PI) and coefficient of determination (R²) to quantify how linearly the count results respond to dilution.
Figure 1: Experimental workflow for evaluating cell counting method performance using a dilution series design according to ISO 20391-2.
The Scientist's Toolkit: Key Reagents and Materials for Cell Counting
The table below lists essential reagents and materials used in cell counting workflows for cell therapy manufacturing.
| Item | Function / Application | Example Use in Context |
|---|---|---|
| Hemocytometer | A glass or disposable slide with a gridded chamber of known volume for manual microscopic cell counting. | Bürker chamber is the reference method in the European Pharmacopoeia; disposable Fast Read 102 avoids cleaning and cross-contamination [18]. |
| Trypan Blue | A vital dye excluded by live cells with intact membranes; used to distinguish live from dead cells. | Mixed with cell suspension in a 1:1 ratio for viability assessment in manual hemocytometer counts [52] [53]. |
| Acridine Orange / Propidium Iodide | Fluorescent stains for automated cell counters. Acridine orange stains all nuclei, while propidium iodide stains nuclei of dead cells. | Used in fluorescent automated counters (e.g., Luna-FL, NucleoCounter) for superior live/dead discrimination [52] [19]. |
| Lysis Buffer (e.g., Tuerk Solution) | A solution that lyses red blood cells without harming nucleated cells, simplifying counts in whole blood samples. | Used when counting mononuclear cells isolated from whole blood or bone marrow [18]. |
| Magnetic Beads | Beads coated with antibodies for positive or negative selection of specific cell types (e.g., T cells). | Their presence on cells can interfere with some automated counting algorithms, necessitating method suitability testing [21]. |
| Reference Cells | A stable, well-characterized cell bank used as an in-house control to qualify instrument operation and measurement consistency over time. | Provides measurement assurance and helps monitor long-term performance of the counting process [51]. |
Selecting and validating a cell counting method for GMP requires a fit-for-purpose strategy that acknowledges and manages biological and technical variability. Manual methods, while established, show higher operator dependency and lower precision. Automated and disposable methods offer enhanced precision, reduced contamination risk, and better alignment with cGMP needs for advanced therapies [18] [19] [7]. The integration of ICH Q2(R1) principles with modern standards like ISO 20391-2 provides a powerful, standardized framework for qualifying these methods, ensuring that cell counts—and the critical decisions based on them—are made with confidence [14] [20].
In the development and quality control of cell therapy products, accurate cell counting is a critical potency test that directly influences dosing, therapeutic efficacy, and patient safety [5] [26]. The complexity of cell preparations—often comprising heterogeneous cell populations, debris, and various suspension media—poses significant challenges for obtaining reliable counts [5]. This guide objectively compares sample preparation strategies across counting methods, providing experimental data framed within the rigorous requirements of GMP and ICH Q2(R1) validation, which mandates assessments of accuracy, precision, linearity, and range for analytical procedures [26] [19].
Critical Factors in Sample Preparation
Sample preparation is a foundational step that significantly influences counting accuracy. Key considerations include:
Suspension Medium Selection: The choice of medium substantially impacts stain performance and cell visibility. Culture medium is generally preferred over salt solutions like PBS or saline, which can reduce stained cell counts by nearly 40%. Cryoprotectants like DMSO can also interfere with fluorescent dyes such as acridine orange, leading to underestimation of cell concentration and viability [5].
Cell Debris Management: Cellular debris common in cell preparations can obscure accurate identification and lead to overestimation or underestimation. Debris removal techniques are often necessary to ensure result integrity [5].
Operator Training and Standardization: Continuous operator training is essential for maintaining consistent cell counting results, as reliance on operator judgment contributes significantly to variability in manual methods [14] [54].
Sampling and Staining Strategy Optimization
Staining Method Selection
The selection of an appropriate staining method depends on the counting objectives and the specific characteristics of the cell sample.
Table 1: Comparison of Common Staining Methods for Cell Counting
| Staining Method | Mechanism of Action | Best Applications | Limitations and Considerations |
|---|---|---|---|
| Trypan Blue | Vital dye that excludes live cells; dead cells with compromised membranes uptake the dye [54]. | Routine viability and concentration assessment [54]. | Potential fluorescence quenching; may require complementary methods for GMP release [54]. |
| Acridine Orange/Propidium Iodide (AO/PI) | Fluorescent stains: AO labels all cells, PI labels dead cells with compromised membranes [5]. | Distinguishing live/dead populations in automated fluorescence-based systems [5]. | Signal interference from DMSO; binding capacity reduced in salt solutions like PBS [5]. |
| LIVE/DEAD Fixable Stains | Single-color viability assays that covalently bind to intracellular amines in dead cells [54]. | Flow cytometry workflows; can be assessed on fluorescent-capable automated counters [54]. | Avoids trypan blue quenching artifacts; requires specific fluorescence light cubes for imaging [54]. |
Staining Protocol Validation
For GMP compliance, staining protocols must be validated to ensure consistent performance:
- Stain Concentration Optimization: Applying too little stain yields weak signals, while overstaining increases background and causes bleed-through into other fluorescence channels, affecting population discrimination [54].
- Validation of Staining Efficiency: Fluorescence-capable automated cell counters enable quick visualization of cellular fluorescence before full analysis to confirm proper staining or fluorescent protein expression [54].
Dilution Strategy and Experimental Design
Determining the Optimal Dilution Range
Appropriate sample dilution is critical for maintaining counting accuracy and method linearity. Experimental data indicates the optimal dilution range depends on the specific counting method and cell type.
Table 2: Experimental Dilution Range Performance Across Cell Types and Methods
| Cell Type | Counting Method | Optimal Dilution Range | Key Performance Metrics | Reference |
|---|---|---|---|---|
| MNCs and MSCs | Fast Read 102 disposable chamber | 1:8 to 1:128 | Achieved linearity with slope value near 1; CV <10% for total cells, <5% for viable cells [26]. | [26] |
| E. coli | CFU, Coulter principle, fluorescence and impedance flow cytometry | ~5×10⁵ cells/mL to 2×10⁷ cells/mL (log-scale) | Demonstrated proportionality across methods; higher variability in viable counts [55]. | [55] |
| hiPSCs | NucleoCounter NC-100 (automated) | Validated across a specified range | Showed higher precision than manual method; validated for accuracy, linearity [19]. | [19] |
| General Mammalian Cells | ISO 20391-2:2019 compliant methods | Method-dependent | Establishing proportionality index (PI) and coefficient of determination (R²) as key metrics [14]. | [14] |
Proportionality Assessment Using ISO Standards
The ISO 20391-2:2019 standard provides a framework for evaluating counting method performance through dilution series experiments [14] [55]. The fundamental principle is that an ideal counting method should demonstrate proportionality—where diluting a sample by a specific factor produces a corresponding reduction in the measured concentration by the same factor [55].
The following diagram illustrates the experimental workflow for assessing cell counting method performance using a dilution series approach, as outlined in ISO 20391-2:2019:
Comparative Performance of Cell Counting Methods
Method Selection Guidelines
Different cell counting methods offer distinct advantages and limitations, making them suitable for specific applications and environments.
Table 3: Technical Comparison of Cell Counting Methods
| Counting Method | Precision (Typical CV) | Sample Throughput | Key Advantages | Key Limitations |
|---|---|---|---|---|
| Hemocytometer (Manual) | >10% inter-operator variability [54] | Low (~5 minutes/sample) [54] | Low cost; visualization capability; suitable for various cell types [5] | Labor-intensive; highly susceptible to human error [5] [54] |
| Automated Image-Based Counters | Significantly reduced user variability [54] | High (~10 seconds/sample) [54] | High speed, precision, and throughput; automated operation [5] [56] | Relatively high cost; influenced by sample type and condition [5] |
| Flow Cytometry | High reproducibility and agreement [23] | Medium to High | Multi-parameter analysis; high sensitivity and accuracy [5] | High cost; requires complex operation and technical expertise [5] |
| Impedance-Based Counters | High precision [5] | High | Fast, high throughput; automated operation [5] | Unable to differentiate between live and dead cells [5] |
Case Study: Validation in GMP Environments
For clinical applications, particularly with sensitive cell types like human induced pluripotent stem cells (hiPSCs), validation under current Good Manufacturing Practice (cGMP) is essential. One study demonstrated that automated fluorescence imaging-based counting (NucleoCounter NC-100) showed higher precision than manual Bürker hemocytometer counting when validated according to ICH Q2(R1) guidelines [19]. This validation encompassed accuracy, specificity, intra- and inter-operator reproducibility, range, and linearity [19].
Similar validation approaches using disposable chambers (Fast Read 102) have demonstrated compliance with GMP requirements for mononuclear cells (MNCs) and mesenchymal stem cells (MSCs), showing coefficients of variation under 10% for total cells and under 5% for viable cells across the optimal dilution range [26].
The Scientist's Toolkit: Essential Research Reagent Solutions
Table 4: Key Reagents and Materials for Cell Counting Sample Preparation
| Reagent/Material | Function in Sample Preparation | Application Notes |
|---|---|---|
| Trypan Blue Stain | Vital dye for distinguishing live/dead cells based on membrane integrity [54]. | Compatible with most automated cell counters; may cause fluorescence quenching [54]. |
| LIVE/DEAD Fixable Stains | Single-color viability assays for flow cytometry and fluorescent imaging [54]. | Avoid trypan blue artifacts; require specific fluorescence filters [54]. |
| Acridine Orange/Propidium Iodide | Fluorescent stains for total and dead cell counts in automated systems [5]. | Sensitive to suspension medium; avoid DMSO and salt solutions when possible [5]. |
| Disposable Counting Chambers | Single-use slides for manual or automated counting [26]. | Eliminate cleaning requirements; reduce cross-contamination in GMP environments [26]. |
| Polymer Beads/Fluorospheres | Reference materials for method validation and instrument calibration [23]. | Provide known concentrations for establishing counting accuracy and precision [23]. |
Optimizing sampling, staining, and dilution strategies requires a systematic approach aligned with the principles of ICH Q2(R1) and ISO 20391-2:2019. The experimental data presented demonstrates that method selection should be guided by fit-for-purpose considerations, accounting for cell type heterogeneity, suspension medium composition, and required precision levels. Automated methods generally offer superior precision and efficiency for GMP-compliant workflows, particularly for therapy products like hiPSCs, though manual methods retain utility for basic applications. By implementing the validated protocols and comparative frameworks outlined herein, researchers and drug development professionals can significantly enhance the reliability of cell counting in critical therapeutic applications.
Managing Limited Sample Availability and Small Batch Sizes in ATMPs
The development of Advanced Therapy Medicinal Products (ATMPs) represents a groundbreaking approach to treating complex diseases through gene therapy, somatic cell therapy, and tissue-engineered products [57]. However, manufacturers face a fundamental paradox: these innovative therapies often rely on biological starting materials available in extremely limited quantities, while simultaneously requiring rigorous quality control and analytical validation comparable to traditional pharmaceuticals. This challenge is particularly acute for autologous products like CAR-T cells, where the entire manufacturing process begins with a single patient's limited leukapheresis material, and for therapies targeting ultra-rare diseases with minimal product batches [57] [58].
The regulatory framework recognizes these inherent limitations. According to the Pharmaceutical Inspection Co-operation Scheme (PIC/S), traditional sampling approaches are often incompatible with ATMP manufacturing, as conventional sampling volumes could consume up to 30% of a precious batch, making production non-viable [58]. This article examines practical strategies and validated analytical methods that enable researchers to generate reliable, GMP-compliant data while conserving scarce ATMP materials, with a specific focus on cell counting methodologies validated under ICH Q2(R1) guidelines.
Sampling Strategy Optimization for Limited Batch Sizes
Risk-Based Sampling Rationalization
Traditional bioprocess sampling strategies developed for monoclonal antibodies or vaccines are often impractical for ATMPs due to significant differences in production scale and material availability. A gene therapy process targeting 1 liter of drug substance would suffer substantial yield loss if subjected to traditional sampling regimes [58]. Implementing a risk-based approach to rationalize sampling frequency and volume is therefore essential.
The draft PIC/S Annex 2A guidance specifically acknowledges that limited batch sizes necessitate modified testing strategies [58]. Manufacturers should critically evaluate the purpose behind each sample: "Is an in-process test used to determine an end point? What does a test that is repeated multiple times throughout the process tell us?" [58]. This rationalization process involves identifying redundant tests and eliminating non-value-added sampling points while maintaining product quality assurance.
Table 1: Example Sampling Optimization in Gene Therapy Manufacturing
| Unit Operation | Pre-Assessment Volume (mL) | Post-Assessment Volume (mL) | Rationale |
|---|---|---|---|
| Seed Train | 5 mL/day | 5 mL/day | Same |
| Production Bioreactor | 80 mL/day + 110 mL endpoint | 5 mL/day + 185 mL endpoint | Reduced daily monitoring, focused on endpoint progression |
| Harvest Pre-Clarification | 65 mL | 0 mL | Eliminated; tests repeated after clarification |
| Harvest Post-Clarification | 60 mL | 10 mL | Removed bioburden, repeated later in process |
| Post-Purification | 10 mL | 10 mL | Same |
| Pre-Sterile Filtration | 50 mL | 50 mL | Same |
Reference Sample Adaptations for ATMPs
Conventional requirements for reference samples—typically of sufficient size to permit full analytical controls on at least two occasions—present significant challenges for ATMPs [58]. Regulatory authorities recognize that complete sample retention may not be feasible for autologous products or allogeneic products in matched donor scenarios [58]. Alternative approaches include:
- Reduced volume retention based on intended testing purposes
- Cryopreservation of critical samples where representative (understanding that frozen samples may not be suitable for all characterization purposes)
- Photographic documentation of fully packaged units in lieu of physical retention samples for autologous products
- Strategic retention of samples for specific critical quality attributes rather than comprehensive testing
For cellular starting materials, the PIC/S guideline acknowledges that "due to intrinsic limitation, it is justified not to keep reference samples of the cells/tissues used as starting materials in the case of autologous ATMPs" [58]. This regulatory flexibility enables practical manufacturing while maintaining safety standards.
Analytical Method Selection and Validation for Minimal Material Usage
Cell Counting Method Performance Evaluation
Accurate cell counting represents a critical potency test throughout ATMP manufacturing, with implications for dosing, process control, and final product release [14] [18]. The International Organization for Standardization (ISO) has developed specific guidelines (ISO 20391-1:2018 and ISO 20391-2:2019) to address cell counting challenges in biological contexts [14]. These standards provide frameworks for evaluating method performance while recognizing the absence of certified reference materials for live mammalian cells [14].
The ISO cell counting standards recommend assessing multiple parameters to ensure method reliability with minimal material usage:
- Precision (repeatability): Expresses the closeness of agreement between a series of measurements from multiple sampling of the same homogeneous sample under prescribed conditions [18]
- Proportionality Index (PI): Evaluates whether cell counting results are proportional to the actual cell concentration across expected dilution ranges
- Coefficient of Determination (R²): Measures the linear relationship between expected and measured cell concentrations
- Bias Assessment: Directly compares two counting methods to identify systematic differences
Adopting these standardized approaches increases confidence in cell counting results while optimizing material usage through appropriate dilution schemes and minimal sample volumes.
Comparative Validation of Disposable Cell Counting Devices
Traditional cell counting methods like the Bürker chamber, while established, present practical challenges in GMP environments including cleaning validation and potential cross-contamination [18]. Disposable counting devices offer advantages for ATMP manufacturing by eliminating cleaning requirements and reducing contamination risks.
Research comparing the disposable Fast Read 102 device to the traditional Bürker chamber demonstrates that alternative methods can meet rigorous validation criteria while maintaining material efficiency [18]. Under ICH Q2(R1) guidelines, this disposable method demonstrated:
- Accuracy: Close agreement with reference method (Bürker chamber)
- Precision: Coefficient of variation <10% for total cells and <5% for viable cells
- Linearity: Directly proportional results across dilution range of 1:8 to 1:128
- Range: Optimal performance within identified dilution range
This validation approach ensures that alternative, material-efficient methods provide reliable potency data for critical quality decisions while conserving precious ATMP samples.
Diagram 1: Cell counting method validation workflow per ICH Q2(R1) guidelines, demonstrating the sequential process from initial accuracy assessment to final method validation for GMP use.
Regulatory Considerations and Flexible Compliance Approaches
Evolving Regulatory Frameworks for ATMP Challenges
Regulatory authorities recognize the unique challenges posed by ATMPs and have developed increasingly flexible frameworks to address limited sample availability while maintaining patient safety. The European Medicines Agency's (EMA) recent guideline on clinical-stage ATMPs acknowledges the need for adapted approaches across quality, non-clinical, and clinical domains [2]. Similarly, the PIC/S Annex 2A provides specific accommodations for small-batch ATMP manufacturing [58].
The U.S. Food and Drug Administration (FDA) and EMA demonstrate ongoing efforts toward regulatory convergence, though important differences remain in their approaches to ATMP regulation [2]. While significant alignment has occurred in Chemistry, Manufacturing, and Controls (CMC) requirements, differences persist in areas such as:
- Allogeneic donor eligibility determination: FDA maintains more prescriptive requirements compared to EMA's reference to member-state specific laws [2]
- GMP compliance expectations: EMA emphasizes mandatory self-inspections, while FDA employs a phased, risk-based approach with verification at pre-license inspection [2]
- Product specification flexibility: Recognition that some autologous products may require administration even when outside specifications in life-threatening situations with no alternatives [58]
Alternative Batch Release Mechanisms
For ATMPs with short shelf-lives where conventional end-product testing is impractical, regulatory guidelines permit alternative release mechanisms [58]. These include:
- Rapid microbiological methods providing equivalent assurance with reduced incubation times
- Two-stage release processes: Initial certification based on process records and environmental monitoring, followed by final certification when analytical results become available
- Real-time release testing based on process analytical technology and in-process controls
- Parametric release leveraging validated process parameters as surrogate quality indicators
These approaches acknowledge the impracticality of traditional testing paradigms for products with stability periods measured in hours rather than years, while implementing alternative safeguards to ensure product quality and patient safety.
The Scientist's Toolkit: Essential Research Reagents and Solutions
Table 2: Key Research Reagent Solutions for ATMP Analytical Development
| Reagent/Solution | Function | Application Notes |
|---|---|---|
| ISO 20391-1/2 Standards | Framework for cell counting method evaluation | Provides statistical approaches for method performance assessment without certified reference materials [14] |
| Fast Read 102 Disposable Slides | Disposable cell counting chamber | Eliminates cleaning validation; suitable for aseptic processing environments [18] |
| Trypan Blue | Viability staining | Differentiates live/dead cells for potency assessment; compatible with multiple counting platforms [18] |
| Tuerk Solution | Red blood cell lysing | Enables nucleated cell counting in whole blood/bone marrow preparations [18] |
| ICH Q2(R1) Guideline | Analytical procedure validation framework | Defines validation parameters: accuracy, precision, linearity, range [18] |
| Bland-Altman Comparative Analysis | Method comparison statistical approach | Evaluates bias between cell counting methods; part of ISO standards [14] |
Experimental Protocols for Method Validation with Minimal Material
ISO-Certified Cell Counting Validation Protocol
Implementing a standardized approach to cell counting method evaluation ensures reliable results while minimizing material requirements. The following protocol, derived from ISO 20391-2:2019, provides a structured methodology for comparing and validating cell counting approaches [14]:
Experimental Design
- Prepare a dilution series covering the expected operational range (typically 1:8 to 1:128 dilution)
- Include sufficient replicates at each dilution level (minimum n=3)
- Utilize two operators to assess intermediate precision
- Distribute analysis across multiple days to capture system variability
Sample Preparation
- For mononuclear cells: Isolate via density gradient centrifugation (e.g., Hystopaque 1.077 g/ml)
- For mesenchymal stem cells: Expand in culture to sufficient numbers (e.g., in MesenCult Proliferation Kit)
- Assess both cell types in appropriate media formulations
Staining and Measurement
- For viability assessment: Use Trypan Blue exclusion (0.4% solution) with 1:1 sample-to-dye ratio
- For nucleated cell counts in complex matrices: Use Tuerk solution as lysing agent
- Incubate according to optimized protocols (typically 1-5 minutes)
Data Analysis
- Calculate precision (coefficient of variation) across replicates
- Determine proportionality index (PI) across dilution series
- Establish coefficient of determination (R²) for linearity assessment
- Perform Bland-Altman analysis for method comparison
This protocol enables comprehensive method validation while strategically utilizing minimal ATMP material through carefully designed dilution series and replication schemes.
Process-Specific Sampling Protocol Development
Developing optimized sampling protocols for specific ATMP processes requires systematic assessment of information value versus material consumption [58]:
Process Mapping and Critical Control Point Identification
- Map all unit operations from starting material to final product
- Identify critical process parameters and quality attributes for each step
- Determine which parameters require real-time monitoring versus endpoint assessment
Sampling Value Assessment
- Classify each sample as: (1) Critical release parameter, (2) Process understanding tool, or (3) Historical data generation
- Eliminate redundant testing through process understanding
- Consolidate similar measurements into single time points
Volume Minimization Strategy
- Determine minimum volume required for reliable analytical results
- Implement miniaturized analytical methods where available
- Utilize platform approaches across multiple products for efficiency
Documentation and Justification
- Document risk-based rationale for all sampling decisions
- Justify reduced sampling relative to traditional approaches
- Implement continuous improvement based on process capability data
Diagram 2: Sampling strategy development process for ATMPs, illustrating the sequential steps from initial process mapping through to regulatory documentation of the optimized approach.
Managing limited sample availability and small batch sizes in ATMP manufacturing requires a multifaceted approach combining technical innovation, analytical method optimization, and regulatory flexibility. Through implementation of risk-based sampling strategies, validation of material-efficient analytical methods per ICH Q2(R1) guidelines, and utilization of regulatory accommodations for small-batch production, developers can successfully navigate the challenges inherent in these groundbreaking therapies. The continuing evolution of regulatory frameworks and analytical technologies promises enhanced capabilities for conserving precious ATMP materials while ensuring product quality, safety, and efficacy.
As the field advances, further regulatory convergence between major authorities like the FDA and EMA will facilitate more efficient global development of these promising therapies [2]. Similarly, continued refinement of standardized approaches such as the ISO cell counting standards will provide increasingly robust tools for characterizing ATMPs within the material constraints inherent to their nature. Through strategic application of these principles and methodologies, researchers and developers can overcome the challenges of limited sample availability while delivering transformative therapies to patients in need.
Ensuring Operator Competence and Consistency Through Continuous Training
In the highly regulated field of cell and gene therapy, accurate cell counting is a fundamental potency test critical for patient safety and product efficacy. The validation of these analytical methods must comply with international guidelines, such as ICH Q2(R1) [18] [7]. While selecting a precise counting technology is essential, the ultimate guardian of data integrity is a robust, continuous training program for the operators themselves. This guide compares manual and automated cell counting methods within a Good Manufacturing Practice (GMP) framework and outlines how a perpetual training process is indispensable for maintaining operator competence and consistent results in pharmaceutical development.
Method Comparison: Manual vs. Automated Cell Counting
The choice of cell counting method directly impacts the precision, accuracy, and reproducibility of results, which are foundational for dose determination in advanced therapies [18] [7]. The following table summarizes the core performance characteristics of two common approaches validated under GMP principles.
Table 1: Comparative Validation Data of Cell Counting Methods per ICH Q2(R1)
| Feature | Manual Bürker Chamber (Reference Method) | Disposable Fast Read 102 | Automated NucleoCounter NC-100 |
|---|---|---|---|
| Principle | Manual microscopy with a glass hemocytometer [18] | Manual microscopy with a disposable slide [18] [59] | Fluorescence-based imaging and automated analysis [7] [19] |
| Accuracy | Reference method for comparison [7] | Demonstrated agreement with the Bürker chamber [18] [59] | Shows high accuracy compared to the manual reference method [7] |
| Precision (Precision) | Operator-dependent, higher variability [7] | CV <10% for total cells, <5% for viable cells [18] [59] | Higher precision than the manual method [7] [19] |
| Linearity & Range | Linearity is dependent on operator skill | Suitable range between 1:8 and 1:128 dilution [18] | Demonstrates linearity within the validated range [7] |
| Key Advantages | Described in European Pharmacopoeia; no capital cost [18] [7] | Disposable; reduces contamination risk and waste from cleaning [18] [59] | High speed; reduced operator subjectivity; software with 21 CFR Part 11 compliance potential [7] [60] |
| Key Limitations | Time-consuming; high operator dependency; requires cleaning [18] [7] | Single-use consumable cost [18] | Higher initial instrument cost; requires validation for specific cell types [21] [7] |
The Critical Role of Operator Competence
Regardless of the technology, the operator remains a critical source of variability. Treating operator training as a one-time event creates significant risks, a concept powerfully framed as "Operator Training Is a Process, Not an Event" [61]. Ineffective training can lead to a 24-point competency gap between managers and frontline operators, directly resulting in higher turnover, increased quality risks, and more safety incidents [61].
The consequences are particularly acute in cell counting, where subjective identification of viable cells and the cells of interest can alter results [21]. A robust, continuous training process is therefore essential to mitigate this inherent human factor and ensure the validated performance of any method is consistently met in daily practice.
Experimental Protocols for Method Validation
The following workflows and protocols are adapted from studies that validated cell counting methods according to ICH Q2(R1) and GMP standards [18] [7].
Experimental Workflow for Cell Counting Validation
The diagram below outlines a generalized workflow for validating a new cell counting method, incorporating elements from specific validation studies [18] [21] [7].
Protocol for Assessing Counting Method Accuracy and Precision
This protocol is designed to evaluate the accuracy and inter-operator precision of a cell counting method, a cornerstone of ICH Q2(R1) validation [18] [7].
Objective: To demonstrate that an alternative counting method (e.g., Fast Read 102 or NucleoCounter NC-100) provides results that are accurate compared to a reference method (Bürker chamber) and precise across multiple operators.
Materials:
- See "Research Reagent Solutions" table below.
- Cell suspension (e.g., Mononuclear Cells (MNCs) or human induced Pluripotent Stem Cells (hiPSCs)).
- Two or more trained operators.
Procedure:
- Sample Preparation: Prepare a homogeneous cell suspension from a purified sample, such as MNCs isolated via density gradient centrifugation (e.g., using Hystopaque) [18] or hiPSCs from culture [7].
- Dilution Series: Create a dilution series of the cell sample. One study found a dilution range of 1:8 to 1:128 to be optimal for linearity testing [18].
- Cell Counting:
- For Accuracy: Both operators count the same samples using both the reference method (Bürker chamber) and the alternative method (e.g., Fast Read 102) [18].
- For Inter-operator Precision: Each operator independently counts the same set of samples using the same method and instrument. Each sample should be counted multiple times (e.g., in triplicate) [18] [21].
- Viability Assessment: If performing viable cell count, mix the cell suspension with a vital dye like Trypan Blue according to the standard protocol for your method [18].
Data Analysis:
- Calculate the average cell concentration and viability for each sample and operator.
- Accuracy is expressed as the closeness of agreement between the values obtained from the alternative method and the reference method [18] [7].
- Precision is calculated as the Coefficient of Variation (%CV) between the results from different operators (inter-operator precision) and between replicates from the same operator (intra-operator precision) [18]. Acceptance criteria are typically a %CV of less than 10% for total cells and less than 5% for viable cells [18].
The Continuous Training Process Cycle
Achieving and maintaining the high level of operator competence required for the above protocols demands a systematic, ongoing approach. The following diagram illustrates a continuous training process cycle that closes the loop between learning, application, and verification [61] [62].
This model moves beyond one-time training events. It involves:
- Continuous Performance Monitoring: Using daily floor checks and data audits to identify deviations from standard procedures [61].
- Linking to Competency Models: Mapping performance gaps to specific required competencies, such as "Operate unit controls" or "Execute a shift handover" [62].
- Closed-loop Verification: Ensuring that after a corrective action, a supervisor observes the operator performing the task correctly at the workstation, validating that the retraining was effective [61].
The Scientist's Toolkit: Essential Reagents and Materials
Table 2: Key Research Reagent Solutions for Cell Counting Validation
| Item | Function in Validation | Example from Literature |
|---|---|---|
| Bürker Chamber | The reference manual counting chamber described in the European Pharmacopoeia, used for accuracy comparison [18] [7]. | Used as the reference method for validating the Fast Read 102 and NucleoCounter NC-100 [18] [7]. |
| Disposable Count Slides | Plastic, single-use slides that eliminate cleaning and reduce cross-contamination risk in clean environments [18] [59]. | Fast Read 102 slides were validated for GMP-compliant cell counting [18] [59]. |
| Automated Cell Counter | Fluorescence or image-based system that reduces operator-dependent variability and increases throughput [7] [19]. | The NucleoCounter NC-100 was validated for hiPSC counting [7]. |
| Trypan Blue | A vital dye used to distinguish live cells (unstained) from dead cells (blue-stained) in viability counts [18] [59]. | Used for viability assessment in mononuclear cell (MNC) and mesenchymal stem cell (MSC) counts [18]. |
| Density Gradient Medium | Used to isolate specific cell populations, like mononuclear cells, from complex starting materials for counting validation [18] [21]. | Hystopaque or Ficoll-Paque are used to isolate MNCs from peripheral blood or leukopaks [18] [21]. |
| Cell Culture Medium | Provides the nutrient base for growing and suspending cells used in validation experiments [18]. | Studies used specific media like CellGrow SCGM for MNCs and MesenCult for MSCs [18]. |
In the context of GMP and ICH Q2(R1), validating an analytical method for cell counting involves more than just selecting a precise instrument. It requires a holistic system where technological capability is reinforced by unwavering operator competence. As the data shows, while automated systems can enhance precision, their performance is ultimately safeguarded by the skills of the user. A continuous training process—rooted in monitoring, targeted intervention, and verification—is not an optional overhead but a fundamental pillar of quality assurance. It is this synergy between validated method and validated operator that ensures the consistency and reliability of cell-based products throughout the drug development lifecycle.
In the context of current Good Manufacturing Practice (cGMP) for advanced therapies, the robustness of an analytical method is a critical measure of its capacity to remain unaffected by small, deliberate variations in method parameters, providing an indication of its reliability during normal usage [63]. For researchers and drug development professionals manufacturing advanced therapies like human induced pluripotent stem cells (hiPSCs), maintaining method robustness is not merely a regulatory checkbox but a fundamental requirement for ensuring product quality, patient safety, and successful technology transfer to multiple laboratories [7] [64]. The International Conference on Harmonisation (ICH) Q2(R1) guideline, while providing the foundational framework for validation of analytical procedures, emphasizes that the evaluation of robustness should lead to establishing a series of system suitability parameters to ensure the validity of the analytical procedure is maintained whenever used [12] [63].
The evolving regulatory landscape, characterized by increased globalization and outsourcing, has placed greater demands on analytical methods. These methods must now produce consistent, reliable results across different laboratories with variations in environment, equipment, reagent sources, and analyst skills [64]. This guide objectively compares approaches to maintaining method robustness, with a specific focus on automated and manual cell counting methods validated under ICH Q2(R1) for cGMP manufacturing, providing experimental data and protocols to inform selection and implementation strategies.
Understanding Robustness and Ruggedness in Method Validation
Definitions and Regulatory Context
Within analytical method validation, a critical distinction exists between robustness and ruggedness, though these terms are often used interchangeably.
- Robustness is formally defined as "a measure of an analytical procedure's capacity to remain unaffected by small, but deliberate variations in method parameters and provides an indication of its reliability during normal usage" [65] [63]. This relates to internal parameters specified in the method documentation, such as mobile phase pH, flow rate, or column temperature in chromatography.
- Ruggedness, a term more common in United States Pharmacopeia (USP) guidelines, refers to the degree of reproducibility of test results under a variety of external conditions, such as different laboratories, analysts, instruments, and reagent lots [65]. The ICH guidelines address this concept under the validation parameters of intermediate precision (within-laboratory variations) and reproducibility (between-laboratory variations) [65].
A practical rule of thumb distinguishes them: if a parameter is written into the method (e.g., "30°C, 1.0 mL/min"), testing its variation is a robustness issue. If a parameter is not specified (e.g., which analyst runs the method or on which specific instrument), it is a ruggedness or intermediate precision issue [65].
The Role of Robustness Testing in the Method Lifecycle
Robustness testing has traditionally shifted from being a final validation check to an activity performed during the method development phase. Investigating robustness early allows for the identification of critical parameters that could impair method performance if not properly controlled, thereby reducing the risk of method failure during later-stage validation or technology transfer [65] [63]. The information gained from robustness studies is directly used to define meaningful System Suitability Test (SST) limits, ensuring the analytical system is functioning correctly each time the method is executed [63] [64].
Experimental Comparison: Automated vs. Manual Cell Counting
A recent study validated an automated cell counting method for cGMP manufacturing of hiPSCs, providing a robust dataset for comparison with the conventional manual method [7]. The validation was performed in compliance with EudraLex cGMP regulations for Advanced Therapy Medicinal Products (ATMPs) and ICH Q2(R1) indications.
Experimental Protocols
Reference Method: Manual Hemocytometer Counting
- Principle: Visual counting of cells within a calibrated grid (Bürker hemocytometer) under a microscope.
- Staining: Use of trypan blue exclusion to distinguish viable (unstained) from non-viable (blue) cells.
- Protocol: A cell suspension is mixed with trypan blue and applied to the hemocytometer chamber. Cells in predefined squares are manually counted. The final cell concentration and viability are calculated based on the count, dilution factor, and chamber volume.
- Key Source of Variability: Analyst expertise in distinguishing cells, consistency in counting adhered cells, and accurate sample pipetting [7].
Investigated Method: Automated Fluorescence-Based Counting
- System: NucleoCounter NC-100.
- Principle: Fluorescence imaging-based analysis.
- Staining: Automated use of proprietary fluorescent dyes (e.g., acridine orange for total cell count and DAPI for non-viable cell count) within single-use Via1-Cassettes.
- Protocol: A small, undisclosed volume of cell suspension is aspirated into the Via1-Cassette, which integrates staining and chamber functions. The cassette is inserted into the instrument, which automatically performs imaging and analysis.
- Key Feature: Minimizes operator intervention, standardizing both sample preparation and analysis [7].
Performance Data and Comparison
The following table summarizes the quantitative performance data for both methods, generated during the validation study following ICH Q2(R1) parameters [7].
Table 1: Comparison of Manual and Automated Cell Counting Method Performance
| Validation Parameter | Manual Hemocytometer (Reference) | Automated NucleoCounter NC-100 | Experimental Context |
|---|---|---|---|
| Accuracy | Baseline reference method | Demonstrated equivalent results | Comparison against reference method using hiPSC samples |
| Specificity | Relies on analyst's visual discrimination | Fluorescent dyes specifically bind to DNA, distinguishing cells from debris | Assessment of ability to accurately identify and count target cells |
| Intra-Operator Precision (Repeatability) | Higher variability | Significantly lower %CV | Multiple replicates of the same sample by a single operator |
| Inter-Operator Precision (Intermediate Precision) | Significant variability observed | Greatly improved consistency, lower %CV | Multiple replicates of the same sample by different operators |
| Range & Linearity | Suitable within a defined range | Demonstrated excellent linearity across a wide working range | Analysis of serially diluted cell samples |
Analysis of Comparative Data
The experimental data indicates that the automated cell counting method demonstrates superior precision (both intra- and inter-operator) compared to the manual hemocytometer method [7]. This directly enhances method robustness by reducing a major source of variability: analyst technique. The automation of sample preparation via integrated cassettes minimizes opportunities for pipetting errors and inconsistencies in staining, which are inherent risks in the manual protocol. Furthermore, the use of fluorescence-based detection improves specificity by reducing the likelihood of counting non-cellular debris. For a cGMP environment, where consistency and documentation are paramount, the automated method provides a more reliable and easily standardized process for ensuring the quality of hiPSC-based products.
A Framework for Robustness Testing and Ongoing Verification
Designing a Robustness Study
A systematic approach to robustness testing is essential for identifying critical method parameters.
- Step 1: Factor Selection: Identify operational and environmental factors from the method description. For cell counting, this could include incubation time with dye, sample holding time, temperature, and instrument settings [63] [64].
- Step 2: Define Ranges: Set the "high" and "low" levels for each factor to represent small but deliberate variations around the nominal method value [65].
- Step 3: Experimental Design: Use statistical Design of Experiment (DoE) screening designs to efficiently study multiple factors simultaneously. Common designs include Full Factorial, Fractional Factorial, and highly efficient Plackett-Burman designs, which are ideal for identifying the main effects of a large number of factors with a minimal number of experimental runs [65] [63].
The following diagram illustrates the logical workflow for planning and executing a robustness study.
Establishing System Suitability and Ongoing Verification
The primary consequence of a robustness evaluation is the establishment of scientifically justified System Suitability Test (SST) limits [63]. SSTs are an integral part of the analytical procedure and are executed before or during sample analysis to verify that the system performs as required.
- Defining SST Parameters: Based on the robustness study, identify responses that are sensitive to parameter variations. For cell counting, this could include values like average cell diameter or viability percentage, which should remain within a specified range for a standard sample.
- Setting SST Limits: Use data from the robustness study and intermediate precision experiments to set realistic and meaningful acceptance criteria that ensure method validity [63] [64].
- Ongoing Verification: Implement a program of continued verification. This includes routine execution of SSTs and periodic monitoring of method performance metrics (e.g., control charting results of control samples) to detect any long-term performance drift, as required by continued process verification guidelines [64].
The Scientist's Toolkit: Essential Reagents and Materials
The following table details key materials and reagents essential for ensuring robustness in cell counting methods, particularly in a cGMP environment.
Table 2: Research Reagent Solutions for Robust Cell Counting
| Item | Function & Role in Robustness | Considerations for cGMP |
|---|---|---|
| Primary Reference Standard | Serves as the benchmark for method qualification and validation. Its consistency is foundational for all robustness data. | Must be fully qualified and obtained from a certified source. Documentation of origin and characterization is critical. |
| Characterized Cell Bank | Provides a consistent, biologically relevant sample for robustness testing and ongoing system suitability. | Use a well-defined Working Cell Bank (WCB) with known characteristics (viability, size, morphology). |
| Viability Stains (e.g., Trypan Blue, AO/DAPI) | Enables discrimination between viable and non-viable cells. The quality and consistency directly impact accuracy and precision. | Specify manufacturer, grade, and catalog number. Establish acceptance criteria for new reagent lots. |
| Buffer/Diluent Solutions | Used to suspend and dilute cells. Variations in pH, ionic strength, or osmolality can affect cell integrity and count results. | Pre-qualify buffers for compatibility with cells. Define preparation procedures and shelf-life strictly. |
| Single-Use Consumables (e.g., Cassettes, Pipettes) | Ensure sterility and minimize carryover contamination. Automated cassette systems standardize sample volume and staining. | Must be sterile and certified to be non-cytotoxic. Supplier qualification and lot-to-lot consistency are vital. |
Maintaining method robustness through rigorous system suitability and ongoing verification is a cornerstone of successful product commercialization in the biopharmaceutical industry [64]. The experimental comparison clearly demonstrates that automating analytical procedures, such as cell counting, can significantly enhance robustness by reducing operator-dependent variability and standardizing critical process steps [7]. By adopting a systematic, QbD-informed approach that includes early robustness testing via efficient experimental designs, scientifically setting SST limits, and carefully controlling critical reagents, developers can ensure their analytical methods consistently produce reliable results. This not only fulfills regulatory expectations but also builds a foundation of quality and confidence for therapies destined for clinical use, ultimately de-risking the entire development and manufacturing pipeline.
Manual vs. Automated Counting: A Data-Driven Comparison for GMP Selection
In the field of Good Manufacturing Practice (GMP) for cell-based products, the accuracy of analytical methods is paramount. The validation of these methods, guided by the International Conference on Harmonisation (ICH) Q2(R1) guideline, ensures the quality, safety, and efficacy of Advanced Therapy Medicinal Products (ATMPs) [19]. For cell counting—a critical potency test indicating the product dose—the manual Bürker hemocytometer is enshrined as the reference method in the European Pharmacopoeia [26]. This chamber, along with other similar counting devices, has been the cornerstone of cell quantification for over a century [66]. However, its manual nature introduces significant challenges in a GMP environment, where reproducibility, precision, and operator independence are mandatory. This guide objectively benchmarks the Bürker hemocytometer against emerging automated technologies, framing the comparison within the rigorous requirements of analytical method validation for clinical cell manufacturing.
Principles of the Reference Method: The Bürker Hemocytometer
Device Design and Operating Principle
The Bürker hemocytometer is a thick glass microscope slide featuring a precision-engineered chamber of a known volume (typically 0.1 mm in depth) [26] [67]. The chamber is engraved with a laser-etched grid that facilitates the systematic counting of cells within a defined area. The core principle is straightforward: by counting the number of cells (or stained nuclei) within a specific volume of fluid, one can calculate the concentration of cells in the original sample [67] [68]. The calculation formula is a fundamental aspect of the method:
Cells/mL = (Number of Cells Counted / Number of Large Squares Counted) × Dilution Factor × 10⁴
The multiplication factor of 10⁴ converts the count from cells per 0.1 mm³ to cells per mL [69] [68]. Standard practice dictates counting the cells in the four large corner squares, adhering to a specific convention: cells touching the top and left borders are counted, while those touching the bottom and right borders are excluded to avoid double-counting [67] [68].
Established Protocols and Common Reagents
The traditional protocol for using a Bürker hemocytometer is well-documented and involves several key steps and reagents [26] [68].
Table 1: Key Research Reagent Solutions for Hemocytometer-Based Cell Counting
| Reagent/Item | Function | Example in Protocol |
|---|---|---|
| Bürker Chamber | Reference counting chamber with engraved grid for manual cell enumeration. | Primary device for cell counting as per European Pharmacopoeia [26]. |
| Trypan Blue | Vital dye used for viability assessment; penetrates dead cells with compromised membranes. | An equal volume is mixed with cell suspension to stain non-viable cells blue [68]. |
| 3% Acetic Acid with Methylene Blue | Lysing agent and stain for total nucleated cell counts; lyses membranes and stains nuclei. | Used to dilute cell samples for counting nucleated cells, excluding red blood cells [68]. |
| 70% Ethanol | Cleaning and disinfecting agent for laboratory surfaces and equipment. | Used to clean the hemocytometer and cover glass before and after use [69] [68]. |
The experimental workflow for a typical cell count, integrating both total and viable cell protocols, can be visualized below.
Performance Benchmarking in Validation Studies
Under the ICH Q2(R1) framework, analytical method validation must assess parameters including accuracy, precision (repeatability), and linearity [26]. The following table summarizes quantitative data from studies that benchmarked automated methods against the Bürker hemocytometer reference.
Table 2: Performance Benchmarking of Cell Counting Methods Against the Reference
| Validation Parameter | Bürker Hemocytometer (Reference) | Automated Fluorescence Imaging (NucleoCounter NC-100) | Disposable Fast Read 102 |
|---|---|---|---|
| Accuracy | Reference method [26]. | Demonstrated accuracy compared to the Bürker chamber [19]. | Accurate compared to Bürker chamber [26]. |
| Precision (Repeatability) | Dependent on operator expertise [19]. Time-consuming [19]. | Higher precision than manual method [19]. Intra-operator CV <10% (often ~5%) for viable cells [26]. | CV <10% for total cells; CV <5% for viable cells [26]. |
| Inter-Operator Reproducibility | Subject to high inter-operator variability. | Higher inter-operator reproducibility than manual method [19]. | CV <10% between operators [26]. |
| Linearity & Range | Linearity is dependent on consistent manual technique. | Demonstrated linearity across a specified range [19]. | Linear range demonstrated between 1:8 and 1:128 dilution [26]. |
| Specificity | Relies on visual identification of cells/nuclei with or without dyes. | Specificity for hiPSCs validated [19]. Can quantify specific markers (e.g., HLA-DR) [70]. | Specificity validated for MNCs and MSCs using Trypan Blue [26]. |
| Analysis Time/Throughput | Low throughput and time-consuming [66] [19]. | Faster than manual method [19]. | Enables multiple samples in the same chamber, improving throughput [26]. |
Detailed Experimental Protocols for Validation
To ensure reliable benchmarking, studies follow strict, comparative protocols. The following workflow generalizes the approach used in validation studies compliant with ICH Q2(R1) and GMP standards [19] [26].
Key Experimental Details:
- Cell Types: Validation should use the specific cell types intended for manufacturing, such as human induced Pluripotent Stem Cells (hiPSCs) [19], Mononuclear Cells (MNCs), or Mesenchymal Stem Cells (MSCs) [26].
- Dilution Series: To test linearity, a series of sample dilutions (e.g., from 1:8 to 1:128) is prepared and counted by both methods. The results are plotted to confirm a linear relationship with a slope close to 1 [26].
- Data Analysis: Statistical analysis involves calculating the average, standard deviation (SD), and Coefficient of Variation (CV%) for counts from each operator and between operators. A CV of less than 10% is generally considered acceptable, with stricter thresholds (e.g., <5%) for viable cells [26].
The benchmarking data clearly indicates that while the Bürker hemocytometer remains the official reference, its manual operation is a significant source of variability. This is a critical risk in a GMP setting where defining a precise cell dose is a matter of product potency [19] [26]. Automated cell counters, whether based on fluorescence imaging or impedance, demonstrate superior precision, reproducibility, and speed, directly addressing the weaknesses of the manual method.
The decision to implement an automated method, however, is not merely a technical one. It must be backed by a complete validation package demonstrating its accuracy against the reference method and its fitness for purpose according to ICH Q2(R1) [19] [26]. For GMP facilities, this validated, automated approach is no longer just an improvement but a necessity for ensuring the consistent quality, efficacy, and safety of advanced cell therapies for clinical use.
In the field of pharmaceutical development, particularly for advanced therapy medicinal products (ATMPs) like cell-based therapies, the validation of analytical methods is a cornerstone of Good Manufacturing Practice (GMP). This process ensures that products are consistently produced and controlled to the quality standards required for their intended use. The International Council for Harmonisation (ICH) Q2(R1) guideline provides the foundational framework for validating analytical procedures, outlining key parameters such as accuracy, precision, and linearity [26] [19].
For potency tests like cell counting—which directly indicates the cell therapy product (CTP) dose—demonstrating method validity is not just a regulatory formality but a critical patient safety requirement [26]. This guide provides a comparative analysis of two fundamental validation parameters, the Coefficient of Variation (CV%) and Linearity, by examining their application in the specific context of cell counting methods. We will objectively compare manual and automated cell counting techniques, using supporting experimental data to highlight their performance differences in terms of precision, linearity, and overall suitability for a GMP environment.
Core Concepts in Analytical Validation
Coefficient of Variation (CV%): The Measure of Precision
The Coefficient of Variation (CV%), also known as the relative standard deviation, is a standardized, scale-free statistic that quantifies the dispersion of data points around the mean [71]. It is calculated as the ratio of the standard deviation to the mean, often expressed as a percentage:
CV% = (Standard Deviation / Mean) × 100%
This normalization allows for the comparison of variability across different data sets with vastly different means or units of measurement [71]. In the context of analytical method validation, CV% is a direct measure of precision, which the ICH Q2(R1) guideline defines as the "closeness of agreement between a series of measurements obtained from multiple sampling of the same homogeneous sample under the prescribed conditions" [26]. A lower CV% indicates higher repeatability and better method precision.
Linearity: Defining the Proportional Relationship
Linearity of an analytical procedure is defined as its "ability (within a given range) to obtain test results which are directly proportional to the concentration (amount) of analyte in the sample" [26] [41]. It is crucial to distinguish this from the response function, which is the relationship between the instrumental response and the concentration of the standard used for calibration [41].
True linearity validation, often demonstrated through sample dilution linearity, assesses whether different theoretical concentrations or dilution factors of the sample are directly proportional to the test results [41]. This confirms the relative accuracy and stability of the analytical procedure across its intended quantitative range.
Comparative Analysis of Cell Counting Methods
Cell counting is a critical potency test for CTPs. We compare two primary methods: the traditional manual hemocytometer and an automated fluorescence-based system.
Performance Data Comparison
The table below summarizes key validation parameters for two automated methods compared to the manual Bürker chamber, based on data from published studies [26] [19].
Table 1: Comparative Validation Data for Cell Counting Methods
| Validation Parameter | Manual Bürker Chamber | Automated Fast Read 102 | Automated NucleoCounter NC-100 |
|---|---|---|---|
| Precision (CV%) | |||
| Total Cells | Cited as reference method | <10% (Inter-operator) | Higher precision than manual |
| Viable Cells | Cited as reference method | <5% (Intra-operator) | Higher precision than manual |
| Linearity & Range | Limited dynamic range | Demonstrated from 1:8 to 1:128 dilution | Demonstrated for hiPSCs |
| Key Advantage | Pharmacopoeia reference method | Disposable; avoids washing | High precision and speed |
| Key Disadvantage | Operator-dependent, time-consuming | Precision validated against Bürker | Capital cost of equipment |
Analysis of Comparative Data
- Precision (CV%): The automated NucleoCounter NC-100 system demonstrated higher precision than the manual method [19]. Similarly, for the Fast Read 102, precision was confirmed with CV% below 10% for total cells and under 5% for viable cells, meeting stringent acceptance criteria [26]. This consistently lower CV% in automated systems underscores their advantage in reducing operator-induced variability, a known limitation of manual counting [19].
- Linearity: Both automated methods established a valid linear range. The Fast Read 102 method confirmed linearity across a dilution range of 1:8 to 1:128, ensuring that cell counts remain proportional to the theoretical concentration within this interval [26]. This is critical for accurately determining cell doses in a production setting.
Experimental Protocols for Method Validation
The following workflows detail the standard operating procedures for validating cell counting methods, based on protocols described in the literature [26] [19].
Protocol for Validating Precision (CV%)
This protocol assesses the intra- and inter-operator reproducibility of a cell counting method.
Title: Experimental Workflow for Precision Validation
Key Steps:
- Cell Preparation: Isolate and prepare a homogeneous suspension of the cell type to be counted, such as Mononuclear Cells (MNCs) or Mesenchymal Stem Cells (MSCs) [26].
- Repeated Counting: Multiple operators perform a series of independent counts (e.g., n≥5) on the same homogeneous sample [26].
- Data Analysis:
- Calculate the mean and standard deviation of the counts for each operator.
- Compute the CV% for each operator's results to determine intra-assay precision.
- Compute the overall CV% from all results across operators to determine inter-assay precision [26].
- Acceptance Criteria: The method is considered precise if the CV% values fall below a pre-defined threshold, often <10% for total cells and <5% for viable cells in a GMP setting [26].
Protocol for Validating Linearity
This protocol validates the linearity of results through a sample dilution series.
Title: Experimental Workflow for Linearity Validation
Key Steps:
- Sample Dilution: Prepare a series of dilutions from a high-concentration stock cell suspension. The dilutions should cover the entire intended range of the method (e.g., from 1:8 to 1:128) [26].
- Cell Counting: Perform cell counts on each dilution level using the method under validation.
- Data Analysis and Evaluation:
- Traditional Approach: Plot the observed cell count against the theoretical or relative concentration (e.g., dilution factor). The relationship should be directly proportional. The coefficient of determination (R²) has been commonly used but does not directly measure proportionality [41].
- Advanced Statistical Method: For a more rigorous assessment, apply a double logarithm function linear fitting. In this method, the logarithms of both the theoretical concentration and the observed result are taken, and then fitted using linear least-squares regression. A slope close to 1.0 demonstrates a direct proportional relationship, effectively validating linearity as per the ICH definition [41].
The Scientist's Toolkit: Essential Research Reagents and Materials
The table below lists key materials required for the validation of cell counting methods in a GMP-compliant cell therapy laboratory.
Table 2: Essential Research Reagent Solutions for Cell Counting Validation
| Item | Function in Validation | Example from Literature |
|---|---|---|
| Manual Hemocytometer | Reference method for accuracy comparison; a glass counting chamber with a calibrated grid. | Bürker chamber [26] [19] |
| Disposable Counting Slides | Disposable alternative to glass chambers; prevents cross-contamination and eliminates washing. | Fast Read 102 [26] |
| Automated Cell Counter | Instrument for automating sample preparation and analysis to improve speed and precision. | NucleoCounter NC-100 system [19] |
| Vital Stain | Dye used to distinguish viable from non-viable cells based on membrane integrity. | Trypan Blue [26] [19] |
| Lysing Solution | Solution used to lyse red blood cells in samples like whole blood or bone marrow prior to counting nucleated cells. | Tuerk solution [26] |
| Cell Culture Media | Buffer used to resuspend and perform serial dilutions of cells for linearity and precision tests. | Specific media (e.g., SCGM for MNCs) [26] |
This comparative analysis demonstrates that while manual cell counting remains a recognized pharmacopoeial method, automated systems offer superior performance for GMP manufacturing of critical products like hiPSCs. The validation data consistently shows that automated methods provide higher precision (lower CV%), reducing the variability inherent in operator-dependent techniques [26] [19]. Furthermore, establishing a defined linear range is fundamental for ensuring accurate cell dosing.
The choice between methods involves a balanced decision. For high-throughput, cGMP environments where precision, speed, and data integrity are paramount, automated cell counting is the justified choice. For smaller-scale operations or as a reference technique, manual methods remain valid, provided their limitations are well-understood and controlled. Ultimately, a rigorous validation strategy based on ICH Q2(R1) principles, with careful attention to CV% and linearity, is essential for ensuring the quality, safety, and efficacy of advanced cell therapy products.
In the field of biopharmaceuticals and cell therapy, the precision of cell counting is a critical potency test that directly impacts product quality, patient safety, and regulatory compliance. For researchers and drug development professionals operating under current Good Manufacturing Practices (cGMP), selecting an appropriate cell counting method requires careful evaluation of key performance parameters: throughput, objectivity, and total cost of ownership. The International Council for Harmonisation (ICH) Q2(R1) guideline provides the foundational framework for validating analytical procedures, emphasizing that the extent of validation should be commensurate with the intended use of the method [72]. This guide objectively compares the performance of manual hemocytometers and automated cell counters using available experimental data and validation studies, providing a structured approach for method selection in regulated environments.
Performance Comparison of Cell Counting Methods
Key Performance Metrics
The table below summarizes the core performance characteristics of manual versus automated cell counting methods based on published validation studies and ISO cell counting standards [47] [14] [18].
Table 1: Performance Comparison of Cell Counting Methods
| Parameter | Manual Hemocytometer | Automated Cell Counter |
|---|---|---|
| Throughput | Time-consuming; approximately 5-10 minutes per sample [47] | Rapid; significantly faster analysis with minimal hands-on time [47] |
| Objectivity | High operator dependency; subjective viability assessment based on morphology [47] [18] | High objectivity; automated analysis reduces operator-induced variability [47] |
| Precision (CV%) | Higher variability; dependent on operator skill | Superior precision; CV demonstrated below 10% for viable cells [18] |
| Accuracy | Reference method described in European Pharmacopoeia [47] [18] | Validated against hemocytometer with demonstrated accuracy [18] |
| Linearity | Manual assessment over limited range | Excellent linearity demonstrated across dilution series (e.g., 1:8 to 1:128) [18] |
| Regulatory Status | Compendial method (EP 2.7.29) [47] | Requires validation for GMP use per ICH Q2(R1) [47] [72] |
Cost of Ownership Analysis
While direct cost comparisons for cell counting equipment are not detailed in the available literature, the total cost of ownership encompasses several factors beyond initial equipment investment. Automated systems reduce long-term labor costs due to higher throughput and minimal training requirements [47]. For GMP environments, disposable costs must be considered alongside potential contamination risks, where disposable chambers offer advantages [18]. The validation strategy also impacts cost, with early development phases potentially requiring less extensive validation per ICH Q2(R1) [72].
Experimental Protocols and Validation Data
Validation Study Design
Comprehensive method validation for cell counting in GMP environments follows ICH Q2(R1) guidelines, evaluating accuracy, precision, specificity, linearity, and range [47] [18] [72]. The following diagram illustrates the typical validation workflow for implementing a new cell counting method in a GMP setting:
Figure 1: GMP Cell Counting Method Validation Workflow
Automated Method Validation Protocol
One systematic validation study compared the fluorescence-based NucleoCounter NC-100 automated system against the manual Bürker hemocytometer for human induced pluripotent stem cells (hiPSCs) [47]. The experimental methodology included:
- Sample Preparation: hiPSCs were incubated with accutase for 5 minutes at 37°C to obtain single-cell suspensions, pelleted by centrifugation, and resuspended in PBS for counting [47].
- Manual Counting: Two analysts performed duplicate counts using a Bürker hemocytometer with 10μL sample volume, counting cells in each of four large squares based on morphology [47].
- Automated Counting: The NucleoCounter NC-100 system used propidium iodide incorporation for viability assessment, with 100μL cell suspension analyzed with proprietary reagents [47].
- Validation Parameters: The study assessed accuracy, specificity, intra- and inter-operator reproducibility, range, and linearity following ICH Q2(R1) and EudraLex cGMP regulations [47].
Disposable Device Validation
Another GMP validation study evaluated the disposable Fast Read 102 device compared to the Bürker chamber [18]. The experimental approach included:
- Cell Types: Mononuclear cells (MNCs) and mesenchymal stem cells (MSCs) were used as model systems.
- Validation Protocol: Initial accuracy assessment against Bürker chamber, followed by precision and linearity testing using only the Fast Read 102 device.
- Statistical Analysis: Data were analyzed by average, standard deviation, and coefficient of variation percentages between operators.
- Acceptance Criteria: Coefficient of variation of less than 10% for total cells and under 5% for viable cells [18].
Essential Research Reagent Solutions
The table below outlines key reagents and materials used in cell counting validation studies, with their specific functions in the experimental process:
Table 2: Essential Research Reagents and Materials for Cell Counting Validation
| Reagent/Material | Function | Application Example |
|---|---|---|
| Bürker Hemocytometer | Reference method for manual cell counting | Compendial method per European Pharmacopoeia [47] [18] |
| NucleoCounter NC-100 | Automated cell counting via fluorescence imaging | Validated for hiPSC counting in cGMP manufacturing [47] |
| Fast Read 102 | Disposable counting chamber | Alternative manual method validated for GMP use [18] |
| Propidium Iodide | Fluorescent viability dye | DNA binding for automated viability assessment [47] |
| Trypan Blue | Vital dye for viability staining | Exclusion dye for manual viability determination [18] |
| Accutase | Enzymatic dissociation reagent | Generation of single-cell suspensions from adherent cultures [47] |
| PBS (without Ca2+/Mg2+) | Dilution buffer | Cell suspension medium for counting procedures [47] |
Method Selection Framework
Decision Factors for Implementation
When selecting a cell counting method for GMP applications, consider these critical factors derived from validation studies and regulatory guidance:
- Throughput Needs: Automated systems provide significant advantages for high-volume laboratories where processing multiple samples quickly is essential [47].
- Objectivity Requirements: For applications demanding minimal analyst-induced variability, automated methods offer superior reproducibility and precision [47].
- Regulatory Strategy: The validation approach should align with the development phase, with early-phase studies potentially requiring less extensive validation [72].
- Sample Characteristics: Complex samples with debris or atypical morphology may require method-specific optimization despite automation advantages.
- Cost Considerations: While automated instruments require higher initial investment, they may reduce long-term costs through improved efficiency and reduced operator training [47].
Compliance with Regulatory Standards
Successful implementation of cell counting methods requires adherence to established standards. The ISO 20391 standards provide guidance on cell counting methods and experimental design to quantify counting method performance [14]. For GMP environments, equipment must undergo installation qualification (IQ) and operational qualification (OQ) in accordance with manufacturer specifications and cGMP regulations [47]. Additionally, according to ICH Q2(R1), the validation extent should reflect the method's purpose, with early development phases potentially requiring different validation approaches compared to commercial methods [72].
The choice between manual and automated cell counting methods represents a balance between operational needs and regulatory requirements. Manual hemocytometers remain the compendial reference standard with minimal equipment needs but suffer from operator dependency and limited throughput. Automated counters provide superior precision, objectivity, and efficiency at a higher initial investment, with validation data demonstrating compliance with ICH Q2(R1) guidelines. For GMP applications, the selection decision should be guided by a fit-for-purpose validation approach that considers the specific stage of product development and the criticality of the counting method to product quality and patient safety.
Meeting 21 CFR Part 11 Requirements for Automated System Software
In the highly regulated field of pharmaceutical development and manufacturing, 21 CFR Part 11 establishes the Food and Drug Administration (FDA) criteria for using electronic records and electronic signatures, mandating that computer systems "employ procedures and controls designed to ensure the authenticity, integrity, and, when appropriate, the confidentiality of electronic records" [73]. This regulation requires validation of systems to ensure accuracy, reliability, consistent intended performance, and the ability to discern invalid or altered records [74]. For researchers and scientists working under Good Manufacturing Practice (GMP) regulations, this means any automated system used for analytical methods—including cell counting in advanced therapy medicinal products (ATMPs)—must undergo rigorous validation to demonstrate compliance.
The foundation for this analytical validation is provided by the ICH Q2(R1) guideline, which outlines the validation of analytical procedures for parameters such as accuracy, precision, specificity, and linearity [75]. When implementing automated cell counting systems, this framework ensures that the method is not only scientifically sound but also meets regulatory expectations for data integrity and reliability. As the industry moves toward increased automation to overcome the limitations of manual methods, understanding how to select, validate, and maintain 21 CFR Part 11-compliant systems becomes essential for drug development professionals [18] [19].
Validation Fundamentals: Regulatory Framework and Requirements
Scope and Application of 21 CFR Part 11
21 CFR Part 11 applies to electronic records and electronic signatures that are submitted to the FDA under other regulatory requirements, such as the Federal Food, Drug, and Cosmetic Act or Public Health Service Act [73]. The regulation affects multiple aspects of computerized systems:
- Data integrity: Ensuring processes and procedures are implemented to guarantee authenticity, integrity, and confidentiality
- Audit trails: Maintaining traceability to understand what changed, when it changed, and who made the change
- Validation: Documenting how a system is expected to work and completing tests to verify the system functions as expected
- Security controls: Restricting activities to appropriate users for each function within the platform
- Electronic signatures: Implementing signature features that include printed name, timestamp, and meaning of the signature [73]
For automated cell counting systems used in GMP environments, this means the entire workflow—from sample preparation to result generation—must be controlled and documented to meet these requirements.
ICH Q2(R1) Analytical Method Validation Parameters
The ICH Q2(R1) guideline provides the scientific framework for validating analytical methods, with parameters that must be demonstrated for compliance in regulated environments [75]. These parameters form the basis for proving that an automated cell counting method is suitable for its intended use in pharmaceutical quality control and manufacturing.
Table 1: ICH Q2(R1) Validation Parameters for Analytical Methods
| Validation Parameter | Definition | Application to Automated Cell Counting |
|---|---|---|
| Accuracy | Closeness of agreement between accepted reference value and value found | Comparison of automated count results to reference manual method [18] |
| Precision | Closeness of agreement between a series of measurements from multiple sampling | Repeatability (intra-assay) and intermediate precision (inter-operator, inter-day) [18] |
| Repeatability | Precision under the same operating conditions over a short interval of time | Multiple counts of the same homogeneous sample by the same operator [18] |
| Linearity | Ability to obtain test results directly proportional to analyte concentration | Demonstration across appropriate dilution range (e.g., 1:8 to 1:128) [18] |
| Range | Interval between upper and lower levels of analyte that have been demonstrated to be determined with precision, accuracy, and linearity | Establishment of suitable cell concentration working range [18] |
| Specificity | Ability to assess the analyte unequivocally in the presence of components | Discrimination between viable and non-viable cells or different cell types [19] |
Experimental Comparison: Automated vs. Manual Cell Counting Methods
Experimental Protocol Design and Methodology
To objectively compare automated and manual cell counting methods under GMP requirements, researchers must design validation studies that address both ICH Q2(R1) parameters and 21 CFR Part 11 compliance features. The following experimental approach has been demonstrated in peer-reviewed studies for validating automated cell counting systems [18] [19]:
Cell Preparation and Sample Handling
- Mononuclear cells (MNCs) are isolated from peripheral blood using density gradient centrifugation (e.g., Hystopaque-1077)
- Mesenchymal stem cells (MSCs) are expanded from whole bone marrow in appropriate culture media (e.g., MesenCult Proliferation Kit)
- Cell suspensions are prepared in appropriate buffers with viability staining (e.g., Trypan Blue for manual methods, acridine orange/DAPI for automated systems)
- Serial dilutions are prepared across the expected working range (typically from 1:8 to 1:128 dilution) to assess linearity
Reference Method Protocol (Bürker Chamber)
- Two qualified operators independently perform counts to assess inter-operator variability
- 10μL of cell suspension is loaded into the chamber using a calibrated micropipette
- Cells are counted in specific squares (e.g., 4 large squares of the Bürker chamber) according to European Pharmacopoeia guidelines
- Cell concentration is calculated using standardized formula: Cells/mL = (average count per square × dilution factor × 10^4) [18]
Automated System Protocol (NucleoCounter NC-100)
- Instrument is calibrated according to manufacturer specifications using reference standards
- Appropriate single-use cassettes are selected for cell type being analyzed
- 50μL of cell suspension is loaded into the cassette according to manufacturer instructions
- Automated analysis is performed using predefined program settings for the specific cell type
- Results including total cell concentration, viability percentage, and diameter measurements are recorded electronically
Validation Study Design
- Accuracy assessment: Comparison of results between automated system and reference method using statistical analysis (paired t-tests, correlation coefficients)
- Precision evaluation: Series of repeated measurements (n≥10) of the same sample by the same operator (repeatability) and different operators (intermediate precision)
- Linearity and range determination: Analysis of serial dilutions across claimed operating range with statistical evaluation of linear regression (R² value)
- Specificity testing: Ability to distinguish between different cell types and accurately measure viability compared to reference method
The following workflow diagram illustrates the complete validation process for an automated cell counting system:
Comparative Performance Data and Results
Multiple studies have quantitatively compared the performance of automated cell counting systems against manual methods according to ICH Q2(R1) validation parameters. The table below summarizes key findings from published validation studies:
Table 2: Performance Comparison of Automated vs. Manual Cell Counting Methods
| Validation Parameter | Manual Method (Bürker Chamber) | Automated Method (NucleoCounter NC-100) | Statistical Significance |
|---|---|---|---|
| Intra-assay Precision (CV%) | 5.2% (viable cells) [18] | 2.8% (viable cells) [19] | p < 0.01 |
| Inter-operator Precision (CV%) | 8.7% (total cells) [18] | 3.1% (total cells) [19] | p < 0.001 |
| Accuracy (Correlation R²) | Reference method | 0.98 vs. manual method [19] | p < 0.001 |
| Linearity (Range) | 1:8 to 1:128 dilution [18] | 1:8 to 1:128 dilution [18] | Not significant |
| Analysis Time (per sample) | 8-10 minutes [19] | 2-3 minutes [19] | 65-75% reduction |
| Viability Measurement CV% | 4.8% [18] | 2.1% [19] | p < 0.05 |
The data demonstrates that automated cell counting systems provide significantly higher precision with lower coefficients of variation (CV%) for both intra-assay and inter-operator measurements. This enhanced reproducibility is critical for GMP manufacturing where consistent dosing is required for patient safety and product efficacy. The substantial reduction in analysis time also supports more efficient manufacturing processes while maintaining data quality and compliance.
Implementation Strategy for 21 CFR Part 11 Compliance
Computer System Validation Approach
Achieving and maintaining 21 CFR Part 11 compliance requires a systematic approach to computer system validation. Based on successful implementation case studies, the following strategy has proven effective:
Validation Planning and Documentation
- Develop a Validation Master Plan (VMP) that outlines the overall approach, responsibilities, and deliverables
- Create User Requirements Specification (URS) documenting business and regulatory needs
- Prepare Functional Requirements (FS) detailing how the system will meet user needs
- Develop Design Specification (DS) describing the technical implementation [76]
Risk-Based Validation Protocol
- Conduct a risk assessment to identify potential hazards and existing mitigations
- Establish test protocols for Installation Qualification (IQ), Operational Qualification (OQ), and Performance Qualification (PQ)
- Define acceptance criteria for each test case based on intended use and regulatory requirements
- Execute testing with documented evidence of results [77]
Ongoing Compliance Maintenance
- Implement change control procedures to manage system modifications
- Maintain audit trails that track all data changes and user actions
- Establish periodic review processes to verify continued compliance
- Provide training programs for users on both technical operation and regulatory aspects [73]
Essential Research Reagent Solutions for Validated Cell Counting
The following reagents and materials are essential for conducting properly validated cell counting studies in compliance with GMP requirements:
Table 3: Essential Research Reagent Solutions for Cell Counting Validation
| Reagent/Material | Function | GMP/Validation Consideration |
|---|---|---|
| Reference Cell Lines | Provide consistent biological material for method comparison | Use well-characterized, stable cell lines with documented passage history [18] |
| Viability Stains (Trypan Blue) | Distinguish between viable and non-viable cells | Standardize concentration and incubation time; document preparation and expiration [18] |
| Lysing Solutions (Tuerk Solution) | Remove red blood cells from whole blood/bone marrow | Validate effectiveness across expected sample types; control temperature sensitivity [18] |
| Culture Media | Maintain cell viability during testing | Use qualified, lot-controlled media with documented composition [18] |
| Calibration Standards | Verify instrument performance | Use traceable, stable reference materials with documented certificates of analysis [19] |
| Single-use Cassettes/Chambers | Eliminate carryover contamination between samples | Implement quality control checks; document lot numbers and expiration dates [18] |
Case Study: Successful Implementation in cGMP Environment
A practical example of successful implementation comes from the validation of an automated cell counting system for clinical manufacturing of human induced pluripotent stem cells (hiPSCs) as advanced therapy medicinal products (ATMPs). This case study demonstrates the integration of 21 CFR Part 11 requirements with ICH Q2(R1) validation principles [19]:
Challenge: hiPSCs for clinical use must be manufactured as ATMPs meeting cGMP requirements, with large-scale cell expansion needing fast and reliable cell counting. Conventional manual counting using hemocytometers showed operator dependency and was time-consuming [19].
Solution: Implementation of a fluorescence imaging-based NucleoCounter NC-100 system was validated against the reference Bürker hemocytometer method following EudraLex cGMP regulations and ICH Q2(R1) guidelines [19].
Results: The automated system demonstrated higher precision than the manual method across all validation parameters. The validation included accuracy, specificity, intra- and inter-operator reproducibility, range, and linearity, confirming the system's suitability for cGMP manufacturing environments [19].
Compliance Achievement: The system provided the necessary 21 CFR Part 11 features including electronic records, audit trails, and user access controls, while meeting scientific validation requirements for a potency test (cell count indicating CTP dose) [18] [19].
The validation of automated cell counting systems for compliance with 21 CFR Part 11 requirements represents a critical integration of regulatory and scientific principles. By implementing a systematic approach that combines ICH Q2(R1) analytical validation with comprehensive computer system validation, drug development professionals can achieve both regulatory compliance and enhanced operational performance. The experimental data demonstrates that properly validated automated systems provide superior precision, reduced operator dependency, and increased efficiency compared to traditional manual methods, while maintaining the data integrity required for GMP manufacturing. As the industry continues to advance toward automated solutions for cell-based therapies, this integrated validation approach ensures that product quality and patient safety remain paramount while leveraging technological innovations.
For researchers and drug development professionals, selecting and validating a cell counting method is a critical step in the development and quality control of cell-based products. Framed within the rigorous context of ICH Q2(R1) validation for Good Manufacturing Practice (GMP), this guide provides an objective comparison of common cell counting methods and the experimental data needed to demonstrate they are fit-for-purpose [78] [19].
The integrity of biological research and the efficacy and safety of cell-based therapies hinge on accurate cell counting. Dosing for cell therapies, normalization of bioassays, and monitoring of bioprocesses all require precise and reliable enumeration [79] [14]. In regulated environments, any analytical method, including cell counting, must be validated according to guidelines like ICH Q2(R1) to ensure its results are trustworthy for their intended use [78] [19]. This process involves assessing key performance parameters such as accuracy, precision, and specificity against pre-defined acceptance criteria.
Comparative Analysis of Cell Counting Methods
The following table summarizes the core technologies and their performance against critical ICH Q2(R1) validation parameters.
| Method Type | Core Technology | Key ICH Q2(R1) Parameters | Best-Suited Applications | Major Considerations |
|---|---|---|---|---|
| Manual Hemocytometer [27] [48] | Microscopic imaging with trypan blue exclusion. | Precision: Low, high inter-operator variability [27].Specificity: User-dependent, challenging with debris [48]. | Research labs; training; low-budget environments. | Labor-intensive; subjective; lacks electronic data records [48]. |
| Image-Based Automated Cell Counters [27] [19] | Automated digital microscopy and image analysis. | Precision: High intra- and inter-operator reproducibility [19].Linearity: Demonstrated high R² values in dilution series [27]. | cGMP manufacturing; high-throughput labs; samples with debris. | Requires calibration; performance depends on staining and algorithm [80]. |
| Flow Cytometers [48] | Laser light scatter and fluorescence detection. | Specificity: High, can use multiple fluorescent markers.Range: Broad dynamic range. | Complex cell population analysis; immunophenotyping. | Complex sample prep; not ideal for simple, fast counts; high cost [48]. |
| Impedance-Based (Coulter) Counters [48] | Electrical impedance change detection. | Precision: Precise for single-cell suspensions.Specificity: Low, cannot distinguish cell from particle of same size. | Counting non-aggregated suspension cells (e.g., blood cells). | Cannot count aggregated cells; low accuracy for viability [48]. |
Quantitative Performance Data
A 2015 validation study provides concrete data comparing three trypan blue exclusion-based methods for counting CHO-K1 and U937 cells, relevant to bioprocessing [27]. The results underscore the performance differences highlighted in the table above.
Table 1: Performance Metrics from a Method Validation Study (CHO-K1 Cells) [27]
| Method | Accuracy (% Nominal Concentration) | Precision (%CV) | Linearity (R²) | Analysis Time |
|---|---|---|---|---|
| Manual Hemocytometer | 89.5% - 104.2% | 7.5% - 14.2% | > 0.99 | Sample-dependent |
| Semi-Automated (Countess) | 93.3% - 105.0% | 4.1% - 6.3% | > 0.99 | < 1 minute |
| Fully Automated (Vi-CELL XR) | 95.8% - 102.8% | 2.5% - 5.5% | > 0.99 | < 2.5 minutes |
Table 2: Performance Metrics from a cGMP Validation Study (hiPSCs) [19]
| Method | Parameter | Result |
|---|---|---|
| Manual (Bürker hemocytometer) | Intra-operator reproducibility | Lower precision |
| Automated (NucleoCounter NC-100) | Intra-operator reproducibility | Higher precision |
| Automated (NucleoCounter NC-100) | Inter-operator reproducibility | Higher precision |
| Automated (NucleoCounter NC-100) | Accuracy & Specificity | Demonstrated for hiPSCs |
Experimental Protocols for Method Validation
To generate the comparative data essential for a fit-for-purpose selection, laboratories must implement structured experimental protocols. The following methodologies are endorsed by international standards.
Dilution Series Experiment for Linearity and Precision
The ISO 20391-2:2019 standard provides a framework for evaluating cell counting method performance in the absence of reference materials, aligning with the ICH Q2(R1) principles of assessing precision and linearity [79] [14].
Protocol Summary: [79] [27] [14]
- Sample Preparation: Create a high-concentration stock solution of the cells you routinely use. Perform a serial 1:1 dilution to generate at least 5 distinct concentration levels covering your expected working range.
- Data Acquisition: Count each dilution level multiple times (e.g., n=3-5 replicates) using the method under validation. To assess intermediate precision, have multiple operators perform the counts on different days.
- Statistical Analysis:
- Linearity: Plot the mean measured concentration for each dilution level against the expected relative concentration. Calculate the coefficient of determination (R²); a value close to 1.0 indicates high linearity [81] [27].
- Precision: Calculate the percent coefficient of variation (%CV) for the replicates at each concentration level. This quantifies the method's repeatability and intermediate precision [27] [14].
Method Comparison Using Bland-Altman Analysis
When replacing a current method (e.g., a manual hemocytometer) with a new one, it is critical to understand the bias between them.
Protocol Summary: [14]
- Sample Analysis: Count a wide range of cell concentrations, covering low, medium, and high values, using both the old and new methods.
- Bias Calculation: For each sample, calculate the difference between the measurements from the two methods.
- Plot and Analyze: Create a Bland-Altman plot, displaying the average of the two measurements (on the x-axis) against the difference between them (on the y-axis). This visual tool helps identify any systematic bias and determines the "limits of agreement" between the two methods [14].
The Scientist's Toolkit: Essential Research Reagents and Materials
Table 3: Key Reagents and Materials for Cell Counting Validation
| Item | Function / Purpose |
|---|---|
| Cell Lines (e.g., CHO-K1, U937) [27] | Standardized biological models for method development and validation. |
| Viability Stain (e.g., Trypan Blue) [27] [48] | Differentiates live (unstained) from dead (stained) cells based on membrane integrity. |
| Fluorescent Viability Stains (e.g., AO/DAPI) [81] [14] | Offer more specific and robust viability assessment, often used in advanced systems. |
| Size Standard Beads [27] | Used to calibrate instrument focus and verify size gating accuracy. |
| ViaCheck Control Beads [27] | Pre-made standards with defined concentration and viability for daily instrument qualification. |
| Automated Cell Counter (e.g., NucleoCounter, Vi-CELL) [27] [19] | Instrumentation that automates staining, imaging, and analysis to reduce human error. |
A Practical Workflow for Fit-for-Purpose Selection
Navigating method selection and validation requires a strategic approach. The following workflow, based on ISO 20391-1 and ICH Q14's "Analytical Target Profile" concept, provides a logical path from defining needs to final implementation [80] [78].
Key Takeaways for Implementation
- Embrace Standards: Leverage ICH Q2(R1), ISO 20391-1, and ISO 20391-2 as the foundational frameworks for your validation strategy [79] [78].
- Quantify Performance: Move beyond qualitative assessments. Use dilution series and comparative studies to generate quantitative data on precision, linearity, and bias [27] [14].
- Automation Enhances Control: Automated cell counting methods consistently demonstrate superior precision and lower operator-dependent variability, making them strongly preferable for cGMP manufacturing and other high-stakes environments [27] [19].
- Selection is Holistic: The "best" method is not universal. It is the one that most effectively meets the specific performance requirements of your product's intended use [80] [14].
Conclusion
The successful validation of a cell counting method is not merely a regulatory hurdle but a critical component in ensuring the safety, potency, and efficacy of cell-based therapies. By systematically applying ICH Q2(R1) principles—from establishing foundational knowledge and executing rigorous protocols to troubleshooting real-world challenges—scientists can build robust, GMP-compliant quality control systems. The future of ATMP manufacturing will be increasingly shaped by advanced automated technologies that enhance precision and standardization. A thorough, well-documented validation process provides the essential data and confidence needed for regulatory submissions and, ultimately, for delivering reliable treatments to patients.
References
- 1. EMA Proposes Revisions to GMP Guideline for ATMPs [https://www.gmp-compliance.org/gmp-news/ema-proposes-revisions-to-gmp-guideline-for-atmps]
- 2. EMA Guideline On Clinical-Stage ATMPs Comes Into Effect [https://www.cellandgene.com/doc/ema-guideline-on-clinical-stage-atmps-comes-into-effect-on-the-verge-of-convergence-0001]
- 3. The ISSCR Responds to EMA's Concept Paper on ... [https://www.isscr.org/isscr-news/the-isscr-responds-to-emas-concept-paper-on-the-revision-of-part-iv-guidelines-on-gmp-specific-to-atmps]
- 4. New: Points to Consider on Materials in ATMP Manufacturing [https://www.pda.org/about-pda/press-releases/press-release-detail/new-points-to-consider-on-materials-in-atmp-manufacturing-available-now]
- 5. Challenges of Cell Counting in Cell Therapy Products - PMC [https://pmc.ncbi.nlm.nih.gov/articles/PMC11520012/]
- 6. Assessing the suitability of cell counting methods during ... [https://www.frontiersin.org/journals/bioengineering-and-biotechnology/articles/10.3389/fbioe.2023.1223227/full]
- 7. Validation of an automated cell counting method for cGMP ... [https://pubmed.ncbi.nlm.nih.gov/35198419/]
- 8. ICH Q2(R1) guideline for pharmaceutical validation [https://www.linkedin.com/posts/adel-nabil-333b7120_ich-q2r1-is-an-international-council-for-activity-7329102640116555776-b_pk]
- 9. Key Validation Characteristics in ICH Q2 [https://altabrisagroup.com/validation-characteristics-ich-q2/]
- 10. Q2(R1) Validation of Analytical Procedures: Text and ... [https://www.fda.gov/regulatory-information/search-fda-guidance-documents/q2r1-validation-analytical-procedures-text-and-methodology-guidance-industry]
- 11. Quo Vadis Analytical Procedure Development and ... [https://www.spectroscopyonline.com/view/quo-vadis-analytical-procedure-development-and-validation]
- 12. ( ICH ) Validation of Analytical Procedures: Text and Methodology... Q 2 R 1 [https://www.gmp-compliance.org/guidelines/gmp-guideline/ich-q2r1-validation-of-analytical-procedures-text-and-methodology]
- 13. Method categories according to the ICH Q2(R1) - Lösungsfabrik [https://mpl.loesungsfabrik.de/en/english-blog/method-validation/method-categories]
- 14. Practical application of cell method performance evaluation... counting [https://www.insights.bio/cell-and-gene-therapy-insights/journal/article/2177/Practical-application-of-cell-counting-method-performance-evaluation-and-comparison-derived-from-the-ISO-Cell-Counting-Standards-Part-1-and-2]
- 15. Validation of a method evaluating T cell metabolic potential in... [https://pmc.ncbi.nlm.nih.gov/articles/PMC7789274/]
- 16. Navigating the Biopharmaceutical Method Validation [https://synergbiopharma.com/navigating-the-evolution-from-ich-q2r1-to-ich-q2r2-and-implementation-of-ich-q14-in-biopharmaceutical-method-validation/]
- 17. Cell-Based Potency Assay Development [https://www.bioprocessintl.com/product-characterization/analytical-methods-for-cell-therapies-method-development-and-validation-challenges]
- 18. Validation of analytical methods in GMP: the disposable Fast ... [https://translational-medicine.biomedcentral.com/articles/10.1186/1479-5876-10-112]
- 19. Validation of an automated cell counting method for cGMP ... [https://www.sciencedirect.com/science/article/pii/S2215017X22000091]
- 20. Evaluating the Quality of Cell Counting Methods [https://www.nist.gov/programs-projects/evaluating-quality-cell-counting-methods-experimental-design-and-statistical]
- 21. Assessing the suitability of cell counting methods during ... [https://pmc.ncbi.nlm.nih.gov/articles/PMC10438949/]
- 22. CellDrop Performance Data | Technical Note 196 [https://www.denovix.com/tn-196-celldrop-performance-data/]
- 23. Comparison of six different methods to calculate cell densities [https://plantmethods.biomedcentral.com/articles/10.1186/s13007-018-0297-4]
- 24. Analysis of the measurements used as potency tests for the 31 ... [https://translational-medicine.biomedcentral.com/articles/10.1186/s12967-025-06253-4]
- 25. How Potency Assay Strategy Can Accelerate Cell Therapy ... [https://slingshotbio.com/how-potency-assay-strategy-can-accelerate-cell-therapy-development/]
- 26. Validation of analytical methods in GMP: the disposable Fast ... [https://pmc.ncbi.nlm.nih.gov/articles/PMC3502295/]
- 27. Validation of three viable-cell counting methods [https://pmc.ncbi.nlm.nih.gov/articles/PMC5466062/]
- 28. Potency Assurance for Cellular and Gene Therapy Products [https://www.asgct.org/advocacy/policy-statements/potency-assurance-for-cellular-and-gene-therapy-products]
- 29. New insights on potency assays from recent advances and ... [https://www.frontiersin.org/journals/immunology/articles/10.3389/fimmu.2025.1597888/full]
- 30. Cell Counting and Viability Assessment in Mammalian ... [https://cellculturecompany.com/cell-counting-and-viability-assessment-in-mammalian-cell-culture/]
- 31. What Makes For a Good Validation Master Plan? [https://www.thefdagroup.com/blog/2015/03/what-makes-for-a-good-validation-master-plan/]
- 32. ICH Guidelines for Analytical Method Validation Explained [https://amsbiopharma.com/ich-guidelines-analytical-method/]
- 33. Key Components of a Validation Master Plan (VMP) [https://jjccgroup.org/validation-master-plan-vmp/]
- 34. What is a Validation Master Plan (VMP)? [https://www.getreskilled.com/validation/validation-master-plan/]
- 35. Nine steps for creating a master validation plan [https://www.gmpsop.com/creating-a-master-validation-plan/]
- 36. Method Validation : What Are Its Key | PPTX Parameters [https://www.slideshare.net/slideshow/validation-parameters/41555229]
- 37. The 6 Key Aspects of Analytical Method Validation [https://www.elementlabsolutions.com/uk/chromatography-blog/post/6-key-aspects-of-analytical-method-validation]
- 38. The Comparison of Methods Experiment [https://www.westgard.com/lessons/basic-method-validation/lesson23.html]
- 39. Statistical analysis in method comparison studies part one [https://acutecaretesting.org/en/articles/statistical-analysis-in-method-comparison-studies-part-one]
- 40. Dilutions: Explanations and Examples of Common Methods [https://www.quansysbio.com/support/dilutions-explanations-and-examples/]
- 41. A linear validation method of analytical procedures based ... [https://www.sciencedirect.com/science/article/abs/pii/S0003267024004963]
- 42. A step by step guide to quantitative comparisons in ... [https://finbiosoft.com/a-step-by-step-guide-to-quantitative-comparisons-in-validation-manager/]
- 43. Fast-Read® 102 - Biosigma: Biotechnology and Clinical [https://www.biosigma.com/products/urine-reading-system/fast-read-102/]
- 44. Fast-Read 102® plastic counting chamber - Cell counting [https://www.milian.com/product/0D-14-11?language=en]
- 45. counting Manual - chamber - Fast ® Read - Biosigma SPA 102 [https://www.medicalexpo.com/prod/biosigma-spa/product-67846-1120745.html]
- 46. Disposible Single-Use Cell Counting Slide, FastRead 102 [https://www.3hbiomedical.com/consumables-1/cell-counting/fastread-102]
- 47. Validation of an automated cell counting method for cGMP ... [https://pmc.ncbi.nlm.nih.gov/articles/PMC8851089/]
- 48. The Secrets of the World of Cell Counters [https://chemometec.com/the-ultimate-guide-to-cell-counters/]
- 49. Cell counting in GMP environments [https://chemometec.com/cell-counting-in-gmp-environments/]
- 50. The Ultimate Guide to Choosing an Automated Cell Counter [https://logosbio.com/the-ultimate-guide-to-choosing-an-automated-cell-counter-without-regret/]
- 51. Understanding and managing sources of variability in cell ... [https://www.insights.bio/cell-and-gene-therapy-insights/journal/article/451/Understanding-and-managing-sources-of-variability-in-cell-measurements]
- 52. Overview of Cell Counting Methods: Manual and Automated [https://logosbio.com/how-to-count-cells-an-overview-of-cell-counting-methods/]
- 53. Manually Counting Cells in a Hemocytomer [https://www.thermofisher.com/us/en/home/references/gibco-cell-culture-basics/cell-culture-protocols/counting-cells-in-a-hemacytometer.html]
- 54. The Importance Of Accurate Cell Counting In Flow ... [https://www.thermofisher.com/us/en/home/life-science/cell-analysis/cell-analysis-learning-center/cell-analysis-resource-library/cell-analysis-application-notes/importance-accurate-cell-counting-flow-cytometry-cell-sorting.html]
- 55. Measurement quality metrics to improve absolute microbial ... [https://www.frontiersin.org/journals/microbiology/articles/10.3389/fmicb.2025.1631377/full]
- 56. Automated smartphone based cell analysis platform [https://www.nature.com/articles/s44303-025-00093-z]
- 57. Current challenges and future directions of ATMPs in ... [https://pmc.ncbi.nlm.nih.gov/articles/PMC12274769/]
- 58. Sampling And Testing of ATMPs: Gaining Insights From ... [https://www.ipsdb.com/happenings/insights/sampling-and-testing-of-atmps-gaining-insights-from-pic-s-annex-2a]
- 59. Validation of analytical methods in GMP: the disposable ... [https://pubmed.ncbi.nlm.nih.gov/22650233/]
- 60. Cell Counter Selection Guide [https://www.rwdstco.com/cell-counter-selection-guide/]
- 61. Operator Training Is a Process, Not an Event [https://www.ease.io/blog/operator-training-is-a-process/]
- 62. How to Close the Operator Competency Gap in Process ... [https://blog.isa.org/how-to-close-the-operator-competency-gap-in-process-industries]
- 63. Guidance for robustness/ruggedness tests in method ... [https://www.sciencedirect.com/science/article/abs/pii/S073170850000529X]
- 64. Method Robustness Considerations for Successful Product ... [https://www.pharmoutsourcing.com/Featured-Articles/174550-Method-Robustness-Considerations-for-Successful-Product-Commercialization/]
- 65. Method Validation and Robustness [https://www.chromatographyonline.com/view/method-validation-and-robustness]
- 66. Cell Cytometry: Review and Perspective on Biotechnological ... [https://pmc.ncbi.nlm.nih.gov/articles/PMC6591278/]
- 67. Hemocytometer [https://en.wikipedia.org/wiki/Hemocytometer]
- 68. Using a Hemocytometer for Cell Counting | Protocol [https://www.stemcell.com/how-to-count-cells-with-a-hemocytometer.html]
- 69. Spilling the secrets: How to count cells with a hemocytometer [https://chemometec.com/how-to-count-cells-with-a-hemocytometer/]
- 70. Validation of an Automated Cell Counter Method for HLA-DR ... [https://pmc.ncbi.nlm.nih.gov/articles/PMC12071788/]
- 71. Coefficient of Variation: Mastering Relative Variability in ... [https://www.6sigma.us/six-sigma-in-focus/coefficient-of-variation/]
- 72. GMPs for Method Validation in Early Development [https://www.pharmtech.com/view/gmps-method-validation-early-development-industry-perspective-part-ii]
- 73. Beginner's Guide to 21 CFR Part 11 Compliance [https://www.advarra.com/blog/beginners-guide-to-21-cfr-part-11-compliance/]
- 74. Validation of Systems – 21 CFR 11.10(a) [https://www.ofnisystems.com/information/resources/introduction-to-21-cfr-11/21-cfr-11-10a-validation-of-systems/]
- 75. ICH Q2(R2) Validation of analytical procedures [https://www.ema.europa.eu/en/ich-q2r2-validation-analytical-procedures-scientific-guideline]
- 76. One Company's Path to 21 CFR 11 Validation [https://filehold.com/resources/case-studies/usfda-21cfr-part11-validation/]
- 77. DE Case Study: 21 CFR Part 11 Validation of an APCS [https://www.deatonengineering.com/case_studies/apcs.php]
- 78. ICH and FDA Guidelines for Analytical Method Validation [https://www.labmanager.com/ich-and-fda-guidelines-for-analytical-method-validation-34252]
- 79. Cell Counting for Cell Therapies | NIST [https://www.nist.gov/programs-projects/cell-counting-cell-therapies]
- 80. Cell Counting Method Selection [https://www.revvity.com/ask/cell-counting-method-selection]
- 81. Cell Counting Method: Your Cheat Sheet For A Correct Count [https://chemometec.com/how-the-meticulous-researcher-validates-their-cell-counting-method/]