Decoding Cell Fate: A Comprehensive Guide to Pseudotime Analysis in Stem Cell Differentiation
This article provides a comprehensive overview of pseudotime analysis for reconstructing stem cell differentiation trajectories from single-cell RNA-sequencing (scRNA-seq) data.
Decoding Cell Fate: A Comprehensive Guide to Pseudotime Analysis in Stem Cell Differentiation
Abstract
This article provides a comprehensive overview of pseudotime analysis for reconstructing stem cell differentiation trajectories from single-cell RNA-sequencing (scRNA-seq) data. Tailored for researchers and drug development professionals, it covers foundational concepts, key computational methods including Monocle, Slingshot, TSCAN, and emerging tools like Lamian and Sceptic. The scope extends to practical application guidelines, strategies for troubleshooting common pitfalls like confounding cell cycle effects, and rigorous frameworks for validating and comparing trajectories across multiple experimental conditions. By integrating the latest methodological advancements, this guide aims to empower robust analysis of dynamic transcriptional programs governing cell fate decisions.
From Single Snapshots to Dynamic Processes: Core Principles of Pseudotime
In the study of dynamic biological processes, such as stem cell differentiation, researchers rely on temporal concepts to understand the progression of cells from one state to another. Two key concepts used in this context are canonical expression time and pseudotime [1].
Canonical expression time refers to the actual chronological time during which gene expression changes occur in a biological process. It is measured in real-time units (minutes, hours, days) and is typically determined through time-course experiments where samples are collected at specific time points. This approach requires physical samples to be taken at multiple intervals throughout the process, which can be logistically challenging or biologically unfeasible for certain systems, such as human embryonic development [1].
Pseudotime addresses this limitation as a computational construct used to order individual cells based on their gene expression profiles, representing progression through a biological process without relying on actual chronological time. This approach is particularly valuable in single-cell RNA sequencing (scRNA-seq) studies where cells are captured at a single time point but represent different stages of a continuous process. Instead of minutes or hours, pseudotime is inferred using algorithms that order cells along a trajectory based on similarities in their gene expression profiles [1].
For stem cell differentiation research, pseudotime analysis enables the reconstruction of developmental trajectories from snapshot data, allowing researchers to model the differentiation process, identify key regulatory genes, and discover critical transition points that might be missed in bulk sequencing approaches that average expression across cell populations [1] [2].
Computational Methodology for Pseudotime Reconstruction
Core Conceptual Framework
Pseudotime analysis fundamentally addresses the challenge of reconstructing continuous biological processes from single-cell snapshot data. When studying processes like stem cell differentiation, a single biological sample contains cells at different stages of progression. Pseudotime algorithms computationally order these cells based on the gradual transition of their transcriptomes, creating a trajectory that represents the underlying biological process [3].
The resulting "pseudotime" value is a quantitative measure of progress through the biological process. In stem cell differentiation, cells with larger pseudotime values are typically more differentiated. However, it is crucial to recognize that pseudotime may not always correspond directly to real chronological time, particularly in processes without clear directionality or in systems where cells can move bidirectionally along the trajectory [2].
Common Algorithmic Approaches
Several computational methods have been developed for pseudotime reconstruction, each with distinct theoretical foundations and implementation strategies:
- TSCAN employs a cluster-based minimum spanning tree (MST) approach. Cells are first grouped into clusters, then an MST is constructed to connect cluster centers. Cells are projected onto the tree structure to determine their pseudotemporal ordering. This approach reduces complexity by working with clusters rather than individual cells, improving stability [3].
- Monocle (2 and 3) uses reversed graph embedding (Monocle 2) or a single-rooted directed acyclic graph (Monocle 3) to model cell trajectories [4].
- Slingshot incorporates a principal curves approach to fit smooth curves through the data, allowing cells to be ordered along these curves [2].
- Sceptic represents a newer, supervised approach that uses a support vector machine (SVM) framework trained on time-series data to predict pseudotime values, potentially offering improved accuracy [4].
Addressing Multi-Sample Complexity with Lamian
Recent methodological advances address the challenge of analyzing pseudotemporal patterns across multiple samples or experimental conditions. Lamian provides a comprehensive statistical framework for differential multi-sample pseudotime analysis that identifies three types of changes in pseudotemporal trajectories [5]:
- Topological differences: Changes in the fundamental structure of the trajectory, such as the appearance or disappearance of cell lineages.
- Cell density changes: Shifts in the proportion of cells along different branches of the trajectory.
- Gene expression changes: Alterations in how genes are expressed along pseudotime across conditions.
Unlike earlier methods that treated cells from multiple samples as a single population, Lamian explicitly accounts for sample-to-sample variation, reducing false discoveries that are not generalizable to new samples [5].
Experimental Protocols and Workflows
TSCAN Protocol for Pseudotime Reconstruction
The following protocol outlines the key steps for implementing TSCAN-based pseudotime analysis in stem cell differentiation research:
Step 1: Data Preprocessing and Dimension Reduction
- Filter genes with zero counts across all cells.
- Perform logarithmic transformation and normalize across cells.
- Cluster genes with similar expression patterns to mitigate dropout effects (create approximately 5% of total genes clusters).
- Average expression within gene clusters to create stable cluster-level expression measurements.
- Apply principal component analysis (PCA) to reduce dimensionality while retaining biological signal.
- Determine optimal number of principal components using a piecewise linear model to identify the "elbow point" [3].
Step 2: Cell Clustering and Trajectory Construction
- Cluster cells based on their reduced-dimension representations.
- Compute cluster centroids by averaging coordinates of member cells.
- Construct a minimum spanning tree (MST) connecting cluster centroids.
- Identify potential outgroups to avoid connecting biologically unrelated populations [2].
Step 3: Pseudotime Calculation and Ordering
- Designate a root node (starting point) based on biological knowledge or marker gene expression.
- Project individual cells onto the nearest edge of the MST.
- Calculate pseudotime as the distance along the MST from the root node to each cell's projection point.
- For branched trajectories, enumerate all paths from root to terminal nodes, generating multiple pseudotime orderings [2].
Step 4: Visualization and Interpretation
- Visualize the MST and pseudotime ordering in low-dimensional spaces (PCA, t-SNE, UMAP).
- Validate ordering using known marker genes expected to change along differentiation.
- Manually adjust cluster ordering through graphical interface if biological knowledge warrants [3].
Advanced Multi-Sample Protocol Using Lamian
For studies comparing stem cell differentiation across multiple conditions (e.g., healthy vs. disease, control vs. treatment), the Lamian framework provides this extended protocol:
Step 1: Data Harmonization
- Harmonize scRNA-seq data from multiple samples into a common low-dimensional space using methods like Seurat, Harmony, or scVI.
- Input normalized gene expression matrices and sample-level metadata (conditions, batches) [5].
Step 2: Trajectory Construction and Topology Assessment
- Construct a joint pseudotemporal trajectory across all samples.
- Quantify branch uncertainty using bootstrap resampling to calculate detection rates.
- Model branch cell proportions across samples to identify topological changes [5].
Step 3: Differential Analysis
- Test for topological differences associated with sample covariates using binomial or multinomial logistic regression.
- Identify temporal differential expression (TDE) using functional mixed effects models to find genes with non-constant activity along pseudotime.
- Detect covariate-associated differential expression (XDE) to find genes whose pseudotemporal expression patterns differ across conditions [5].
Visualization and Analysis Tools
Research Reagent Solutions
The following table outlines essential computational tools and their applications in pseudotime analysis for stem cell differentiation research:
| Tool/Resource | Primary Function | Application Context | Key Features |
|---|---|---|---|
| TSCAN | Cluster-based MST trajectory inference | Unsupervised pseudotime reconstruction | GUI for interactive adjustment; pre-clustering reduces complexity [3]. |
| Monocle (2 & 3) | Trajectory inference using reversed graph embedding or DAGs | General pseudotime analysis | Widely adopted; supports complex trajectory topologies [4]. |
| Slingshot | Principal curves-based trajectory fitting | Lineage inference in development | Smooth curves through data; multiple lineage capabilities [2]. |
| Lamian | Differential multi-sample pseudotime analysis | Comparing trajectories across conditions | Accounts for sample variability; detects topology, density, and expression changes [5]. |
| Sceptic | Supervised pseudotime using SVM | Time-series single-cell data | High prediction accuracy; applicable to multiple data modalities [4]. |
| Pseudotimecascade | Visualization of gene expression cascades | Analyzing coordinated gene programs | Links expression cascades to biological functions; identifies regulatory hierarchies [6]. |
Visualizing Gene Expression Dynamics
Advanced visualization tools like Pseudotimecascade enable researchers to move beyond single-gene analysis to study coordinated gene expression programs. This tool visualizes multi-gene expression cascades along pseudotime and links these cascades to biological functions by identifying stage-specific pathways. When applied to hematopoietic stem cell differentiation, Pseudotimecascade successfully highlights regulatory hierarchies and stage-specific processes, providing deeper understanding of the gene programs governing cell fate decisions [6].
Theoretical Foundations and Biological Interpretation
The Waddington Landscape Analogy
Pseudotime analysis finds a compelling conceptual framework in Waddington's epigenetic landscape, which metaphorically represents cell differentiation as a ball rolling downhill through a rugged landscape. The landscape's geometry encodes molecular mechanisms that guide gene expression profiles of uncommitted cells toward terminally differentiated states. In this analogy, pluripotent stem cells occupy the top of the landscape with multiple possible paths, while differentiated cells reside in specific valleys [7].
Recent research has quantified this concept using intrinsic dimension (ID) analysis, which measures the complexity of gene expression patterns accessible to cells. Studies demonstrate that ID decreases with developmental time, reflecting the progressive constraint of cell states during differentiation. This provides a geometric basis for defining a cell potency score based solely on expression data, without requiring prior biological knowledge of marker genes [7].
Methodological Comparisons and Performance
Evaluations of pseudotime methods reveal important performance characteristics:
- TSCAN's cluster-first approach provides computational efficiency and stability benefits compared to cell-level MST construction [3].
- Sceptic's supervised approach demonstrates significantly higher accuracy (93.73%) compared to psupertime (89.94%) in predicting timestamps in mouse embryonic stem cell differentiation data [4].
- Lamian properly controls false discovery rates in multi-sample studies by accounting for cross-sample variability, unlike methods that pool cells from multiple samples [5].
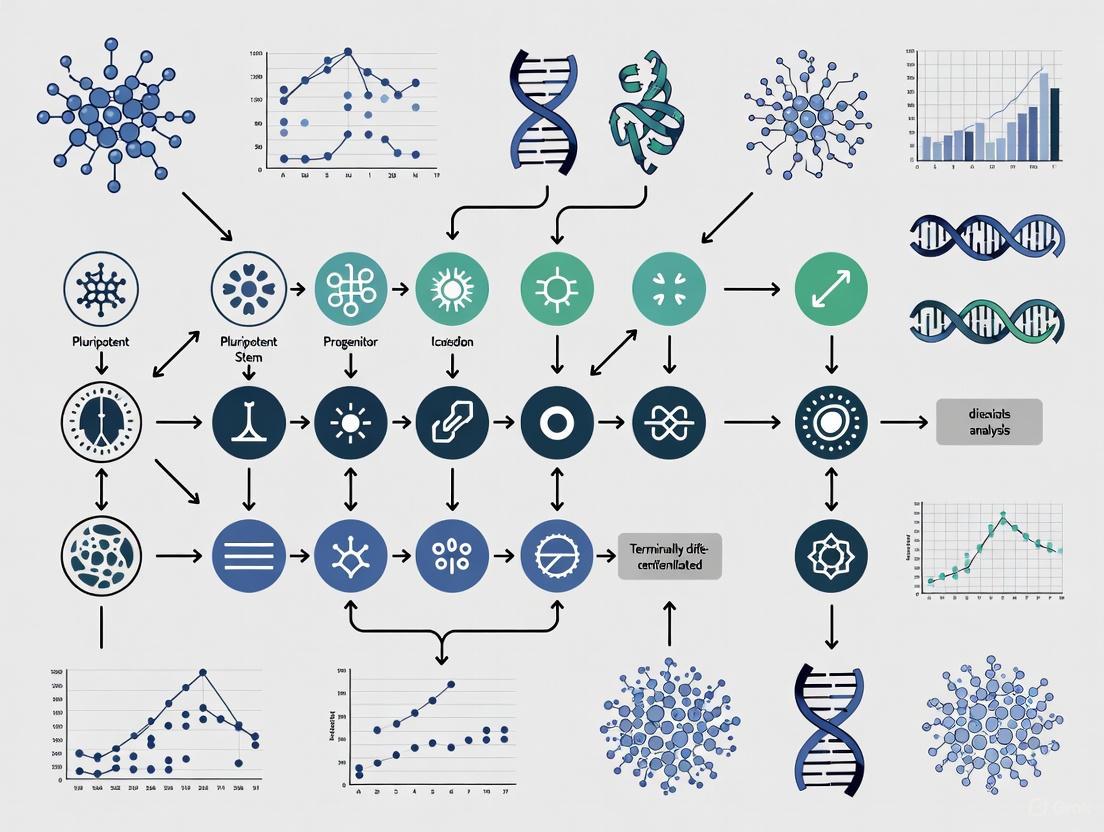
Workflow Diagram
Applications in Stem Cell Research and Therapeutic Development
Pseudotime analysis has enabled significant advances in understanding stem cell biology and developing therapeutic applications:
- Developmental Biology: Pseudotime has provided insights into the differentiation hierarchies of hematopoietic stem cells, revealing the sequence of gene expression changes as cells commit to different blood lineages [1] [2].
- Disease Modeling: In cancer research, pseudotime analysis helps model disease progression by identifying cells at different stages of malignancy and discovering early and late-stage disease markers [1].
- Regenerative Medicine: Studying differentiation of stem cells into specific cell types for regenerative therapies, pseudotime identifies key stages and regulatory genes involved in the differentiation process, enabling optimization of differentiation protocols [1].
- Immune Cell Dynamics: Pseudotime reveals the sequence of gene expression changes during T cell activation and differentiation, with implications for immunotherapy development [1].
The integration of pseudotime with other single-cell technologies, such as scATAC-seq for chromatin accessibility and single-nucleus imaging, further expands its applications. For example, Sceptic has been successfully applied to single-nucleus image data and scATAC-seq data, capturing sex-specific differentiation patterns and detecting methylation delays that agree with independent studies [4].
Quantitative Comparison of Pseudotime Analysis Methods
The table below summarizes the key characteristics and applications of major pseudotime analysis tools:
| Method | Algorithm Type | Sample Support | Branch Detection | Key Advantages | Limitations |
|---|---|---|---|---|---|
| TSCAN | Unsupervised, Cluster-based MST | Single sample | Yes | Computational efficiency; interactive GUI; reduced complexity via clustering | Sensitive to clustering quality; cannot handle complex topologies [2] [3] |
| Monocle 2/3 | Unsupervised, Reversed graph embedding/DAG | Single sample | Yes | Widely adopted; supports complex trajectories | High computational cost for large datasets [4] |
| Slingshot | Unsupervised, Principal curves | Single sample | Yes | Smooth curves; multiple lineage support | Results sensitive to initial clustering [2] |
| Lamian | Unsupervised with differential testing | Multiple samples | Yes | Accounts for sample variability; comprehensive differential testing | Complex statistical framework; requires multiple samples [5] |
| Sceptic | Supervised, SVM | Multiple time points | Limited | High accuracy; multi-modal data support | Requires time-series data for training [4] |
| Phenopath | Supervised, Linear trajectory | Multiple conditions | Limited | Can identify changes across conditions | Assumes linear expression changes; cannot handle non-linear differences [5] |
Pseudotime analysis represents a powerful computational framework for reconstructing cellular dynamics from static single-cell RNA-seq snapshots. By ordering cells based on their progression through biological processes like stem cell differentiation, researchers can infer temporal relationships and dynamic gene expression patterns without requiring extensive time-course experiments. The continuing development of more sophisticated algorithms—such as those accommodating multi-sample comparisons, integrating multiple data modalities, and providing robust statistical frameworks—ensures that pseudotime analysis will remain an essential tool for unraveling the complexities of cellular differentiation and fate decisions in stem cell biology and therapeutic development.
Contrasting Pseudotime with Canonical Time in Experimental Design
In single-cell RNA-sequencing (scRNA-seq) studies of dynamic biological processes like stem cell differentiation, researchers must navigate two distinct temporal frameworks: canonical time and pseudotime. Canonical expression time refers to the actual chronological time during which gene expression changes occur, measured in real-time units (minutes, hours, days) through time-course experiments where samples are collected at specific time points [1]. In contrast, pseudotime is a computational construct that orders individual cells based on their gene expression profiles along an inferred trajectory, representing their relative progression through a biological process without relying on known chronological time [1] [2].
Understanding the distinction, applications, and limitations of these frameworks is crucial for designing robust experiments and accurately interpreting stem cell differentiation trajectories. This article provides a structured comparison and outlines practical protocols for integrating both approaches in regenerative medicine and drug development research.
Conceptual and Practical Distinctions
The core difference between these frameworks lies in their fundamental nature and measurement. Canonical time is an objective, pre-defined external variable, whereas pseudotime is a latent variable inferred from high-dimensional gene expression data [1]. This distinction creates specific trade-offs that researchers must consider in their experimental design.
Table 1: Core Conceptual Differences Between Canonical Time and Pseudotime
| Feature | Canonical Time | Pseudotime |
|---|---|---|
| Nature of Measurement | Objective, external chronological timeline | Computationally inferred ordering of cells |
| Units | Real-time (minutes, hours, days) | Unitless, relative progression |
| Data Requirement | Multiple samples collected at specific time points | Single snapshot of a heterogeneous cell population |
| Temporal Resolution | Fixed by experimental design | Continuous, single-cell resolution |
| Primary Application | Time-course studies of synchronized processes | Reconstructing trajectories from asynchronous populations |
Implications for Experimental Design
Choosing the appropriate temporal framework depends heavily on the biological question and system. Canonical time is ideal for studying synchronized processes where the timeline is known and controllable, such as immediate-early response to stimuli or highly coordinated developmental stages where samples can be collected at precise intervals [1]. Pseudotime excels in contexts where processes are fundamentally asynchronous across a cell population, such as homeostatic tissue renewal, disease progression in patient samples, or in vitro differentiation systems with variable kinetics [1] [8].
Each approach carries distinct limitations. Canonical time measurements can miss rapid transition states if sampling frequency is insufficient and may fail to resolve cellular heterogeneity within time points. Pseudotime inference, while powerful, contains inherent uncertainties in trajectory reconstruction and pseudotime assignment, and does not directly provide information about the absolute duration or rate of biological processes [2].
Quantitative Comparison Framework
The relationship between canonical time and pseudotime can be formally described using a mathematical framework that transforms between chronological and biological time scales. For a time point ( t^* ), the corresponding biological time ( \tau^* ) is given by:
[ \tau^* = t^* \cdot L ]
where ( L = L(\omega) = D^{-1}(\omega) ) characterizes the timing of a life history event and depends on a set of predictors ( \omega ) associated with environmental fluctuations [9]. This transformation highlights that biological time represents the proportion of chronological time needed to reach a specific life history event, such as cell differentiation.
Table 2: Methodological Comparison for Analyzing Temporal Processes
| Analysis Aspect | Canonical Time Approach | Pseudotime Approach |
|---|---|---|
| Differential Expression | Compare expression across predefined time groups | Identify genes where expression changes significantly along inferred trajectory (TDE) [5] |
| Multi-sample Analysis | Linear models with time as a fixed effect | Methods like Lamian account for cross-sample variability to reduce false discoveries [5] |
| Trajectory Topology | Limited to observed time points | Can identify branching events, loops, and changes in topology across conditions [5] |
| Cell Density Changes | Count cells in predefined states at each time | Quantify changes in cell abundance along pseudotime branches [5] |
The statistical framework Lamian addresses a critical gap in pseudotime analysis by properly accounting for sample-to-sample variation when identifying changes in gene expression, cell density, and trajectory topology associated with sample covariates [5]. Unlike methods that ignore this variability, Lamian substantially reduces sample-specific false discoveries that do not generalize to new samples, making it particularly valuable for multi-sample experimental designs common in stem cell research [5].
Integrated Experimental Protocols
Protocol 1: Multi-Sample Pseudotime Analysis with Lamian
Purpose: To identify differential pseudotemporal patterns across multiple experimental conditions (e.g., different stem cell lines, drug treatments) while accounting for biological replication.
Workflow:
Input Requirements:
- Low-dimensional representation of cells (PCs or harmonized embeddings) from multiple samples
- Normalized scRNA-seq gene expression matrices
- Sample-level metadata with covariates (e.g., condition, batch)
Module 1: Trajectory Construction and Uncertainty Quantification
- Data Harmonization: Use Seurat, Harmony, or scVI to integrate cells from all samples into a common space [5].
- Joint Clustering: Cluster all cells jointly using the harmonized data.
- Trajectory Inference: Apply TSCAN's cluster-based minimum spanning tree (cMST) to construct pseudotemporal trajectory [5] [2].
- Branch Annotation: Specify start of pseudotime using known marker genes or biological priors.
- Uncertainty Assessment: Calculate branch detection rates through bootstrap resampling of cells.
Module 2: Differential Topology Analysis
- Branch Proportion Calculation: For each sample, compute the proportion of cells in each tree branch.
- Variance Estimation: Characterize cross-sample variation by estimating variance of branch cell proportions.
- Association Testing: Fit regression models (binomial or multinomial logistic) to test whether branch proportions are associated with sample covariates.
Module 3: Differential Expression and Cell Density Analysis
- Functional Modeling: For each gene, fit functional mixed effects models along pseudotime.
- TDE Testing: Identify genes whose expression changes along pseudotime (TDE - pseudotime differential expression).
- XDE Testing: Identify genes whose pseudotemporal expression patterns are associated with sample covariates (XDE - covariate differential expression) [5].
- Cell Density Testing: Evaluate whether cell density along pseudotime varies with experimental conditions.
Protocol 2: Supervised Pseudotime Analysis with Sceptic
Purpose: To leverage time-series scRNA-seq data with known collection time points to improve pseudotime inference accuracy.
Workflow:
Methodology:
- Input Preparation: Format time-series scRNA-seq data with known collection time points for each cell.
- Classifier Training: Train a series of one-versus-the-rest support vector machine (SVM) classifiers, generating for each cell a probability vector over all time points in the dataset [10].
- Pseudotime Calculation: Compute pseudotime values via conditional expectation based on classifier outputs.
- Cross-Validation: Implement standard cross-validation to prevent overfitting and ensure generalizability.
Advantages: Sceptic demonstrates higher accuracy in predicting timestamps compared to alternative methods like psupertime, particularly for complex trajectory structures including bifurcations [10]. The method also generalizes well to other data modalities including scATAC-seq and single-nucleus imaging data.
The Scientist's Toolkit
Table 3: Essential Computational Tools for Pseudotime Analysis
| Tool/Resource | Function | Application Context |
|---|---|---|
| Lamian | Comprehensive multi-sample differential pseudotime analysis | Identifying condition-associated changes in trajectory topology, gene expression, and cell density [5] |
| Sceptic | Supervised pseudotime inference using SVM | Leveraging time-series data to improve pseudotime accuracy across modalities [10] |
| Monocle3 | Trajectory inference and pseudotime estimation | General-purpose trajectory analysis with single-rooted directed acyclic graphs [8] [10] |
| TSCAN | Cluster-based minimum spanning tree for trajectory inference | Scalable trajectory construction with branch uncertainty quantification [5] [2] |
| Slingshot | Principal curves for trajectory inference | Fitting one-dimensional curves through cell populations in expression space [2] |
| hctsa Library | Comprehensive time-series feature extraction (>7000 features) | Characterizing dynamical patterns in temporal data [11] |
| catchaMouse16 | Reduced feature set (16 features) optimized for fMRI | Efficient quantification of informative dynamical patterns in neural time series [11] |
Canonical time and pseudotime offer complementary lenses for investigating stem cell differentiation dynamics. Canonical time provides the essential ground truth for temporal processes, enabling direct measurement of kinetics and synchronization. Pseudotime reconstructs developmental trajectories from snapshot data, revealing cellular heterogeneity and transitional states invisible to bulk measurements. The emerging generation of computational tools like Lamian and Sceptic enables more statistically rigorous multi-sample comparisons and leverages supervised learning to improve trajectory inference. By understanding the distinct advantages and limitations of each temporal framework and implementing the protocols outlined, researchers can design more informative experiments and extract deeper biological insights from stem cell differentiation studies.
Key Biological Questions Addressed by Trajectory Inference in Stem Cell Biology
Trajectory inference (TI) is a computational methodology used to order single-cell omics data along a path that reflects a continuous transition between cellular states [12]. In stem cell biology, this approach is fundamentally transforming how researchers study processes like cellular differentiation, where a pluripotent stem cell matures into a specialized cell type, and the dysregulation of these processes in pathological conditions [12] [2]. The method addresses a critical experimental limitation: most single-cell approaches, such as transcriptomics or proteomics, are inherently destructive to the cells, making it impossible to physically track a cell's changing molecular profile across time [12]. Trajectory inference overcomes this by computationally stitching together separate snapshots of individual cells to reconstruct a continuous path of development [12].
The ordering derived from this process, referred to as "pseudotime," simulates the progression of a cell away from a reference cell state (e.g., a pluripotent stem cell) and can model multiple branching paths representing distinct cell fate decisions [12] [2]. Pseudotime provides a quantitative measure of progress through a biological process, allowing researchers to segregate a collection of measured cells along a developmental trajectory, even when cells are collected at a single time point [4]. This capability makes trajectory inference a pivotal tool for exploring the molecular dynamics that govern stem cell fate, lineage commitment, and the emergence of cellular heterogeneity.
Key Biological Questions and Applications
Trajectory inference enables stem cell researchers to address a range of previously intractable biological questions. The table below summarizes the primary applications and the specific biological questions they target.
Table 1: Key Biological Questions Addressed by Trajectory Inference in Stem Cell Biology
| Application Domain | Key Biological Questions | Representative Findings |
|---|---|---|
| Lineage Specification & Fate Decisions | How does a multipotent stem cell choose between distinct differentiation lineages? Which genes drive lineage bifurcation? | Identification of genes associated with T-cell vs. NK cell lineage commitment in hematopoietic development [13]. |
| Developmental Patterning | What is the sequence of transcriptional changes during embryonic development? How do progenitor cells acquire spatial and functional identity? | Mapping of neuron development trajectories in mouse embryonic neural crest cells, revealing genes associated with functional maturation [13]. |
| Disease Modeling & Pathological Reprogramming | How does a disease state (e.g., cancer) alter normal differentiation trajectories? What are the molecular hallmarks of pathological transformation? | In glioblastoma (GB), identification of immature astrocyte subpopulations with high urea cycle scores associated with tumor progression [14]. |
| Cross-Condition Comparison | How does a genetic perturbation or drug treatment alter a differentiation process? Does an in vitro differentiation protocol recapitulate in vivo development? | Revelation that in vitro differentiated T cells lack TNF signaling genes present in in vivo matured cells, guiding protocol optimization [15]. |
| Gene Expression Dynamics | How are specific genes or pathways regulated over the course of differentiation? Can we identify key regulators of cell state transitions? | Discovery of gene clusters with distinct temporal patterns, such as immune response genes being activated while developmental programs are repressed [13]. |
Deciphering Lineage Branching and Fate Selection
A primary strength of TI is its ability to model branching events where a progenitor cell commits to one of several possible fates. Methods like Slingshot and Monocle 3 are explicitly designed to identify these bifurcations and assign cells to specific lineages with associated probabilities [12] [2]. The condiments workflow further provides a statistical framework for testing "differential fate selection" - whether cells under different conditions (e.g., wild-type vs. knock-out) show a preferential bias toward one lineage over another at a branch point [16]. For example, in a study of human fetal immune cells, this approach helped identify a cluster of genes associated with NK cell-mediated cytotoxicity in one lineage branch, and genes driving T cell activation and differentiation in another [13].
Comparing Trajectories Across Conditions
A critical application in modern stem cell research involves comparing differentiation processes under different conditions, such as healthy versus diseased, or wild-type versus genetically modified [16]. The condiments workflow allows researchers to systematically assess whether the fundamental trajectory structure is different between conditions (differential topology), if cells progress through the same trajectory at different rates (differential progression), or if they make different fate choices at branch points (differential fate selection) [16].
Furthermore, tools like Genes2Genes (G2G) enable a granular, gene-level alignment of trajectories from a reference system (e.g., in vivo development) and a query system (e.g., in vitro differentiation) [15]. This can pinpoint exact stages where the query system diverges, revealing missing molecular components. In a proof-of-concept application, G2G revealed that in vitro differentiated T cells matched an immature in vivo state but failed to express genes associated with TNF signaling, providing a specific target for improving the culture protocol [15].
Experimental Protocols and Workflows
A Standard Protocol for Multi-Condition Trajectory Analysis
This protocol outlines the steps for using the condiments R package to compare stem cell differentiation across two or more conditions (e.g., control vs. treatment) [16].
Table 2: Research Reagent Solutions for Trajectory Inference
| Reagent/Material | Function in Experiment | Example/Notes |
|---|---|---|
| Single-Cell RNA-seq Library | Provides the foundational gene expression matrix for all downstream analysis. | Prepared from stem cells under control and experimental conditions using platforms like 10x Genomics. |
| Cluster Annotations | Defines preliminary cell states or types used as nodes for trajectory construction in methods like Slingshot. | Generated using tools like Seurat or Scanpy; markers for pluripotency (e.g., OCT4, NANOG) and differentiation are key. |
| Pseudotime Inference Tool | The core computational engine that orders cells along a trajectory. | Options include Slingshot (R), Monocle (R), or PAGA (Python). Choice depends on trajectory complexity and user preference [12]. |
| Condition Labels | Metadata assigning each cell to a biological group (e.g., "WT", "KO"). | Essential for the condiments workflow to test for differential progression and fate selection [16]. |
Step 1: Data Preprocessing and Integration
- Isolate single-cell transcriptomes from stem cells under each condition.
- Perform standard quality control, normalization, and batch correction.
- Integrate the data from all conditions into a single, harmonized dataset.
Step 2: Trajectory Inference on Integrated Data
- Reduce the dimensionality of the data using PCA, UMAP, or diffusion maps.
- Option A (Slingshot): Perform clustering on the data. Then, run Slingshot, specifying the clusters and a known starting cluster (e.g., a pluripotent stem cell population). Slingshot will build a minimum spanning tree on the clusters and fit principal curves for each lineage [12] [2].
- Option B (Monocle 3): Use Monocle 3 to learn the trajectory graph directly from the cells. The software will perform clustering and graph learning simultaneously [12].
Step 3: Topology Test with Condiments
- Input the integrated data, condition labels, and the inferred trajectory into the
topologyTestfunction. - This test assesses the null hypothesis that a single, common trajectory structure adequately describes the data from all conditions. A significant p-value suggests that the conditions have fundamentally different trajectories (differential topology), warranting separate analyses for each [16].
Step 4: Assess Differential Progression and Fate Selection
- If the topology test is non-significant, proceed with testing global differences.
- Use condiments'
progressionTestto check if cells from one condition are distributed differently along the shared paths (differential progression). - Use the
fateSelectionTestto determine if cells from different conditions show biased allocation to specific lineages at branch points (differential fate selection) [16].
Step 5: Differential Expression Analysis
- Finally, identify genes that exhibit different expression patterns between conditions along the pseudotime axes. This can reveal the molecular drivers behind any observed phenotypic differences in progression or fate selection [16].
Diagram 1: Multi-Condition Trajectory Analysis Workflow. This flowchart outlines the key decision points and analytical steps when comparing differentiation trajectories across different biological conditions.
Protocol for Gene Clustering Along Trajectories with scSTEM
Once a trajectory is established, identifying groups of genes with similar dynamic patterns can reveal co-regulated programs. The scSTEM (single-cell STEM) software is designed specifically for this task [13].
Step 1: Trajectory Inference and Path Selection
- Generate a trajectory from your stem cell scRNA-seq data using a supported method (e.g., Monocle 3, Slingshot, PAGA).
- Within the scSTEM graphical interface, select a specific path of the trajectory for analysis (e.g., the path leading from a stem cell to a specific differentiated lineage).
Step 2: Gene Expression Summarization
- For the selected path, summarize the expression of each gene along pseudotime. scSTEM offers multiple metrics for this, including:
- Mean Expression: Calculates the average expression of the gene in cells at successive segments of the path.
- Entropy Reduction: Measures the reduction in transcriptomic noise, which can indicate commitment to a cell fate.
Step 3: STEM Clustering Analysis
- The summarized time series for all genes are used as input for the STEM clustering engine.
- scSTEM assigns genes to pre-computed, significant expression profiles (e.g., "early-upregulated," "late-downregulated").
- The software outputs clusters of genes, their associated temporal profiles, and enriched Gene Ontology (GO) terms, linking dynamic patterns to biological function.
Step 4: Cross-Path Comparison
- To understand the differences between two lineages, run scSTEM separately on two paths that diverge from a common branch point.
- Compare the resulting gene clusters to identify which biological processes and gene sets are unique to or enriched in one lineage versus the other [13].
Visualization and Data Interpretation
Effective visualization is critical for interpreting the complex results of trajectory inference. The following diagram illustrates the core concepts and outputs of a standard TI analysis.
Diagram 2: Core Concepts of Trajectory Inference. Cells (points) are ordered along a trajectory based on transcriptome similarity. The path begins at a defined start (e.g., a pluripotent stem cell) and can branch into multiple lineages, each representing a distinct cell fate. Pseudotime is the distance a cell has traveled from the start.
The Scientist's Toolkit: Essential Computational Methods
A wide array of computational tools is available for trajectory inference, each with its own strengths and ideal use cases. The selection of a method should be guided by the biological question and the expected trajectory topology.
Table 3: Key Computational Tools for Trajectory Inference
| Tool Name | Primary Language | Key Features & Strengths | Ideal Use Case in Stem Cell Biology |
|---|---|---|---|
| Slingshot [12] [2] | R | Robust to noise; modular (works with any clustering); identifies multiple lineages. | Analyzing a well-clustered dataset with a clear tree-like structure (e.g., hematopoiesis). |
| Monocle 3 [12] | R | Comprehensive toolkit (clustering, DE, TI); handles large datasets; complex topologies. | Exploring complex trajectories with multiple origins, cycles, or converging fates in development. |
| PAGA [12] | Python | Combines discrete clustering with continuous transitions; robust to sparse sampling. | Resolving complex lineages and testing initial hypotheses about connectivity between cell states. |
| Condiments [16] | R | Specialized for multi-condition comparisons; tests for differential topology, progression, and fate. | Comparing stem cell differentiation between wild-type and mutant genotypes, or healthy and diseased models. |
| Genes2Genes (G2G) [15] | Framework | Gene-level trajectory alignment; identifies matches, warps, and mismatches between trajectories. | Benchmarking an in vitro stem cell differentiation protocol against an in vivo reference atlas. |
| scSTEM [13] | R | Clusters genes based on pseudotime expression patterns; identifies significant dynamic profiles. | Discovering co-regulated gene programs and key regulators driving a specific lineage decision. |
The Critical Role of Pseudotime in Modeling Self-Renewal and Multilineage Differentiation
Pseudotime analysis is a powerful computational approach that uses single-cell RNA-sequencing (scRNA-seq) data to reconstruct continuous biological processes, such as stem cell differentiation and development, by ordering cells along an inferred trajectory based on progressively changing transcriptomes [5] [2]. This methodology has become indispensable for studying dynamic cellular programs where the temporal sequence of events cannot be directly observed. In the context of stem cell biology, pseudotime analysis enables researchers to model the transition from self-renewing multipotent states to progressively more differentiated progeny, thereby decoding the hierarchical organization of stem cell populations [17] [18]. The term "pseudotime" describes the relative positioning of cells along a trajectory, where cells with larger values are considered "after" those with smaller values, though it may not directly correlate with real chronological time [2]. For stem cell systems, this approach has revealed deterministic hierarchies where self-renewing multipotent mesenchymal stem cells give rise to restricted progenitors that gradually lose differentiation potential until reaching complete lineage restriction [17].
Key Computational Methods for Trajectory Inference
Multiple computational frameworks have been developed for trajectory inference from scRNA-seq data, each with distinct approaches to reconstructing cellular dynamics. These methods can be broadly categorized into several types: cluster-based minimum spanning tree algorithms, principal curve methods, and comprehensive multi-sample frameworks. The performance of these methods depends significantly on the underlying structure of the data, with discrete cell distributions (distinct cell types) and continuous distributions (differentiation gradients) presenting different challenges for structure preservation in low-dimensional embeddings [19]. The table below summarizes major pseudotime analysis tools and their key features:
Table 1: Comparison of Pseudotime Analysis Algorithms
| Method | Underlying Approach | Key Features | Multi-Sample Support | Reference |
|---|---|---|---|---|
| TSCAN | Cluster-based Minimum Spanning Tree (MST) | Uses clustering to summarize data, computes centroids, forms MST between centroids | Limited | [5] [2] |
| Slingshot | Principal Curves | Non-linear generalization of PCA, fits flexible curves through cell clouds | Limited | [2] |
| Monocle | Reversed Graph Embedding | Learths trajectories using machine learning | Limited | [8] |
| Lamian | Comprehensive Multi-sample Framework | Accounts for sample variability, tests topology, cell density, and gene expression changes | Comprehensive | [5] |
| Phenopath | Linear Trajectory Modeling | Assumes gene expression changes linearly along pseudotime | Limited | [5] |
The Lamian Framework for Multi-Sample Analysis
The Lamian framework represents a significant advancement in pseudotime analysis by specifically addressing the challenge of analyzing multiple biological samples across different experimental conditions [5]. Unlike earlier methods that treat cells from multiple samples as if they were from a single sample, Lamian incorporates sample-level variability, batch effect correction, and enables statistical inference about condition-associated changes. This framework consists of four integrated modules: (1) pseudotemporal trajectory construction with branch uncertainty quantification, (2) assessment of topological changes associated with sample covariates, (3) identification of differentially expressed genes along pseudotime using functional mixed effects models, and (4) evaluation of cell density changes along pseudotime [5]. By properly accounting for cross-sample variability, Lamian reduces false discoveries that are not generalizable to new samples and provides three types of differential tests: changes in trajectory topology (TDE), changes in gene expression associated with covariates (XDE), and changes in cell density along pseudotime [5].
Trajectory Construction Methodologies
The technical foundation of pseudotime analysis begins with trajectory construction. The TSCAN algorithm employs a cluster-based minimum spanning tree (MST) approach, which involves clustering cells to summarize data into discrete units, computing cluster centroids by averaging coordinates of member cells, and forming the most parsimonious MST across centroids [2]. This method offers computational efficiency and robustness to per-cell noise but depends heavily on clustering granularity. Alternatively, Slingshot implements a principal curves approach, which is essentially a non-linear generalization of principal component analysis (PCA) where axes of variation are allowed to bend, fitting a flexible curve that passes through the cloud of cells in high-dimensional space [2]. The continuous nature of principal curves makes them particularly suitable for modeling smooth differentiation processes without imposing discrete cluster boundaries.
Experimental Design and Data Processing Protocols
Sample Preparation and Data Generation
For studying stem cell differentiation trajectories, experimental design must incorporate appropriate biological replicates and controls. The demonstrated workflow for mouse mammary gland epithelium includes samples across five developmental stages: embryonic (E18.5), early postnatal (P5), pre-puberty (2.5 weeks), puberty (5 weeks), and adult (10 weeks) [8]. Similar experimental designs can be applied to mesenchymal stem cell systems, with critical attention to cell source (e.g., human umbilical cord perivascular cells, bone marrow, adipose tissue) and differentiation conditions [17]. Single-cell suspensions are prepared using standard protocols with viability preservation, followed by library preparation using droplet-based methods such as 10x Genomics Chromium, which enables parallel profiling of transcriptomes for tens of thousands of cells per sample [8].
Quality Control and Data Preprocessing
Raw sequencing data must undergo rigorous quality control before pseudotime analysis. The standard preprocessing workflow includes:
- Quality Control: Filtering cells with low unique gene counts, high mitochondrial gene percentage, and potential doublets using tools like Scrublet or DoubletFinder [8]
- Normalization: Accounting for sequencing depth variation using methods such as library size normalization with scran or SCTransform [8]
- Feature Selection: Identifying highly variable genes (500-5000 genes) that drive biological heterogeneity [19]
- Data Integration: Harmonizing multiple samples using methods like Seurat's CCA, Harmony, or scVI to remove batch effects while preserving biological variation [5] [8]
Table 2: Critical Steps in scRNA-seq Data Preprocessing for Pseudotime Analysis
| Processing Step | Key Methods | Parameters to Consider | Impact on Trajectory Inference |
|---|---|---|---|
| Cell Quality Control | Mitochondrial percentage threshold, unique gene counts, doublet prediction | Species-specific mitochondrial genes, expected cell size | Removes technical artifacts that could distort trajectories |
| Normalization | Library size normalization, SCTransform | Method for size factor calculation, gene selection | Ensures comparability of expression values across cells |
| Feature Selection | Highly variable genes selection | Number of variable genes, dispersion threshold | Focuses analysis on biologically relevant genes |
| Data Integration | Harmony, Seurat CCA, scVI | Number of integration features, dimensionality | Removes batch effects while preserving biological variation |
| Dimensionality Reduction | PCA, diffusion maps | Number of components, feature weighting | Captures major axes of variation for trajectory construction |
Trajectory Inference Workflow
The following diagram illustrates the complete workflow for pseudotime analysis from raw data to biological interpretation:
Application to Stem Cell Hierarchies and Differentiation
Mapping Stem Cell Lineage Commitment
Pseudotime analysis has been instrumental in elucidating the hierarchical organization of stem cell populations. In human mesenchymal stem cells (MSCs) from umbilical cord perivascular tissue, single-cell-derived clonal analysis has demonstrated a deterministic hierarchy where self-renewing multipotent MSCs give rise to more restricted self-renewing progenitors that gradually lose differentiation potential [17]. Similarly, in murine prostate stem cells, pseudotime approaches have revealed how integrin α6 expression modulates survival, proliferation, and differentiation signaling through interactions with laminin in the extracellular matrix [18]. When plated in laminin-containing Matrigel medium, rare prostate stem cells (1 in 500-1000) form clonogenic spheroid structures capable of self-renewal and spontaneous lineage specification for basal and transit-amplifying cell types [18].
Characterizing Multilineage Differentiation Potential
The multipotency of stem cells can be deconstructed using pseudotime analysis to reveal lineage branching points and commitment events. For example, in the haematopoietic stem cell (HSC) system, trajectory analysis has mapped the progression from multipotent stem cells to various blood lineages, identifying key transcriptional regulators at branch points [2]. The branching structure of trajectories directly reflects lineage commitment events, with cells positioned before a branch point representing multipotent progenitors and cells after branch points representing lineage-restricted cells. The differentiation potency of stem cells can be quantified by analyzing the number of terminal states reachable from a given position in the trajectory, with earlier cells having higher potency scores.
Identifying Regulatory Drivers of Cell Fate
Pseudotime analysis enables the identification of genes whose expression changes dynamically along differentiation trajectories. Two primary types of differential expression tests are employed: (1) Temporal Differential Expression (TDE) tests whether a gene's activity as a function of pseudotime is constant, identifying genes whose activities change along pseudotime; and (2) Covariate Differential Expression (XDE) tests whether the pseudotemporal activity pattern is associated with sample-level covariates, such as differences between healthy and disease samples [5]. These analyses can reveal transcription factors, signaling receptors, and structural genes that drive lineage specification events, providing potential targets for manipulating stem cell differentiation in regenerative medicine applications.
Technical Protocols and Implementation
Step-by-Step Protocol for Basic Pseudotime Analysis
Protocol 1: Standard Pseudotime Analysis Using Monocle3 and Seurat
- Data Input and Quality Control
- Load count matrices from cellranger output or other scRNA-seq processing pipelines
- Create a Seurat object and perform standard QC metrics [8]
- Filter cells with unique feature counts >2500 or <200, and >5% mitochondrial counts
Normalization and Integration
- Normalize data using the SCTransform method [8]
- Identify integration anchors if multiple samples are present using FindIntegrationAnchors()
- Integrate data using IntegrateData() to remove batch effects
Dimensionality Reduction and Clustering
- Run PCA on the integrated data
- Cluster cells using FindClusters() with resolution parameter optimized for biological question
- Generate UMAP or t-SNE embeddings for visualization
Trajectory Inference with Monocle3
- Convert Seurat object to CellDataSet format for Monocle3
- Preprocess data using preprocesscds() with numdim = 50
- Reduce dimensionality using reduce_dimension(method = "UMAP")
- Cluster cells using cluster_cells() [8]
- Learn trajectory graph using learn_graph()
- Order cells in pseudotime using order_cells() with specified root node
Differential Expression Testing
- Test genes for differential expression along pseudotime using graph_test()
- Identify genes that branch in expression using branched expression analysis modeling (BEAM)
Advanced Protocol for Multi-Sample Analysis with Lamian
Protocol 2: Multi-Sample Differential Pseudotime Analysis
- Input Preparation
- Prepare low-dimensional representation of harmonized cells (PCs or other embeddings)
- Collect normalized scRNA-seq gene expression matrices
- Compile sample-level metadata with covariate information and batch indicators [5]
Trajectory Construction and Uncertainty Assessment
- Jointly cluster cells from all samples
- Construct pseudotemporal trajectory using cluster-based minimum spanning tree (cMST)
- Specify start of pseudotime using marker genes or tree node
- Evaluate branch uncertainty using bootstrap resampling to calculate detection rates [5]
Differential Topology Analysis
- Calculate branch cell proportion for each sample
- Characterize cross-sample variation by estimating variance of branch cell proportion
- Fit regression models to test association between branch cell proportion and sample covariates
- Use binomial logistic regression for individual branches or multinomial regression for all branches jointly [5]
Differential Expression Analysis
- For each pseudotemporal path, identify differentially expressed genes using functional mixed effects model
- Conduct TDE tests to identify genes with changing activity along pseudotime
- Conduct XDE tests to identify genes whose pseudotemporal activity differs by experimental conditions [5]
Cell Density Analysis
- Model cell density along pseudotime as a function of sample covariates
- Test for significant differences in cell distribution along trajectories between conditions
The Scientist's Toolkit: Essential Research Reagents and Computational Tools
Table 3: Essential Research Reagents and Computational Tools for Pseudotime Analysis
| Category | Item/Software | Specification/Function | Application Context |
|---|---|---|---|
| Wet-Lab Reagents | Matrigel with Laminin | Extracellular matrix preparation | 3D culture of prostate stem cells for sphere formation [18] |
| Dihydrotestosterone (DHT) | Androgen receptor agonist | Induction of luminal differentiation in prostate organoids [18] | |
| Integrin α6 antibodies | Cell surface marker identification | FACS isolation of murine prostate stem cells [18] | |
| Computational Tools | Seurat v4+ | Single-cell analysis toolkit | Data integration, clustering, and visualization [8] |
| Monocle3 | Trajectory inference | Pseudotime ordering and differential expression testing [8] | |
| Lamian | Multi-sample pseudotime analysis | Differential trajectory analysis across conditions [5] | |
| TSCAN | Cluster-based MST trajectory | Fast trajectory inference for large datasets [2] | |
| Slingshot | Principal curves trajectory | Flexible curve-fitting for continuous processes [2] | |
| edgeR | Differential expression analysis | Pseudotime course analysis with pseudo-bulk methods [8] |
Data Interpretation and Analytical Framework
Evaluating Trajectory Quality and Robustness
The reliability of pseudotime trajectories must be rigorously assessed before biological interpretation. Key quality metrics include:
- Branch Uncertainty: Quantified using bootstrap resampling to calculate detection rates - the probability that a tree branch is detected in repeated bootstrap samplings of cells [5]
- Global Structure Preservation: Measured using Pearson correlation of cell-cell distances in native high-dimensional space versus latent pseudotime space [19]
- Local Neighborhood Preservation: Assessed by calculating the percentage of k-nearest neighbor relationships maintained after dimension reduction [19]
- Topological Accuracy: Evaluated using the Wasserstein metric or Earth-Mover's Distance (EMD) to quantify structural alteration of cell distance distributions [19]
The following diagram illustrates the comprehensive multi-sample analysis framework for evaluating differential trajectories:
Statistical Framework for Differential Analysis
The Lamian framework provides a rigorous statistical approach for identifying significant differences in pseudotemporal trajectories across experimental conditions. This includes:
- Topology Changes: Testing whether branch cell proportions differ significantly between conditions using regression models that account for sample-level variability [5]
- Gene Expression Changes: Employing functional mixed effects models to test whether pseudotemporal expression patterns differ between conditions, with separate assessment of mean expression shifts and pattern changes [5]
- Cell Density Changes: Evaluating whether the distribution of cells along pseudotime differs between conditions, indicating shifts in the kinetics or proportion of cellular states [5]
For each type of analysis, Lamian properly accounts for cross-sample variability, reducing false discoveries that are not generalizable to new samples. This represents a significant advancement over earlier methods that treated cells from multiple samples as if they were from a single sample, potentially identifying sample-specific patterns that do not reflect general biological principles [5].
Integration with Functional Validation
Pseudotime analysis generates hypotheses about stem cell hierarchy and regulation that require experimental validation. Key validation approaches include:
- Lineage Tracing: Using genetic barcoding or fluorescent reporter systems to track the fate of predicted progenitor populations in vitro or in vivo
- Functional Assays: Testing differentiation potential of cells from different trajectory positions using clonal cultures and directed differentiation protocols
- Perturbation Studies: Manipulating identified regulatory genes using CRISPR/Cas9 or RNA interference to confirm their role in fate decisions
- Spatial Validation: Using spatial transcriptomics or immunohistochemistry to verify predicted spatial relationships of cellular states within tissues
The integration of computational pseudotime analysis with experimental validation creates a powerful cycle for unraveling the complexity of stem cell systems and their therapeutic applications.
The journey from a raw single-cell RNA sequencing (scRNA-seq) data matrix to a insightful low-dimensional embedding is a critical, multi-stage process in computational biology. For researchers investigating stem cell differentiation trajectories, the integrity of this preliminary workflow directly determines the biological validity of downstream analyses, including pseudotime ordering and trajectory inference. An improperly processed dataset can introduce artifacts that misrepresent the underlying developmental continuum, leading to erroneous conclusions about cell fate decisions. This protocol details the essential prerequisites for transforming initial count data into robust embeddings, providing a rigorous foundation for subsequent pseudotime analysis within stem cell research. We frame these steps within the context of preparing data for advanced trajectory inference tools like Sceptic, a support vector machine-based model for supervised pseudotime analysis, and CytoTRACE 2, a deep learning framework for predicting developmental potential [10] [20].
Critical Data Preprocessing and Quality Control
Quality Control and Filtering
The first step involves rigorous quality control (QC) to remove low-quality cells and uninformative genes, which can obscure true biological signal.
- Cell-level Filtering: Filter cells based on thresholds for total counts (library size), the number of detected genes, and the percentage of mitochondrial reads. These metrics help identify low-viability cells, empty droplets, or multiplets.
- Gene-level Filtering: Remove genes that are detected in only a small number of cells, as these provide little information for reconstructing connected trajectories.
Table 1: Standard Quality Control Thresholds for Stem Cell scRNA-seq Data
| Filtering Level | Metric | Typical Threshold | Rationale |
|---|---|---|---|
| Cell-level | Total UMI Counts | 500 - 2,000 | Removes empty droplets/very low RNA content |
| Number of Genes Detected | 300 - 1,000 | Filters damaged cells and multiplets | |
| Mitochondrial Read Percentage | < 10% - 20% | Identifies apoptotic or stressed cells | |
| Gene-level | Number of Cells Expressing | > 10 - 20 cells | Removes uninformative, sporadically detected genes |
Normalization and the Transcriptome Size Challenge
Normalization corrects for technical variation, most notably sequencing depth, to make expression levels comparable across cells. A critical yet often overlooked biological factor is the variation in transcriptome size—the total number of mRNA molecules—across different cell types [21].
Standard methods like Counts Per 10,000 (CP10K) or Counts Per Million (CPM) assume a constant transcriptome size across all cells. While this effectively removes technology-derived effects, it also erases real biological differences. In stem cell differentiation, where cells transition from a state of high transcriptional activity (e.g., pluripotent stem cells) to a more quiescent state, this scaling effect can distort the apparent expression of genes and misrepresent cellular trajectories [21].
The ReDeconv toolkit introduces an alternative normalization approach called Count based on Linearized Transcriptome Size (CLTS). This method preserves the biological variation in transcriptome size across cell types, leading to a more accurate representation of gene expression dynamics during differentiation. Using CLTS-normalized data as a reference has been shown to improve the accuracy of bulk RNA-seq deconvolution, particularly for rare cell types in complex mixtures like differentiating stem cell populations [21].
The following workflow diagram outlines the core steps from raw data to a normalized matrix ready for feature selection.
Figure 1: Preprocessing workflow from raw data to normalized matrix.
Feature Selection and Dimensionality Reduction
Selecting Biologically Informative Features
Following normalization, the dataset contains expression values for thousands of genes. However, not all genes are informative for discerning developmental trajectories. Feature selection reduces noise and computational load by identifying a subset of genes with high biological variability.
- Highly Variable Genes (HVGs): Identify genes that exhibit more variability than expected by technical noise alone. These genes are often drivers of cell state transitions. Methods for HVG selection are built into standard toolkits like Seurat and Scanpy.
- Potency Marker Genes: For stem cell applications, incorporating genes known to be associated with developmental potential can strengthen the embedding. Tools like CytoTRACE 2 use interpretable deep learning to identify gene sets that are highly discriminative for potency categories, from totipotent to differentiated states [20]. These gene signatures can be used to inform feature selection.
Creating the Low-Dimensional Embedding
The final prerequisite step is projecting the high-dimensional, feature-selected data into a low-dimensional space (2D or 3D) where distances between cells reflect transcriptional similarity.
- Principal Component Analysis (PCA): A linear method that reduces dimensionality by finding the axes of greatest variance in the data. PCA is a common and robust first step, and the top principal components (PCs) often form the input for nonlinear methods and graph-based trajectory inference [10] [12].
- Nonlinear Methods (UMAP, t-SNE): These methods are better at capturing complex, nonlinear manifolds on which cells reside during continuous processes like differentiation. They are frequently used for visualization. Monocle 3, for instance, uses UMAP to project data into a low-dimensional space before constructing a trajectory graph [12].
The choice of method and its parameters can significantly impact the apparent connectivity of cell states. The diagram below illustrates the logical process for moving from a normalized matrix to an embedding suitable for trajectory inference.
Figure 2: Feature selection and dimensionality reduction workflow.
Method Selection and Validation for Trajectory Inference
Aligning Method Choice with Biological Questions
With a high-quality low-dimensional embedding, researchers can proceed with trajectory inference. The choice of method should be guided by the expected biological topology of the stem cell system under study.
Table 2: Comparison of Trajectory Inference Methods for Stem Cell Applications
| Method | Underlying Algorithm | Strengths | Ideal for Differentiation Type |
|---|---|---|---|
| Slingshot [12] | Principal curves on cluster-based MST | Robust to noise, identifies branching lineages | Linear, bifurcating |
| Monocle 3 [12] | Reversed graph embedding (UMAP + Louvain) | Scalable, complex topologies (loops, multiple origins) | Large datasets, complex hierarchies |
| PAGA [12] | Graph abstraction from clustering | Handles disconnected data, maps discrete & continuous relationships | Noisy data, unclear connectivity |
| Sceptic [10] | Support Vector Machine (SVM) | High accuracy, uses time-series labels, multi-modal data | Supervised analysis with known time points |
| CytoTRACE 2 [20] | Interpretable deep learning (GSBN) | Predicts absolute developmental potential, cross-dataset comparable | Quantifying stemness and potency |
Validating the Embedding and Trajectory
Validation is a crucial, often underemphasized step. A trajectory inferred from a low-dimensional embedding is a hypothesis that requires confirmation.
- Biophysical Validation with Chronocell: The Chronocell framework moves beyond descriptive pseudotime to infer "process time" under a biophysical model of gene expression. This allows for direct comparison of inferred parameters, like degradation rates, with those from metabolic labeling experiments, providing a quantitative means to validate the trajectory model [22].
- Gene-level Alignment with Genes2Genes: The Genes2Genes (G2G) framework allows for the precise alignment of a inferred trajectory (query) to a well-validated reference trajectory. This can identify matched and mismatched dynamic gene expression patterns, highlighting where the in vitro differentiation process diverges from the in vivo benchmark [15].
- Differential Expression Testing: Identify genes that change significantly along the inferred pseudotime. The expression patterns of known marker genes should align with established biology, providing a sanity check for the ordering.
The Scientist's Toolkit: Research Reagent Solutions
Table 3: Essential Computational and Biological Materials for scRNA-seq Trajectory Analysis
| Item | Function/Description | Example Tools / Assays |
|---|---|---|
| Single-Cell Analysis Toolkits | Integrated environments for QC, normalization, clustering, and trajectory inference. | Seurat, Scanpy, Monocle 3 [12] |
| Trajectory Inference Software | Specialized algorithms for ordering cells along a developmental path. | Slingshot, PAGA, Sceptic [10] [12] |
| Normalization Algorithms | Correct for technical variation while preserving biological signal. | CP10K, SCTransform, ReDeconv (CLTS) [21] |
| Developmental Potential Predictors | Computationally assess cell potency from scRNA-seq data. | CytoTRACE 2 [20] |
| Trajectory Alignment Tools | Compare and align dynamic processes between two systems. | Genes2Genes (G2G) [15] |
| In Vivo Reference Atlas | A gold-standard scRNA-seq dataset of normal development for alignment validation. | e.g., Tabula Sapiens [20] |
| CRISPR Screening Data | Functional validation of genes predicted to regulate potency and differentiation. | In vivo knockout screens [20] |
A Practical Toolkit: Methodologies and Applications in Stem Cell Research
The advent of single-cell RNA-sequencing (scRNA-seq) technologies has revolutionized developmental biology by enabling researchers to profile gene expression at unprecedented resolution. For stem cell researchers, this technology provides a powerful lens through which to observe the dynamic process of cellular differentiation, where multipotent progenitor cells undergo fate decisions and transition through intermediate states to specialized cell types. Pseudotime analysis refers to the computational ordering of individual cells along a reconstructed developmental trajectory based on their progressively changing transcriptomes, rather than their actual laboratory capture times. This approach has become indispensable for studying dynamic biological processes including cell differentiation, immune responses, and disease development, offering transcriptome-wide insights into the molecular mechanisms driving cellular fate decisions [5] [23].
In the context of stem cell research, pseudotime analysis addresses a fundamental challenge: biological processes like differentiation occur asynchronously across cells, and destructive single-cell assays only provide a snapshot at one moment for each cell. Computational trajectory inference methods overcome this limitation by leveraging the continuum of cell states present in a population at a single time point or across multiple time points. The theoretical basis is that dense sampling of transitional states allows alignment of cells to reflect a time course of state transitions, essentially creating a "virtual lineage trace" [23]. For drug development professionals, these analyses can identify key regulatory genes and pathways that drive cell fate decisions, potentially revealing novel therapeutic targets for regenerative medicine or cancer treatment where stem cell differentiation processes are dysregulated.
The computational methods for pseudotime analysis can be broadly categorized into three paradigms: graph-based, machine learning, and probabilistic models. Each category operates on different mathematical principles, offers distinct advantages, and poses unique challenges. Understanding these foundational approaches is critical for researchers to select appropriate methodologies for their specific biological questions and experimental designs in stem cell differentiation research.
Graph-Based Models
Core Principles and Applications
Graph-based trajectory inference methods represent cellular relationships as network structures, where nodes typically correspond to individual cells or cell clusters, and edges represent potential developmental transitions. These methods typically begin by constructing a nearest-neighbor graph from the high-dimensional gene expression data, where cells with similar expression profiles are connected. The resulting graph captures the manifold structure of the data, preserving continuous transitions between cell states. Developmental trajectories are then extracted from this graph through various algorithms that identify paths corresponding to differentiation lineages [24] [25].
A key advantage of graph-based approaches is their ability to capture complex branching relationships that correspond to cell fate decisions, making them particularly suitable for modeling stem cell differentiation into multiple lineages. Methods in this category typically employ pseudotime calculation by computing geodesic distances—the shortest path along the developmental manifold—from a defined starting point (such as a stem cell population) to each cell in the graph. This approach effectively orders cells according to their progression along differentiation pathways [26] [24].
Representative Algorithms and Methodologies
Monocle Series: The Monocle algorithms represent seminal graph-based approaches for trajectory inference. The original Monocle implementation used independent component analysis (ICA) for dimensionality reduction followed by construction of a minimum spanning tree (MST) to model the developmental trajectory. Monocle2 improved upon this with the DDRTree algorithm, which learns a reduced graph structure that better accommodates branching processes. Monocle3 further advanced this paradigm by using principal graphs to construct trajectories, calculating geodesic distances from user-specified root nodes as pseudotime values [24] [27].
Slingshot: This method employs a two-step approach involving MST construction on cluster centroids followed by fitting simultaneous principal curves through the graph structure. The principal curves provide smooth branching trajectories that account for the continuous nature of cellular differentiation, and cells are projected onto these curves to determine their pseudotime values. Slingshot has demonstrated particular utility in modeling complex branching processes during stem cell differentiation [28] [25].
PAGA (Partition-based Graph Abstraction): PAGA utilizes a graph-based approach that initially constructs a k-nearest neighbor graph, then applies community detection to partition the graph into connected groups of cells. The method generates an abstracted graph representing relationships between cell groups or states, which provides a scaffold for interpreting complex trajectories, including cycles and multiple branching events [24].
DTFLOW: This algorithm introduces Bhattacharyya kernel feature decomposition (BKFD) for dimensionality reduction, which uses random walk with restart (RWR) to transform each cell into a discrete distribution and employs the Bhattacharyya kernel to calculate similarities between cells. It then applies reverse searching on k-nearest neighbor graphs (RSKG) to identify multi-branching differentiation processes [26].
Table 1: Key Graph-Based Algorithms for Pseudotime Analysis
| Algorithm | Graph Construction | Trajectory Modeling | Pseudotime Calculation | Strengths |
|---|---|---|---|---|
| Monocle3 | Dimension reduction + clustering | Principal graphs | Geodesic distance from root | Handles complex tree structures |
| Slingshot | Cluster-based MST | Simultaneous principal curves | Projection onto curves | Smooth branching trajectories |
| PAGA | KNN graph + community detection | Abstracted graph | Not primary focus | Preserves global topology |
| DTFLOW | KNN with Gaussian kernel | Reverse searching on KNN graph | Bhattacharyya distance | Identifies multi-branching processes |
Experimental Protocol: Implementing Graph-Based Trajectory Inference
Workflow Overview: A standardized protocol for applying graph-based trajectory inference methods to stem cell differentiation data involves sequential steps from data preprocessing to trajectory visualization. The following diagram illustrates this workflow:
Step-by-Step Protocol:
Data Preprocessing:
- Begin with a quality-controlled scRNA-seq count matrix from stem cell differentiation experiments.
- Filter out low-quality cells and genes using standard thresholds (e.g., mitochondrial percentage <20%, number of detected genes between 200-6000 per cell).
- Normalize data using methods like SCTransform or log-normalization (counts per million with log transformation) [28].
- Select highly variable genes (2000-3000 genes) that drive cell-to-cell variation.
Dimension Reduction:
- Apply principal component analysis (PCA) to the normalized and scaled expression matrix.
- Select significant principal components based on the elbow method in the scree plot.
- Further reduce dimensionality using non-linear methods like UMAP or t-SNE for visualization.
Graph Construction:
- Construct a k-nearest neighbor (KNN) graph in the reduced dimensional space (typically using the first 10-30 principal components).
- For cluster-based methods (e.g., Slingshot), perform clustering using algorithms like Louvain or Leiden clustering on the KNN graph.
- For cell-level methods (e.g., Monocle), proceed with direct graph construction on cells.
Trajectory Inference:
- Specify the stem cell population as the starting point of the trajectory.
- Apply the chosen graph-based algorithm (e.g., Slingshot, Monocle3) to infer the trajectory structure.
- For branching trajectories, identify bifurcation points where lineage commitment occurs.
Pseudotime Calculation:
- Calculate pseudotime as the geodesic distance from the root stem cell population to each cell along the inferred graph.
- For multi-lineage trajectories, assign cells to specific branches and calculate branch-specific pseudotimes.
Visualization and Validation:
- Visualize the trajectory overlaid on dimension reduction plots (UMAP/t-SNE).
- Validate trajectory structure using independent methods (e.g., known marker genes) or RNA velocity if available.
- Perform differential expression testing along pseudotime to identify dynamically regulated genes.
Troubleshooting Tips:
- If the trajectory appears disconnected, adjust the k-nearest neighbor parameter or clustering resolution.
- If branch points do not align with biological expectations, try different root cell specifications.
- Validate key branching decisions using established marker genes for different lineages.
Machine Learning Models
Core Principles and Applications
Machine learning approaches for pseudotime analysis leverage sophisticated algorithmic frameworks to learn complex patterns from single-cell data without explicit programming of trajectory rules. These methods typically employ deep learning architectures, graph neural networks, or ensemble methods to model the continuous nature of cellular differentiation. A key advantage of machine learning models is their ability to integrate multiple data modalities—such as simultaneously leveraging scRNA-seq and scATAC-seq data—to obtain a more comprehensive view of the regulatory landscape driving stem cell fate decisions [28] [29].
Unlike traditional graph-based methods that rely on fixed mathematical constructions, machine learning approaches can adaptively learn representations that optimize the reconstruction of developmental trajectories. These methods typically employ inductive learning frameworks that can generalize to new data, making them particularly valuable for integrating multiple datasets or projecting new cells onto existing trajectories. For stem cell researchers investigating complex differentiation processes, these approaches offer enhanced ability to capture non-linear relationships and identify subtle transitional states that might be missed by other methods [29] [30].
Representative Algorithms and Methodologies
BranchKGN: This heterogeneous graph transformer-based framework integrates scRNA-seq and scATAC-seq data into a unified gene representation for identifying branch-specific key genes along cell differentiation trajectories. BranchKGN infers differentiation trajectories using Slingshot and constructs a heterogeneous graph capturing gene-cell relationships. Through attention-based graph learning, the method assigns gene importance scores within each cell, enabling identification of genes consistently informative across branch point cells and their descendant lineages. Validation on independent datasets demonstrates that BranchKGN effectively captures key regulators of cell fate bifurcation [28].
scTEP (single-cell data Trajectory inference method using Ensemble Pseudotime): This framework utilizes multiple clustering results to infer robust pseudotime and then uses this pseudotime to fine-tune the learned trajectory. The method employs pathway gene set intersection to utilize pathway information, followed by scDHA clustering and dimension reduction. The ensemble approach enhances robustness to unavoidable errors from clustering and dimension reduction, strengthening the accuracy of trajectory inference [24].
Inductive Graph Neural Network Frameworks: These approaches integrate inductive learning into graph variational autoencoders to enhance gene imputation and cell clustering in sparse and noisy scRNA-seq datasets. By leveraging Louvain clustering, the framework effectively captures cell heterogeneity and achieves improved clustering and imputation accuracy, outperforming conventional graph-based methods. The initial stages employ robust data preprocessing and dimensionality reduction strategies, utilizing the high-dimensional gene expression matrix to learn low-dimensional embeddings that preserve developmental relationships [29].
TradeSeq: This statistical framework based on generalized additive models uses the negative binomial distribution to allow flexible inference of both within-lineage and between-lineage differential expression. By incorporating observation-level weights, the model can account for zero inflation. TradeSeq fits a smoothing spline for each gene along pseudotime, enabling the identification of dynamically expressed genes during stem cell differentiation [25].
Table 2: Machine Learning Approaches in Pseudotime Analysis
| Algorithm | ML Category | Data Integration | Key Innovation | Stem Cell Application |
|---|---|---|---|---|
| BranchKGN | Graph Neural Network | scRNA-seq + scATAC-seq | Heterogeneous graph transformer | Branch-specific key gene discovery |
| scTEP | Ensemble Learning | Pathway information | Ensemble pseudotime from multiple clusterings | Robust trajectory inference |
| Inductive GNN | Graph Neural Network | Gene-cell relationships | Inductive learning for imputation | Handling sparse single-cell data |
| TradeSeq | Generalized Additive Models | Multiple lineages | Smoothing splines along pseudotime | Differential expression analysis |
Experimental Protocol: Multi-Omics Integration with Machine Learning
Workflow Overview: Advanced trajectory analysis increasingly requires integration of multiple data modalities. The following protocol outlines the process for applying machine learning methods like BranchKGN to integrate transcriptomic and epigenomic data in stem cell differentiation studies:
Step-by-Step Protocol:
Multi-omics Data Input:
- Collect matched scRNA-seq and scATAC-seq data from the same stem cell differentiation experiment.
- For scRNA-seq: obtain the gene expression count matrix.
- For scATAC-seq: process raw data to generate a gene activity matrix using tools like MAESTRO to compute Regulatory Potential scores based on promoter and gene-body accessibility [28].
Data Preprocessing and Normalization:
- Normalize scRNA-seq data using SCTransform or similar approaches.
- Process scATAC-seq profiles with TF-IDF normalization and convert to gene activity scores.
- Perform quality control on both modalities, removing low-quality cells.
Multi-omics Integration:
- Use Seurat's canonical correlation analysis (CCA) or Harmony to align the two modalities into a shared low-dimensional space.
- Create a harmonized Gene Integration Matrix that jointly encodes expression and accessibility features for matched cells.
- This integrated matrix serves as the foundation for trajectory inference and graph-based modeling.
Heterogeneous Graph Construction:
- Construct a heterogeneous bipartite graph with two node types: genes and cells.
- Add undirected edges between gene nodes and cell nodes to represent expression relationships.
- Initialize node representations using linear neural networks that project raw features of cells and genes into embeddings.
Model Training:
- Process the gene-cell bipartite graph using a multi-layer Heterogeneous Graph Transformer.
- Employ multi-head self-attention mechanisms where query, key, and value vectors are generated for each target-source pair according to node and relation types.
- Implement message passing to propagate information between connected nodes.
- Use mutual attention to quantify the importance of gene-cell interactions.
Gene Importance Scoring:
- Compute Gene Attention Scores for each gene-cell pair, quantifying gene contributions to cell fate.
- Analyze branch cells identified from the trajectory by ranking genes according to their attention scores.
- Apply filtering with a score threshold and expression probability (e.g., expressed in at least 50% of branch cells).
Network Inference and Validation:
- Use identified branch-specific regulatory genes to reconstruct differentiation trajectories.
- Infer branch-specific gene regulatory networks.
- Validate identified genes using independent datasets or functional enrichment analysis.
Implementation Considerations:
- Computational requirements: These methods typically require GPU acceleration for training graph neural networks.
- Parameter tuning: Attention mechanisms require careful tuning of hyperparameters like the number of heads and embedding dimensions.
- Validation: Always validate findings using orthogonal methods such as RNA velocity or known marker genes.
Probabilistic Models
Core Principles and Applications
Probabilistic approaches to pseudotime analysis frame the challenge of trajectory inference as a statistical estimation problem, incorporating explicit models of uncertainty in both the measurement process and the underlying biological variation. These methods treat pseudotime as a latent (unobserved) variable that must be inferred from the observed gene expression data, while accounting for multiple sources of variation including measurement noise, stochastic cell-to-cell variation, and differential progression rates through biological processes [27]. For stem cell researchers, this statistical rigor is particularly valuable when working with heterogeneous cell populations or when aiming to make precise inferences about rare transitional states.
These models typically employ Bayesian frameworks or Gaussian processes to simultaneously estimate pseudotimes and model gene expression dynamics along developmental trajectories. A key strength of probabilistic approaches is their ability to quantify uncertainty in pseudotime estimates and trajectory topology, providing researchers with confidence measures for their conclusions. This is especially important in clinical and drug development applications where erroneous trajectory inferences could lead to incorrect biological interpretations [5] [27].
Representative Algorithms and Methodologies
DeLorean: This Bayesian method uses Gaussian processes to analyze cross-sectional time series single-cell data while deconfounding several sources of variation. The model estimates pseudotime by leveraging smoothness assumptions about gene expression dynamics along developmental trajectories. DeLorean incorporates a metamodel that connects the pseudotimes to the actual capture times of cells, allowing it to account for uncertainty in the temporal dimension. The method has demonstrated accurate recovery of temporal ordering in various biological systems including plant development and cancer cell cycles [27].
Lamian: This comprehensive statistical framework addresses differential multi-sample pseudotime analysis, specifically designed to handle multiple single-cell RNA-seq samples across different experimental conditions. Lamian employs a functional mixed effects model to identify changes in three key aspects: trajectory topology, cell density along pseudotime, and gene expression dynamics. Unlike methods that ignore sample variability, Lamian draws statistical inference after accounting for cross-sample variability, substantially reducing sample-specific false discoveries that are not generalizable to new samples [5].
Gaussian Process Latent Variable Models (GPLVMs): These approaches provide a non-linear extension to probabilistic PCA for dimensionality reduction of single-cell data. GPLVMs impose an a priori structure on the latent space where one dimension represents pseudotime. This structured latent space directly relates to temporal information about cell capture times, allowing the model to simultaneously reduce dimensionality and estimate pseudotemporal ordering. The Gaussian process framework provides a flexible non-parametric approach to modeling complex gene expression dynamics [27].
PCA-based Bayesian Methods: Some probabilistic approaches build upon principal components analysis by incorporating Bayesian inference to account for uncertainties in the trajectory reconstruction process. These methods model the progression of cells through a developmental process as a random walk along the principal curve of the data distribution, with pseudotime estimates represented as posterior distributions rather than point estimates [27].
Experimental Protocol: Multi-Sample Pseudotime Analysis with Lamian
Workflow Overview: Lamian provides a robust framework for analyzing multi-sample single-cell data, essential for comparing stem cell differentiation across experimental conditions, patient groups, or treatment regimens:
Step-by-Step Protocol:
Multi-sample Data Input and Harmonization:
- Collect scRNA-seq data from multiple biological samples (e.g., stem cells from different patients, conditions, or treatment groups).
- Input includes: (1) a low-dimensional representation of cells (PCs or other harmonized embeddings), (2) normalized scRNA-seq gene expression matrices, and (3) sample-level metadata with covariate information.
- Harmonize data from multiple samples into a common space using methods such as Seurat, Harmony, or scVI to remove batch effects while preserving biological variation [5].
Trajectory Construction and Topology Uncertainty:
- Jointly cluster cells from all samples using the harmonized data.
- Construct a pseudotemporal trajectory using the cluster-based minimum spanning tree approach described in TSCAN.
- Specify a tree node as the start of pseudotime (e.g., pluripotent stem cell population) or use marker genes highly expressed at the start.
- Evaluate uncertainty of each branch by quantifying the detection rate—the probability that a tree branch can be detected in repeated bootstrap samplings of cells.
Differential Topology Analysis:
- For each sample, calculate the proportion of cells in each tree branch (branch cell proportion).
- Characterize cross-sample variation of each branch by estimating variance of branch cell proportion across samples.
- Fit regression models (binomial or multinomial logistic regression) to test whether branch cell proportion is associated with sample covariates.
- Identify tree topology changes between experimental conditions (e.g., control vs. treatment) while accounting for sample-level variability.
Differential Expression Analysis:
- Given a path or branch along the pseudotemporal trajectory, implement two types of differential expression tests:
- TDE Test: Evaluate whether a gene's activity as a function of pseudotime is constant (testing for genes whose activities change along pseudotime).
- XDE Test: Evaluate whether the pseudotemporal activity pattern is associated with a sample-level covariate (e.g., different between healthy and disease samples).
- Account for cross-sample variability in the statistical tests to ensure generalizability.
- Given a path or branch along the pseudotemporal trajectory, implement two types of differential expression tests:
Cell Density Analysis:
- Model how cell density changes along pseudotime and whether these changes are associated with sample covariates.
- Compare cell distribution patterns between experimental conditions along developmental trajectories.
- Identify regions of pseudotime where cell distribution significantly differs between conditions, potentially indicating altered differentiation kinetics.
Statistical Inference and Interpretation:
- Perform hypothesis testing while properly accounting for multiple testing across genes and lineages.
- Interpret results in the context of stem cell biology, focusing on genes and pathways with statistically significant associations.
- Validate findings using independent experimental approaches or functional assays.
Application Notes:
- Lamian is particularly valuable for case-control studies of stem cell differentiation, such as comparing differentiation efficiency between patient-specific iPSCs or evaluating the effects of small molecule compounds on lineage specification.
- The method's ability to account for sample-to-sample variation makes it suitable for studies with limited replicates, a common scenario in stem cell research using primary samples.
- Results from Lamian can identify not only molecular drivers of differentiation but also how these drivers are perturbed in disease states or modulated by therapeutic interventions.
The Scientist's Toolkit
Research Reagent Solutions
Table 3: Essential Reagents and Computational Tools for Pseudotime Analysis
| Category | Item | Function/Application | Example Tools/Products |
|---|---|---|---|
| Wet-Lab Reagents | Single-cell RNA-seq kits | Generate transcriptome data from individual stem cells | 10X Genomics Chromium, Smart-seq2 reagents |
| Wet-Lab Reagents | scATAC-seq kits | Profile chromatin accessibility in single cells | 10X Genomics Chromium ATAC, ATAC-seq kits |
| Wet-Lab Reagents | Cell surface antibodies | Identify and isolate stem cell populations by FACS | CD34, CD133, SSEA-4 antibodies |
| Wet-Lab Reagents | Intracellular staining kits | Preserve cell states for signaling analysis | DISSECT protocol for epithelial tissues |
| Computational Tools | Trajectory inference software | Reconstruct differentiation paths from single-cell data | Monocle, Slingshot, PAGA |
| Computational Tools | Differential expression tools | Identify genes changing along differentiation | TradeSeq, Lamian, Monocle |
| Computational Tools | Data integration platforms | Harmonize multiple single-cell datasets | Seurat, Harmony, scVI |
| Computational Tools | Visualization packages | Visualize trajectories and gene expression dynamics | ggplot2, dynplot, plotly |
Selection Guidelines for Algorithm Categories
The choice between graph-based, machine learning, and probabilistic models should be guided by specific research goals and experimental designs:
Graph-Based Models are ideal for:
- Initial exploration of differentiation trajectories
- Datasets with clear branching structures
- Studies focusing on trajectory topology
- Situations requiring intuitive visualizations
Machine Learning Models excel when:
- Integrating multiple data modalities (transcriptome + epigenome)
- Working with very large datasets (100,000+ cells)
- Identifying subtle patterns in complex differentiation processes
- Predicting branch-specific key regulators
Probabilistic Models are most appropriate for:
- Studies requiring uncertainty quantification
- Multi-sample comparisons across conditions
- Datasets with significant technical or biological noise
- Formal hypothesis testing about differentiation processes
For comprehensive stem cell differentiation studies, a multi-method approach often yields the most robust insights, using graph-based methods for initial trajectory mapping, machine learning for regulatory network inference, and probabilistic models for rigorous statistical testing of hypotheses across experimental conditions.
Single-cell RNA sequencing (scRNA-seq) has revolutionized the study of cellular dynamics by enabling researchers to profile transcriptional states at individual cell resolution. In stem cell biology, this technology provides unprecedented opportunities to investigate differentiation trajectories, cellular fate decisions, and developmental processes. Trajectory inference (TI) has emerged as a critical computational approach for reconstructing these dynamic processes from static snapshots of scRNA-seq data. TI methods order cells along pseudotemporal trajectories that represent continuous biological processes such as differentiation, activation, or development. Within the context of stem cell research, pseudotime analysis enables the investigation of transcriptional reprogramming during differentiation, identification of key regulatory genes, and discovery of novel progenitor states. This application note provides a detailed examination of four prominent TI tools—Monocle 3, Slingshot, TSCAN, and PAGA—with specific protocols for their application in stem cell differentiation studies.
Tool-Specific Methodologies and Applications
Monocle 3
Monocle 3 employs a comprehensive analytical workflow for reconstructing complex cellular trajectories. The methodology begins with preprocessing and normalization of single-cell data, followed by dimensionality reduction using UMAP, which is strongly recommended over t-SNE for trajectory analysis [31]. The algorithm then partitions cells into distinct communities through clustering, which helps identify disjoint trajectories present in the data. The core trajectory inference step involves learning a principal graph that captures the continuous manifold of cell states [32]. Finally, cells are ordered in pseudotime by calculating their geodesic distance from user-specified root cells along the graph structure.
For stem cell applications, Monocle 3 provides specific functions to identify genes that change as a function of pseudotime, enabling researchers to discover transcriptional regulators driving differentiation. The tool can reconstruct trajectories with numerous branches, representing cellular decision points where stem cells commit to different lineage paths [31]. A key advantage for complex stem cell systems is Monocle 3's ability to handle multiple partitions, allowing separate trajectories for distinct cell lineages that may not share a common ancestral state.
Protocol: Monocle 3 Trajectory Analysis for Stem Cell Differentiation
- Data Preprocessing: Load single-cell expression data and perform quality control. Normalize counts using Monocle 3's built-in functions.
- Dimensionality Reduction: Run
preprocess_cds()with method="PCA" followed byreduce_dimension()with reduction_method="UMAP". - Cell Clustering: Execute
cluster_cells()to identify discrete cell populations and partitions. - Trajectory Learning: Apply
learn_graph()to infer the principal graph representing cell state transitions. - Pseudotime Calculation: Call
order_cells()specifying root cells corresponding to stem/progenitor populations. Root selection can be automated by identifying clusters enriched for known stem cell markers or from early time points in time-series experiments [31]. - Differential Expression: Use
graph_test()to identify genes associated with pseudotime or specific branches.
Slingshot
Slingshot utilizes a two-stage approach for lineage inference and pseudotime estimation that combines the stability of cluster-based methods with the flexibility of continuous curve fitting. The method first identifies the global lineage structure through a cluster-based minimum spanning tree (MST). Cells are grouped into clusters, and an MST is constructed on cluster centers to identify the number of lineages and their branching relationships [33]. In the second stage, Slingshot implements a novel simultaneous principal curves algorithm to fit smooth branching curves to these lineages, translating global lineage structure into stable estimates of pseudotime for each cell along each lineage [33].
For stem cell researchers, Slingshot provides particular advantages in its robust handling of multiple branching lineages and flexibility in incorporating domain knowledge. Users can optionally specify starting clusters or terminal states based on known stem cell or differentiated cell markers, allowing biological priors to inform trajectory structure. The method's stability to noise makes it particularly suitable for scRNA-seq data, which often contains technical artifacts and high variability.
Protocol: Slingshot Analysis for Multi-Lineage Stem Cell Differentiation
- Input Preparation: Provide normalized count matrix, cell cluster labels, and reduced dimensional representation (PCA, UMAP, or t-SNE).
- Global Lineage Inference: Execute
slingshot()with cluster labels and reduced dimension matrix. The function constructs MST on clusters to identify lineages. - Lineage Specification: Optionally specify start and end clusters using known stem cell (start) and differentiated cell (end) markers.
- Curve Fitting and Pseudotime Calculation: Slingshot automatically fits simultaneous principal curves and calculates pseudotime values for each cell along each lineage.
- Result Visualization: Plot lineages overlaid on dimensionality reduction using
plot()functions. - Downstream Analysis: Perform differential expression along lineages using companion packages like
tradeSeq[25].
TSCAN
TSCAN employs a clustering-based approach to pseudotemporal ordering that emphasizes computational efficiency and scalability. The method begins by clustering cells in a reduced-dimensional space, then constructs a minimum spanning tree (MST) on the cluster centers [24]. This cluster-based MST represents the overall trajectory structure, with paths through the tree corresponding to potential differentiation lineages. To determine pseudotime values for individual cells, TSCAN uses orthogonal projection to map cells onto the edges of the MST [33]. The resulting pseudotime represents a cell's progression along the developmental path.
For stem cell applications, TSCAN offers advantages in computational efficiency, particularly for large-scale datasets. The clustering step reduces complexity by operating on cluster centers rather than individual cells, making it suitable for analyzing thousands of stem cells across multiple conditions. A key consideration is that TSCAN produces piecewise linear paths, which may result in multiple cells being assigned identical pseudotime values at vertices.
Protocol: TSCAN Pseudotemporal Ordering of Stem Cell Transitions
- Dimensionality Reduction: Perform PCA on normalized single-cell expression data.
- Cell Clustering: Cluster cells in the reduced PCA space using model-based clustering.
- MST Construction: Build minimum spanning tree on cluster centers to infer lineage relationships.
- Pseudotime Calculation: Determine pseudotime by projecting cells onto MST edges and calculating distance from root.
- Direction Specification: Manually specify the starting cluster (stem cell population) or use known early-time point cells to establish trajectory direction.
- Path Evaluation: Examine alternative paths through the MST to identify potential branching events in stem cell differentiation.
PAGA introduces a graph-based approach that unifies discrete clustering and continuous trajectory perspectives. The method begins by constructing a k-nearest neighbor (kNN) graph of cells in a reduced-dimensional space. PAGA then computes a statistical model of connectivity between groups of cells (typically determined by clustering), generating a PAGA graph where edge weights represent confidence in connections between groups [34]. This abstracted graph preserves both continuous and disconnected structures in the data, enabling robust trajectory inference even with incomplete sampling. PAGA can subsequently initialize manifold learning algorithms to generate topology-preserving single-cell embeddings [34].
For stem cell research, PAGA offers unique capabilities in resolving complex lineage relationships and identifying rare intermediate states. The method consistently predicts developmental trajectories and gene expression dynamics, as demonstrated in hematopoietic stem cell datasets where it captured known features of hematopoiesis including the proximity of megakaryocyte and erythroid progenitors [34]. PAGA's multi-resolution analysis allows examination of stem cell hierarchies at different levels of granularity.
Protocol: PAGA for Mapping Complex Stem Cell Lineage Hierarchies
- Graph Construction: Build k-nearest neighbor graph from reduced dimensional representation.
- Community Detection: Perform clustering (Louvain or Leiden algorithm) to identify cell groups.
- PAGA Graph Generation: Execute
tl.paga()to compute connectivity statistics between clusters. - Trajectory Initialization: Use PAGA graph to initialize UMAP or ForceAtlas2 embeddings that preserve global topology.
- Pseudotime Calculation: Compute pseudotime distances by following high-confidence paths in the PAGA graph from progenitor to differentiated states.
- RNA Velocity Integration: Optionally incorporate RNA velocity to infer directionality of transitions.
Comparative Analysis of Tool Performance
Methodological Comparison
Table 1: Core Algorithmic Characteristics of Trajectory Inference Tools
| Tool | Core Algorithm | Trajectory Topology | Scalability | Key Innovation |
|---|---|---|---|---|
| Monocle 3 | Principal graphs + UMAP | Complex trees, multiple partitions | Moderate | Reconstructs disjoint trajectories |
| Slingshot | Cluster-based MST + simultaneous principal curves | Multiple branching lineages | High | Combines cluster stability with continuous curves |
| TSCAN | Cluster-based MST + orthogonal projection | Linear, bifurcating | High | Computational efficiency through clustering |
| PAGA | kNN graph + connectivity statistics | Any topology, including disconnected | High | Unifies discrete clustering with continuous trajectory inference |
Performance Benchmarking
Recent independent evaluations provide insights into the relative performance of these methods across diverse datasets. In benchmarking studies assessing performance on both simulated and real scRNA-seq datasets with complex branching relationships, PAGA demonstrated superior performance in recovering original tree structures and properly allocating cells to branches [35]. Monocle 3 and Slingshot also showed strong performance, particularly for real biological datasets with simpler tree structures [35].
For linear trajectories, the scTEP method, which incorporates ensemble pseudotime, demonstrated superior performance compared to multiple existing methods including TSCAN and Slingshot [24]. However, it should be noted that performance varies significantly based on trajectory complexity, with Slingshot performing better on simpler bifurcating structures while Monocle 3 and PAGA show advantages for more complex branching patterns [35].
Table 2: Performance Characteristics Across Trajectory Types
| Tool | Linear Trajectories | Bifurcating Trajectories | Multi-branching Trees | Disconnected Structures |
|---|---|---|---|---|
| Monocle 3 | High accuracy | High accuracy | High accuracy | Handles via partitions |
| Slingshot | High accuracy | High accuracy | Moderate accuracy | Not supported |
| TSCAN | High accuracy | Moderate accuracy | Lower accuracy | Not supported |
| PAGA | High accuracy | High accuracy | High accuracy | Explicitly supported |
Integrated Experimental Protocol for Stem Cell Differentiation Analysis
Multi-Tool Cross-Validation Strategy
For robust trajectory inference in stem cell differentiation studies, we recommend a multi-tool approach that leverages the complementary strengths of different algorithms:
Data Preprocessing: Begin with standardized preprocessing of scRNA-seq data including quality control, normalization, and batch correction. Select highly variable genes appropriate for trajectory analysis.
Dimensionality Reduction: Generate multiple low-dimensional representations (PCA, UMAP, diffusion maps) as different TI methods may perform better with specific embeddings.
Parallel Trajectory Inference: Apply Monocle 3, Slingshot, and PAGA in parallel to the same preprocessed dataset. TSCAN can be included for efficiency comparison.
Topology Consensus Assessment: Compare the inferred trajectory structures across tools to identify robust topological features. Discrepancies may indicate technical artifacts or biologically interesting subtleties.
Pseudotime Correlation Analysis: Calculate correlation between pseudotime values from different methods to assess consensus ordering.
Downstream Validation: Validate key findings using experimental approaches such as fluorescence-activated cell sorting (FACS) of predicted intermediate states or time-series validation of differentiation kinetics.
Research Reagent Solutions for Trajectory Validation
Table 3: Essential Research Reagents for Experimental Validation of Inferred Trajectories
| Reagent/Category | Function in Validation | Example Applications |
|---|---|---|
| Stem Cell Markers | Identify progenitor populations | CD34, SOX2, OCT4 for root specification |
| Differentiated Cell Markers | Confirm terminal states | CD14, CD19, insulin for endpoint validation |
| Lineage Tracing Systems | Directly track fate decisions | CRISPR-based barcoding, fluorescent reporters |
| Time-Series Sampling | Validate pseudotime ordering | Collect samples at multiple differentiation time points |
| Cell Sorting Reagents | Isolate predicted intermediate states | FACS antibodies for novel intermediate populations |
| Perturbation Tools | Test predicted gene functions | CRISPRi, siRNA for candidate regulator validation |
Advanced Applications in Stem Cell Research
Multi-Condition Analysis with Condiments
For studies comparing stem cell differentiation across multiple conditions (e.g., wild-type vs. mutant, control vs. treatment), the condiments framework provides specialized statistical methodology building upon these TI tools [16]. Condiments enables systematic assessment of differential topology (whether the trajectory structure differs between conditions), differential progression (whether cells progress at different rates), and differential fate selection (whether lineage biases exist between conditions) [16]. The workflow integrates with trajectory inference from Slingshot or Monocle 3 to provide condition-aware analysis of stem cell behaviors.
Differential Expression Analysis with tradeSeq
Following trajectory inference with Slingshot, tradeSeq enables powerful differential expression analysis along lineages using generalized additive models [25]. This approach identifies genes that are (1) associated with lineages in the trajectory, or (2) differentially expressed between lineages, providing crucial insights into molecular drivers of stem cell fate decisions [25]. Unlike discrete cluster-based DE methods, tradeSeq exploits the continuous resolution provided by pseudotemporal ordering, significantly enhancing biological interpretation.
Monocle 3, Slingshot, TSCAN, and PAGA represent complementary approaches to trajectory inference with distinct strengths for stem cell research applications. Monocle 3 excels in reconstructing complex trajectory topologies with multiple partitions. Slingshot provides exceptional stability for multiple branching lineages. TSCAN offers computational efficiency for large-scale datasets. PAGA uniquely preserves global topology and connects discrete clustering with continuous trajectory perspectives. For robust analysis of stem cell differentiation, we recommend a multi-tool consensus approach followed by experimental validation using the reagent frameworks described herein. As single-cell technologies continue evolving, these trajectory inference methods will play increasingly vital roles in unraveling the molecular programs governing stem cell fate decisions.
Pseudotime analysis represents a cornerstone of single-cell genomics, enabling researchers to computationally order individual cells along a continuum of dynamic biological processes, such as stem cell differentiation, embryonic development, or cellular response to stimulus [4] [5]. Unlike physical time points at which samples are collected, pseudotime provides a quantitative measure of cellular progression through these biological processes, revealing the transcriptional continuum that underlies apparent cellular heterogeneity [4]. Traditionally, pseudotime inference has relied on unsupervised methods such as Monocle, Slingshot, and TSCAN, which construct trajectories based solely on transcriptional similarity without incorporating experimental time labels [4] [33].
The emergence of supervised pseudotime methods marks a significant paradigm shift in the field. These approaches leverage known experimental time points as training labels to build models that more accurately reconstruct cellular trajectories. This supervised framework transforms pseudotime inference from an unsupervised learning problem into a supervised one, potentially offering enhanced accuracy and robustness, particularly for complex time-series datasets [4] [5]. The Sceptic method exemplifies this new generation of tools, employing a support vector machine (SVM) framework to establish a more powerful and flexible approach to pseudotime analysis across diverse data modalities [4].
The Sceptic Framework: Principles and Advantages
Sceptic (single cell pseudotime classifier) is a supervised machine learning model specifically designed for pseudotime analysis of time-series single-cell data. Its development was motivated by limitations observed in its predecessor, psupertime, which used a simpler ordinal logistic regression model [4]. Sceptic introduces three fundamental innovations that distinguish it from existing methods.
Core Methodological Innovations
First, Sceptic replaces the linear model used in psupertime with a nonlinear support vector machine, enabling it to capture more complex, nonlinear relationships between gene expression patterns and temporal progression [4]. Second, and most significantly, Sceptic employs a one-versus-the-rest classification strategy rather than a single regressor. The model trains a collection of classifiers—one for each experimental time point—and generates for each cell a probability vector over all time points [4]. The final pseudotime value for a cell is computed as a conditional expectation (a weighted sum) based on these probability scores, significantly enhancing classification performance [4].
Third, Sceptic implements a standard cross-validation strategy where multiple models are trained on different data subsets and used to predict corresponding test sets. This approach prevents overfitting and ensures that reported pseudotime values generalize beyond the training data [4]. The model accepts various single-cell data types as input, learns the relationship between the observed data and associated time stamps, and outputs a real-valued pseudotime for each cell that reflects its progression along an appropriate biological process [4].
Performance Advantages
Simulation studies demonstrate Sceptic's superior performance characteristics. In linear differentiation scenarios, Sceptic and ridge regression baseline methods accurately preserve cell ordering and predict true pseudotime values, whereas psupertime produces only a monotonic transformation of the true pseudotime [4]. In more complex bifurcating structures, Sceptic achieves the best prediction accuracy by preserving correct cell ordering and reflecting the actual scale of simulated pseudotimes, where other methods fail [4].
Empirical validation on a mouse embryonic stem cell (mESC) differentiation time-series dataset (spanning five time points: days 0, 3, 7, 11, and day 21 neural progenitor cells) demonstrated Sceptic's practical advantage [4]. Using five-fold cross-validation, Sceptic achieved a classification accuracy of 93.73% (3809 correct predictions out of 4064), significantly outperforming psupertime's accuracy of 89.94% (3655 correct predictions) with a p-value of 4.94e-10 [4].
Table 1: Performance Comparison of Pseudotime Methods
| Method | Underlying Algorithm | Key Features | Classification Accuracy (mESC data) |
|---|---|---|---|
| Sceptic | Support Vector Machine (SVM) | One-versus-rest classifiers, cross-validation, conditional expectation pseudotime | 93.73% |
| Psupertime | Penalized Ordinal Logistic Regression | Single regressor with multiple thresholds | 89.94% |
| Monocle 2 | Reversed Graph Embedding | Minimum spanning tree among cells | N/A |
| Slingshot | Cluster-based Minimum Spanning Tree (MST) | Simultaneous principal curves for multiple lineages | N/A |
| TSCAN | Cluster-based MST | Piecewise linear paths, orthogonal projection | N/A |
Application Notes for Stem Cell Research
Experimental Design and Data Preparation
For stem cell researchers applying Sceptic to differentiation trajectories, proper experimental design and data preprocessing are critical. The method requires time-series single-cell data with clearly defined experimental time points that serve as supervised labels during training [4]. For stem cell differentiation studies, appropriate time points should capture key transitions throughout the differentiation process, from pluripotent states through intermediate progenitor stages to fully differentiated cells [4].
Data preprocessing should follow standard single-cell analysis pipelines, including quality control, normalization, and potentially batch effect correction [4] [5]. While Sceptic is compatible with various normalization approaches, the selection should be appropriate for the specific technology used to generate the data (e.g., 3'-end vs. 5'-end scRNA-seq protocols) [4]. For integration with existing stem cell data repositories, researchers should note that current data integration approaches for stem cell studies vary widely, lacking standardization in common data elements, visualization tools, and ontology mapping [36].
Protocol: Applying Sceptic to Stem Cell Differentiation Data
Input Data Preparation: Begin with a processed count matrix (cells × genes) from time-series scRNA-seq data. The matrix should include cell annotations with experimental time points (e.g., day 0, 3, 7 of differentiation). Time points serve as supervised labels [4].
Feature Selection: Identify highly variable genes that potentially drive differentiation. While Sceptic can handle full transcriptomes, feature selection may improve performance and computational efficiency [4].
Model Training: Implement the one-versus-the-rest SVM classification. For k time points, Sceptic trains k distinct classifiers, each discriminating one time point against all others [4].
Probability Estimation: For each cell, obtain probability scores for all time points from the classifier ensemble. These probabilities represent the confidence that a cell belongs to each temporal class [4].
Pseudotime Calculation: Compute final pseudotime values as the conditional expectation: Pseudotime(cell) = Σ [Probability(timei) × timei] across all time points. This continuous value represents the cell's progression along the differentiation trajectory [4].
Validation: Compare pseudotime assignments with known marker genes expression patterns across the differentiation process to ensure biological validity [4].
Multi-Sample Experimental Design with Lamian
For studies involving multiple stem cell lines or experimental conditions, researchers should consider incorporating Lamian, a comprehensive statistical framework for differential multi-sample pseudotime analysis [5]. Lamian addresses three critical aspects of complex experimental designs: (1) identifying changes in trajectory topology associated with sample covariates; (2) detecting differences in cell density along pseudotime; and (3) uncovering gene expression changes along pseudotime across conditions [5].
When comparing differentiation efficiency between wild-type and genetically modified stem cells, Lamian can statistically test whether the pseudotemporal trajectory topology differs, if certain branches are enriched or depleted, and how gene expression dynamics vary along the differentiation process [5]. Unlike methods that ignore sample-to-sample variation, Lamian properly accounts for cross-sample variability, reducing false discoveries not generalizable to new samples [5].
Table 2: Research Reagent Solutions for Sceptic Applications
| Reagent/Resource | Function in Protocol | Application Notes |
|---|---|---|
| Time-series scRNA-seq data | Primary input for Sceptic analysis | Should span multiple time points capturing key differentiation stages |
| Cell type annotations | Weak supervision for model training | Critical for stem cell populations at different maturation states |
| Marker gene panels | Validation of pseudotime ordering | Pluripotency, lineage-specific markers for trajectory validation |
| Sceptic Python package | Implementation of core algorithm | MIT license, available at https://github.com/Noble-Lab/Sceptic [4] |
| Cross-modality reference data | Application to non-transcriptomic data | scATAC-seq, imaging data for multi-modal applications [4] |
Applications Across Data Modalities
Single-Cell RNA Sequencing Data
Sceptic's primary validation occurred on single-cell RNA sequencing data, where it demonstrated significant improvements in temporal classification accuracy compared to existing methods [4]. For stem cell researchers, this translates to more precise identification of differentiation intermediates and better resolution of transcriptional switches that drive cell fate decisions. The supervised framework is particularly valuable for detecting subtle perturbations in differentiation trajectories caused by genetic modifications or pharmacological treatments [4].
Single-Nucleus Imaging Data
A notable advancement offered by Sceptic is its successful application to single-nucleus image data, extending pseudotime analysis beyond sequencing-based modalities [4]. This capability enables researchers to integrate morphological changes with transcriptional dynamics during stem cell differentiation. The methodology for imaging data follows a similar workflow, with image-derived features substituting for gene expression values as input to the SVM classifier [4].
scATAC-seq and Multi-Modal Integration
Sceptic has demonstrated efficacy in analyzing single-cell ATAC-seq data, capturing chromatin accessibility dynamics through differentiation trajectories [4]. Furthermore, when applied to co-assay datasets, Sceptic detected a methylation delay consistent with independent studies, highlighting its ability to reveal biologically meaningful temporal relationships across molecular layers [4].
For more comprehensive multi-modal integration, researchers can complement Sceptic with tools like scACT, a deep generative model designed for cross-modality translation between unpaired single-cell data [37]. scACT uses cycle-consistent adversarial training to align data across modalities, enabling translation between scRNA-seq and scATAC-seq data without requiring co-assay measurements [37]. This approach facilitates the identification of regulatory relationships between chromatin accessibility and gene expression during stem cell differentiation.
Comparative Analysis with Unsupervised Methods
Methodological Differences
Traditional unsupervised pseudotime methods like Monocle 2, Slingshot, and TSCAN infer cellular trajectories solely from transcriptional similarity without incorporating experimental time information [4] [33]. Slingshot, for instance, constructs a cluster-based minimum spanning tree (MST) then fits simultaneous principal curves to identify multiple branching lineages [33]. While effective for identifying global lineage structures, these approaches lack the temporal grounding afforded by supervised methods.
In contrast, Sceptic and other supervised approaches directly leverage experimental time points as training signals, creating an explicit connection between transcriptional states and temporal progression [4]. This fundamental difference in approach makes supervised methods particularly valuable for time-series experiments where sample collection time points are known and represent meaningful biological milestones in the differentiation process.
Practical Implications for Stem Cell Research
For stem cell researchers, the choice between supervised and unsupervised approaches depends on experimental goals and design. Unsupervised methods remain valuable for exploratory analysis of heterogeneous cell populations without known temporal labels [33]. However, when studying well-defined time-course differentiation experiments, supervised methods like Sceptic offer:
- Enhanced accuracy in ordering cells along known temporal trajectories
- Improved robustness to technical noise through supervised learning
- Better alignment between pseudotime and experimental time
- Superior performance in identifying complex branching events in simulations [4]
As the field moves toward more complex experimental designs involving multiple samples and conditions, comprehensive frameworks like Lamian that account for cross-sample variability will become increasingly important for robust differential trajectory analysis [5].
Sceptic represents a significant advancement in supervised pseudotime analysis, offering improved accuracy and flexibility across multiple data modalities. Its application to stem cell differentiation research provides a more powerful approach for resolving complex temporal trajectories and identifying regulatory decisions underlying cell fate commitment.
The integration of supervised pseudotime methods with emerging multi-omic technologies and analysis frameworks will further enhance their utility. Future developments will likely focus on improved interpretability of supervised models—a challenge noted in broader machine learning applications [38]—and enhanced integration with perturbation datasets to establish causal relationships in differentiation networks.
As single-cell technologies continue to evolve, producing increasingly complex and multimodal datasets, supervised approaches like Sceptic will play a crucial role in extracting biologically meaningful temporal dynamics from stem cell systems, ultimately accelerating discoveries in developmental biology, disease modeling, and regenerative medicine.
The process of hematopoiesis, sustained by hematopoietic stem cells (HSCs), is a dynamic and continuous regenerative process involving complex cell differentiation, lineage choices, and maturation events where all blood cell lineages arise from a pool of HSCs [39]. A significant challenge in studying this process has been the cellular heterogeneity within the most immature hematopoietic stem and progenitor cell (HSPC fraction and the difficulty in capturing the precise sequence of molecular events that dictate lineage commitment [39] [40]. Pseudotime analysis, a computational technique applied to single-cell RNA-sequencing (scRNA-seq) data, has emerged as a powerful solution to this challenge. It allows researchers to reconstruct a pseudotemporal trajectory by ordering individual cells based on the gradual transitions in their transcriptomes, thereby inferring a developmental path from stem cells to committed progenitors without the need for time-course experiments [2] [3]. This case study details the application of pseudotime analysis to unravel the earliest differentiation decisions and lineage commitments in human HSPCs, providing a framework for researchers to study dynamic gene regulatory programs in health, aging, and disease.
Key Biological Findings on HSC Lineage Commitment
Recent single-cell transcriptomic studies have provided unprecedented insights into the hierarchical organization and lineage specification of human HSPCs. A pivotal study profiling over 62,000 FACS-sorted CD34+ BM HSPCs from 15 healthy donors across a human lifetime revealed a consistent hierarchical structure with four major differentiation trajectories [39]. Pseudotime analysis identified an early branching point where multipotent HSPCs first diverge into the megakaryocyte-erythroid progenitor (MEP) lineage, followed by commitments to other lineages [39]. This roadmap delineates the continuous changes in gene expression, such as the downregulation of stemness genes like DLK1 and ADGRG6, and identifies key regulators at critical branching points.
Further enriching our understanding, a comprehensive analysis of 57,489 HSPCs from five tissues across four human developmental stages (early fetal life to adulthood) uncovered significant site- and stage-specific transitions in cellular architecture and gene regulatory networks [40]. The study demonstrated that HSCs show a clear progression from a cycling to a quiescent state and exhibit increased inflammatory signaling as ontogeny progresses. Moreover, lineage specification shifts were evident, with megakaryo-erythropoiesis predominating in early fetal liver, while lympho-erythro-myeloid progenitors expand upon the initiation of bone marrow hematopoiesis [40]. These findings underscore the dynamic nature of the hematopoietic system throughout a human lifetime and provide a crucial baseline for understanding age-specific blood disorders.
Experimental Design and Workflow
Sample Preparation and Single-Cell Sequencing
The foundational step for a successful pseudotime analysis is the generation of high-quality single-cell data. The following protocol is adapted from recent pioneering studies [39] [40].
- Cell Source and Isolation: Obtain bone marrow aspirates from healthy donors across different age groups (e.g., young adult, middle-aged, old). Isplicate CD34+ Hematopoietic Stem and Progenitor Cells (HSPCs) using fluorescence-activated cell sorting (FACS). A recommended marker panel for enriching the most immature HSPCs includes CD34+CD38−CD45RA−CD90+CD49f+ [39]. For developmental studies, sample HSPCs from multiple tissues such as fetal liver, fetal bone marrow, pediatric bone marrow, and adult bone marrow [40].
- Single-Cell Library Preparation: Use a platform like the BD Rhapsody system for targeted transcriptomic and proteomic analysis. Rationally select a panel of ~600 genes for deep-targeted mRNA sequencing, including known HSPC markers, genes associated with leukemia and clonal hematopoiesis, immune-modulatory receptors, and cell cycle reporters [39]. Complement this with oligonucleotide-labelled antibodies (AbSeq) for ~46 surface proteins to capture the surface proteome, which aids in precise cell identification and lineage resolution [39].
- Sequencing: Sequence the libraries to a high saturation (>91% for mRNA, >70% for AbSeq) to ensure robust detection of low-abundance transcripts, which is critical for resolving rare and quiescent HSC populations [39].
Computational Analysis for Pseudotime Reconstruction
The computational workflow transforms raw sequencing data into a reconstructed pseudotemporal trajectory. The following steps, summarized in Figure 1, are critical.
Figure 1: Computational Workflow for Pseudotime Analysis
- Data Preprocessing and Harmonization: Perform rigorous quality control to remove low-quality cells and doublets. Normalize the gene expression matrices to account for differences in sequencing depth. For multi-sample datasets, it is crucial to apply batch effect correction algorithms such as Harmony or Seurat to integrate data from different donors or conditions into a common low-dimensional space without removing biological differences of interest [5] [40].
- Dimensionality Reduction and Clustering: Reduce the dimensionality of the normalized data using Principal Component Analysis (PCA). Use the top principal components for graph-based clustering (e.g., Louvain algorithm) to group transcriptionally similar cells into discrete clusters [39] [3].
- Trajectory Inference with TSCAN: Apply the TSCAN algorithm to reconstruct the pseudotemporal trajectory. TSCAN first constructs a cluster-based Minimum Spanning Tree (MST), which connects the centroids of the identified cell clusters. This approach reduces complexity and improves the stability of the inferred trajectory compared to methods that connect individual cells [2] [3]. The tree can be constructed with an "outgroup" to avoid connecting biologically unrelated populations [2].
- Pseudotime Calculation: Project each cell onto the nearest edge of the MST. The pseudotime value for each cell is then calculated as the distance along the MST from a defined root node (e.g., an endpoint cluster enriched for HSC markers like HLF and HOPX) [2]. For branched trajectories, multiple pseudotime values (one for each path) will be assigned to each cell.
Detailed Experimental Protocol
Single-Cell RNA-seq Wet-Lab Protocol
Goal: To generate a high-quality single-cell suspension of HSPCs for sequencing. Materials:
- Fresh Human Bone Marrow Aspirates or viably frozen mononuclear cells.
- FACS Buffer: PBS supplemented with 2% fetal bovine serum (FBS) and 1mM EDTA.
- Antibody Panel for HSPC Enrichment: Anti-human CD34, CD38, CD45RA, CD90, CD49f, and a lineage cocktail (Lin) against mature blood cells.
- Viability Stain: Propidium iodide or DAPI.
- Single-Cell Partitioning System: BD Rhapsody cartridge or equivalent (10x Genomics).
- Library Preparation Kits: BD Rhapsody Single-Cell mRNA & AbSeq Analysis Kit or equivalent.
Procedure:
- Cell Preparation: Thaw frozen bone marrow mononuclear cells or process fresh aspirates using Ficoll density gradient centrifugation to isolate mononuclear cells.
- Staining: Resuspend cells in FACS buffer and incubate with the antibody cocktail for 30 minutes on ice. Include a viability marker.
- Cell Sorting: Using a FACS sorter, isolate the target HSPC population (e.g., Lin−CD34+CD38−). To ensure high viability (>95%), sort cells directly into a collection tube containing culture medium with 10% FBS.
- Washing and Counting: Wash the sorted cells twice and perform a final resuspension in FACS buffer. Count the cells and assess viability using a hemocytometer or automated cell counter.
- Loading and Library Prep: Load the cell suspension at an optimized concentration (e.g., 1,000 cells/μL) into the single-cell partitioning system according to the manufacturer's instructions. Proceed with cDNA synthesis, target amplification for the selected gene panel, and library construction.
- Sequencing: Pool the final libraries and sequence on an Illumina platform to a minimum depth of 50,000 reads per cell.
Computational Protocol for Pseudotime Analysis
Goal: To reconstruct differentiation trajectories from raw sequencing data.
Software Requirements: R (version 4.5 or higher), Bioconductor packages.
Key R Packages: TSCAN, Slingshot, tradeSeq, Seurat, Lamian.
Procedure:
- Data Input and QC (Reads to Counts):
- Use
FastQCandCell Ranger(10x) orBD Rhapsodyanalysis software for initial read alignment and gene counting. - Load the count matrix into R and create a
SingleCellExperimentobject. - Filter out cells with an abnormally high mitochondrial gene percentage (>10%) or an extremely low number of detected genes. Remove genes expressed in fewer than 10 cells.
- Use
Normalization and Integration:
- Normalize counts using
scranto correct for library size. - If multiple samples are present, integrate them using
Harmonyto remove batch effects while preserving biological variation.
- Normalize counts using
Dimensionality Reduction and Clustering:
- Identify highly variable genes.
- Perform PCA on the normalized and integrated data.
- Construct a shared nearest neighbor (SNN) graph and perform Louvain clustering using the top PCs.
Trajectory Inference with TSCAN:
- Run
quickPseudotime()from theTSCANpackage, providing the PCA matrix and cluster labels. - Specify the root cluster manually based on high expression of HSC markers (e.g.,
HLF,HOPX,CRHBP). - Extract the pseudotime ordering and MST structure for downstream analysis.
- Run
Differential Expression and Branch Analysis:
- Use
tradeSeqto identify genes whose expression changes significantly along pseudotime (TDE) or that are associated with specific branches (DE). - For multi-sample designs across conditions (e.g., young vs. old), use the
Lamianframework to test for differential topology, cell density, and gene expression, while accounting for cross-sample variability [5].
- Use
The Scientist's Toolkit: Reagents and Computational Tools
Table 1: Essential Research Reagents and Tools for Pseudotime Analysis of HSPCs
| Category | Item | Function/Application |
|---|---|---|
| Wet-Lab Reagents | Anti-human CD34 Antibody | Primary marker for isolating human HSPCs by FACS. |
| Anti-human CD38 Antibody | Used with CD34 to enrich for primitive HSPCs (CD34+CD38−). | |
| BD Rhapsody Single-Cell mRNA & AbSeq Kit | Enables targeted transcriptomic and surface protein quantification from the same cell. | |
| Viability Dye (e.g., DAPI) | Distinguishes live from dead cells during sorting to ensure data quality. | |
| Computational Tools | TSCAN | Infers pseudotemporal trajectories using a cluster-based Minimum Spanning Tree (MST) approach [2] [3]. |
| Lamian | A comprehensive framework for differential pseudotime analysis with multiple samples, accounting for cross-sample variability [5]. | |
| Seurat / Harmony | Standard toolkits for single-cell data preprocessing, integration, and clustering. | |
| tradeSeq | Identifies differentially expressed genes along pseudotime and across trajectory branches. |
Data Interpretation and Visualization
Interpreting the results of a pseudotime analysis involves synthesizing information from multiple outputs. The trajectory itself can be visualized by overlaying the MST on a dimensionality reduction plot like UMAP, as shown in Figure 2. Cells are colored by their pseudotime value, illustrating the progression from stem cells to committed progenitors.
Figure 2: Schematic of a Reconstructed HSPC Trajectory
Key analytical steps in interpretation include:
- Identifying Gene Dynamics: Using tools like
tradeSeq, fit generalized additive models (GAMs) to gene expression as a function of pseudotime. This allows for the identification of genes with dynamic expression patterns. For example, the study by [39] revealed continuous downregulation of DLK1 and ADGRG6 during early HSPC differentiation. - Analyzing Branching Behavior: Detect genes that are differentially expressed at lineage branch points. These genes are potential drivers of cell fate decisions. The discovery of CD273/PD-L2 in a subfraction of quiescent, immature HSPCs with immune-modulatory function is a prime example of a novel finding enabled by this analysis [39].
- Multi-Sample Comparison: When samples from different conditions (e.g., age groups) are available,
Lamiancan be used to test three fundamental questions:- Topology: Does the trajectory structure differ between conditions?
- Cell Density: Are there differences in the proportion of cells along a branch?
- Gene Expression: Is the pseudotemporal expression pattern of a gene different between conditions? [5].
Table 2: Example Quantitative Findings from Pseudotime Analysis of HSPCs [39]
| Measurement | HSC/MPP Cluster (HSC-1) | Committed Progenitor (e.g., GMP) | Biological Significance |
|---|---|---|---|
| Expression of HLF | High | Low | Marker of stemness, enriched in most primitive HSCs. |
| Expression of MYC | Low | High | Indicates entry into cell cycle and active proliferation upon commitment. |
| Quiescence (Low Cell Cycle Score) | Highest | Lower | Confirms that the most primitive HSCs are predominantly quiescent. |
| CD273/PD-L2 Protein | High in a subfraction | Low | Identifies a novel subset of HSCs with immune-regulatory potential. |
The application of pseudotime analysis to single-cell transcriptomic data has fundamentally advanced our understanding of HSC lineage commitment. It has provided a continuous molecular map of early differentiation, confirming an early branching point into the megakaryocyte-erythroid lineage and detailing gene expression dynamics that are conserved across the human lifespan, albeit with age-related shifts in differentiation productivity [39]. The integration of surface protein expression via AbSeq has further refined cell identity and uncovered novel functional subsets, such as the CD273/PD-L2 expressing HSPCs [39].
Future directions in this field will involve the deeper integration of multi-omics data at the single-cell level, including epigenomic and proteomic data, to build causal gene regulatory networks that underlie fate decisions [41]. Computational frameworks like Lamian that rigorously account for multi-sample variability will become increasingly important for robustly identifying trajectory alterations associated with disease or drug treatment [5]. Furthermore, leveraging machine learning on these high-dimensional datasets holds the promise of predicting novel regulatory factors and therapeutic targets [41]. As these tools and protocols become more accessible and standardized, they will powerfully drive discoveries in fundamental stem cell biology and the development of novel therapies for hematologic malignancies and disorders.
In stem cell differentiation research, a primary goal is to understand the dynamic regulatory programs that guide a cell from a pluripotent state to a specialized fate. Pseudotime analysis refers to the computational process of ordering individual cells along a hypothetical continuum representing their biological progression, such as differentiation or activation, based on their transcriptomic similarities [2]. This reconstructed trajectory allows researchers to move beyond static snapshots of cell populations and model continuous biological processes.
While trajectory inference identifies the path itself, gene-level analysis focuses on understanding which genes drive this progression and how their expression is regulated. Clustering genes based on their dynamic expression patterns along pseudotime is crucial for identifying co-regulated gene modules, inferring underlying regulatory networks, and linking specific molecular programs to cell fate decisions. The scSTEM (single-cell STEM) method is specifically designed for this task, enabling the identification of significant gene expression profiles and their functional enrichment along differentiation paths [13].
The Analytical Landscape: Tools for Trajectory and Gene-Level Analysis
The field of pseudotime analysis encompasses a variety of tools, each with a specific focus, from broad trajectory inference to detailed gene-level clustering. The table below summarizes key methods and their primary functions.
Table 1: A Selection of Computational Tools for Pseudotime and Gene-Level Analysis
| Tool Name | Primary Analytical Function | Key Application in Differentiation Research |
|---|---|---|
| scSTEM [13] | Clustering genes into dynamic expression profiles along pseudotime. | Identifying significant gene clusters and biological processes active along specific trajectory paths. |
| Lamian [5] | A multi-sample framework for differential pseudotime analysis. | Identifying changes in gene expression, cell density, or trajectory topology associated with different conditions (e.g., disease severity). |
| TSCAN [2] | Constructing pseudotemporal trajectories via cluster-based minimum spanning trees (MST). | Providing a scalable and interpretable method for inferring the overall trajectory structure. |
| Slingshot [2] | Fitting principal curves to identify trajectories. | Reconstructing lineage paths in a flexible, cluster-free manner. |
| scRDEN [42] | Constructing rank differential expression networks and robust trajectory inference. | Inferring gene-gene interaction networks and cell subpopulations based on stable relative expression ordering. |
The following diagram illustrates the general workflow for gene-level dynamic analysis, integrating tools like scSTEM into a broader pseudotime analysis pipeline.
Application Notes: A Protocol for scSTEM Analysis
This protocol provides a detailed, step-by-step guide for applying scSTEM to cluster dynamic gene expression patterns in a stem cell differentiation dataset.
Software and Data Preparation
- Computational Environment: Ensure R (version 4.0 or higher) is installed. Install scSTEM from the official GitHub repository (
https://github.com/alexQiSong/scSTEM[13]). - Input Data Requirements: Prepare the following data objects:
- Expression Count Matrix: A normalized matrix of gene expression counts (genes as rows, cells as columns).
- Cell Metadata: A data frame containing cell annotations (e.g., batch, sample origin).
- Gene Metadata: A data frame containing gene identifiers and symbols.
- Trajectory Inference: First, infer a pseudotemporal trajectory using a supported method. The scSTEM package is compatible with several popular algorithms, including Monocle 3 [13], Slingshot [13], and PAGA [13]. Follow the specific documentation for your chosen method to generate a trajectory object.
Step-by-Step scSTEM Workflow
Load Data and Trajectory: Import your pre-processed single-cell data and the previously computed trajectory object into the R session.
Path Selection: Use the scSTEM graphical user interface (GUI) to visually inspect the inferred trajectory and select the specific path or branch for analysis. For example, you might select a path leading from hematopoietic stem cells to a specific lineage like T-cells [13].
Gene Expression Summarization: For the selected path, summarize the expression of each gene. scSTEM provides multiple metrics for this step. The most common is the mean expression, which calculates the average expression of a gene within bins of cells along the pseudotime. Alternatively, entropy reduction can be used, which captures the reduction in transcriptomic diversity as cells become more specialized [13]. This step transforms noisy single-cell data into a smooth time-series-like profile for each gene.
Gene Clustering: Execute the core scSTEM clustering function. The method works by comparing the summarized gene profiles to a set of pre-computed, short temporal expression patterns. Genes are assigned to the most similar pre-defined profile, and these profiles are then grouped into larger clusters [13]. This approach allows for the assignment of a p-value to each cluster, evaluating its significance against randomized data.
Output Interpretation: The primary outputs of scSTEM include:
- A table of genes and their assigned cluster.
- A plot visualizing the significant expression profiles.
- A table of enriched Gene Ontology (GO) terms for each significant cluster, which directly links dynamic gene patterns to biological function.
Experimental Design and Reagent Solutions
The following table outlines key experimental and computational reagents essential for conducting a study that incorporates scSTEM analysis.
Table 2: Key Research Reagent Solutions for scSTEM-based Differentiation Studies
| Reagent / Resource | Function / Description | Example Application in Protocol |
|---|---|---|
| Single-Cell RNA-seq Kit | Generates the barcoded cDNA libraries from individual cells for sequencing. | 10x Genomics Chromium Single Cell 3' Gene Expression kit. |
| Cell Sorting Marker Panel | Antibodies for Fluorescence-Activated Cell Sorting (FACS) to isolate specific progenitor or differentiated cell populations. | Antibodies against CD34 (HSCs), CD3 (T-cells), CD19 (B-cells) for validating trajectory branches. |
| Trajectory Inference Software | Algorithm to reconstruct the pseudotemporal ordering of cells from the gene expression matrix. | Monocle 3 or Slingshot to define the differentiation path before scSTEM analysis. |
| scSTEM Software | The specialized tool for clustering gene dynamic profiles on the inferred trajectory. | Clustering genes along a path from HSC to T-cells to find immune activation profiles. |
| Gene Set Enrichment Tool | Software for functional interpretation of gene clusters (e.g., clusterProfiler). | Annotating a significant scSTEM cluster with "regulation of NK cell mediated cytotoxicity" [13]. |
Case Study: Uncovering Immune Cell Differentiation
In a study of human fetal immune cells, scSTEM was applied to 103,766 blood cells. Monocle 3 inferred a trajectory with 7 distinct paths. scSTEM analysis identified several significant gene clusters associated with specific immune functions [13]:
- Path 1, Cluster 0: Genes in this cluster showed an increasing expression profile and were significantly enriched for "regulation of NK cell-mediated cytotoxicity," highlighting a molecular program for Natural Killer cell function.
- Path 5, Cluster 1 & Path 4, Cluster 1: These clusters, characterized by dynamic expression patterns, were both enriched for terms related to "T cell activation and differentiation," pinpointing key regulators of T-cell fate along distinct branching paths.
This application demonstrates how scSTEM moves beyond simple trajectory inference to identify the specific gene ensembles that define functional cellular identities during differentiation.
Advanced Considerations and Future Directions
For studies involving multiple biological replicates across different conditions (e.g., healthy vs. disease), methods like Lamian should be considered. Lamian accounts for cross-sample variability, reducing false discoveries that are not generalizable. It can test for three types of changes: in trajectory topology, cell density along the path, and gene expression dynamics, providing a more robust statistical framework for comparative studies [5].
Emerging methods like scRDEN focus on the stability of gene-gene interactions rather than absolute expression levels, potentially offering greater robustness in noisy datasets [42]. Furthermore, new approaches are leveraging artificial intelligence to infer differentiation status and trajectories directly from histopathology images, promising to extend dynamic analysis to vast repositories of existing tissue samples [43].
Clustering dynamic gene expression patterns with tools like scSTEM provides a critical, gene-centric view of the processes governing stem cell differentiation. By integrating seamlessly with trajectory inference methods, scSTEM enables researchers to distill complex single-cell datasets into functionally coherent gene modules active along specific lineage paths. This protocol outlines the practical steps for its application, from data preparation to functional interpretation, providing a solid foundation for uncovering the molecular drivers of cell fate decisions.
Single-cell RNA-sequencing (scRNA-seq) has revolutionized our ability to study dynamic biological processes such as stem cell differentiation at unprecedented resolution. Pseudotime analysis methods computationally order cells along developmental trajectories to reconstruct continuous biological processes. However, most existing methods focus on single-sample analysis, creating a significant methodological gap for multi-condition studies that are essential for understanding how genetic perturbations, disease states, or therapeutic interventions alter stem cell differentiation pathways. This application note introduces Lamian, a comprehensive statistical framework specifically designed for differential multi-sample pseudotime analysis. We detail Lamian's modular architecture, provide step-by-step protocols for implementation, and demonstrate its application for identifying differential trajectory topology, cell density, and gene expression patterns in multi-condition stem cell differentiation studies.
The study of stem cell differentiation represents a fundamental challenge in developmental biology and regenerative medicine. Pseudotime analysis with single-cell RNA-sequencing (scRNA-seq) data has emerged as a powerful approach to reconstruct dynamic gene regulatory programs along continuous differentiation processes [5]. While numerous computational methods have been developed to infer pseudotemporal trajectories within individual biological samples, most ignore critical sample-to-sample variability and lack robust statistical frameworks for comparing trajectories across multiple experimental conditions [5] [16].
This methodological gap presents a substantial limitation for stem cell researchers investigating how differentiation trajectories are altered by disease mutations, pharmacological treatments, or varying differentiation protocols. Existing methods that do accommodate multiple conditions, such as Phenopath and condiments, either fail to properly account for sample-level variability or make restrictive assumptions about the nature of expression changes along pseudotime [5] [16]. Ignoring cross-sample variability can lead to false discoveries that do not generalize to new samples, potentially misdirecting experimental validation efforts.
Lamian (Latent Multi-sample Analysis) addresses these limitations through a comprehensive, statistically-rigorous computational framework specifically designed for differential multi-sample pseudotime analysis [5] [44]. By explicitly modeling sample-to-sample variation, Lamian enables researchers to identify robust changes in trajectory topology, cell density distribution, and gene expression dynamics associated with experimental conditions or sample covariates—all while properly controlling false discovery rates in multi-sample datasets [5] [45].
Conceptual Foundation and Multi-Sample Challenge
Pseudotime analysis methods traditionally order cells along inferred trajectories based on transcriptional similarity, effectively reconstructing developmental continuums from snapshot data. In stem cell biology, this enables researchers to characterize differentiation pathways, identify branching points where lineage commitment occurs, and track gene expression dynamics throughout development. However, when applied to multi-condition studies—such as comparing wild-type versus mutant stem cells or testing different differentiation conditions—conventional single-sample approaches require analyzing each sample separately then attempting post hoc comparisons, which lacks proper statistical grounding for assessing whether observed differences exceed natural sample-to-sample variation [5].
Lamian addresses this fundamental challenge through a unified framework that simultaneously analyzes multiple samples while accounting for their inherent variability. The method operates on the principle that biological replicates provide essential information about the natural variation in differentiation processes, enabling distinction between consistent condition-specific effects and random sample-specific variations [5] [44]. This approach significantly improves the generalizability of findings to new samples, a critical consideration for robust experimental design in stem cell research.
Computational Architecture and Workflow
Lamian implements a modular architecture that systematically addresses key challenges in multi-sample pseudotime analysis. The framework consists of four integrated modules that progress from trajectory inference through differential analysis of multiple trajectory aspects.
Figure 1: Lamian workflow architecture. The framework processes multiple data inputs through four analytical modules to generate comprehensive outputs for multi-sample trajectory analysis.
Comparative Advantages in Stem Cell Research
For stem cell researchers investigating differentiation processes, Lamian provides several distinct advantages over existing methods. Unlike approaches that pool cells from multiple samples without accounting for sample identity, Lamian explicitly models sample-level variability, reducing false discoveries that cannot be generalized to new samples [5] [45]. The framework's comprehensive approach simultaneously evaluates three fundamental aspects of trajectory variation—topology, gene expression, and cell density—providing an integrated understanding of how experimental conditions influence differentiation pathways.
Table 1: Methodological comparison of Lamian versus alternative approaches
| Feature | Lamian | condiments | Phenopath | Single-sample Methods |
|---|---|---|---|---|
| Multi-sample support | Full support with statistical accounting for sample variability | Limited (assumes one sample per condition) | Basic support without separate sample-level variance estimation | None (single sample only) |
| Differential topology detection | Yes | Yes | No | No |
| Differential expression along pseudotime | Yes (non-linear patterns) | Yes | Yes (linear patterns only) | Yes (within sample only) |
| Differential cell density analysis | Yes | Partial | No | No |
| False discovery rate control | Appropriate for multi-sample data | May generate sample-specific false discoveries | May generate sample-specific false discoveries | Not applicable for cross-condition comparisons |
| Stem cell differentiation applications | Ideal for multi-condition differentiation studies | Suitable for simple two-condition comparisons | Limited by linearity assumption | Restricted to single-sample characterization |
Additionally, Lamian incorporates statistical rigor often missing from pseudotime methods. By employing bootstrap resampling to quantify trajectory uncertainty and mixed effects models that account for both cross-sample and cross-cell variability, the framework provides confidence assessments for identified differential patterns [5] [44]. This is particularly valuable in stem cell research where differentiation efficiency may vary between experimental replicates due to technical and biological factors.
Lamian Modules and Analytical Approaches
Module 1: Trajectory Inference and Topology Uncertainty
The initial module addresses the fundamental challenge of robust trajectory inference from multi-sample data. Lamian utilizes a cluster-based minimum spanning tree (cMST) approach, building upon the TSCAN algorithm, to construct pseudotemporal trajectories from harmonized multi-sample data [5] [44]. This method offers scalability to large cell numbers and flexibility in accommodating both automatic and manual trajectory construction.
A distinctive feature of Lamian is its rigorous quantification of topological uncertainty through bootstrap resampling. The algorithm repeatedly resamples cells with replacement, reconstructs trajectories for each bootstrap iteration, then calculates branch detection rates—defined as the proportion of bootstrap runs in which each branch is identified [44]. This approach provides researchers with quantitative confidence measures for inferred trajectory structures, which is particularly valuable when comparing differentiation pathways across conditions.
The protocol for this module involves:
- Input Preparation: Low-dimensional embeddings (PCA, Harmony, scVI, etc.) from integrated multi-sample data, normalized expression matrices, and sample metadata with condition information.
- Joint Clustering: Cells from all samples are jointly clustered to define cellular states across the entire dataset.
- Trajectory Construction: Application of cMST to construct an initial pseudotemporal trajectory with multiple potential branches.
- Root Selection: Designation of trajectory start point either by specifying a tree node or providing marker genes expected to be highly expressed at the start of pseudotime (e.g., pluripotency markers for stem cell differentiation).
- Branch Enumeration: Automatic identification of all pseudotemporal paths and branches within the trajectory structure.
- Uncertainty Quantification: Bootstrap resampling with trajectory reconstruction to calculate detection rates for each branch.
Module 2: Differential Topology Analysis
The second module identifies fundamental changes in trajectory structure associated with sample covariates. In stem cell research, this enables detection of condition-specific alterations in differentiation pathways, such as emergence of novel lineages or disappearance of expected branches in mutant versus wild-type conditions.
Lamian quantifies topological changes through branch cell proportion analysis—for each sample, it calculates the proportion of cells residing in each trajectory branch [5] [44]. These proportions naturally reflect the abundance or absence of specific differentiation paths, with zero or low proportions indicating branch depletion or absence. The framework then fits regression models to test associations between branch proportions and sample covariates while accounting for cross-sample variation.
The analytical implementation offers two complementary approaches:
- Branch-Specific Analysis: Binomial logistic regression models assess covariate effects on individual branch proportions, facilitating focused investigation of specific differentiation lineages.
- Global Topology Analysis: Multinomial logistic regression models jointly analyze all branches, testing overall distribution changes across the complete trajectory structure.
For stem cell researchers, this module can identify how genetic perturbations or differentiation protocol variations alter the fundamental architecture of differentiation pathways—for example, revealing whether a mutation causes complete absence of a particular lineage or merely reduces its cellularity.
Module 3: Differential Expression Analysis
Module 3 represents one of Lamian's most statistically sophisticated components, identifying gene expression changes along pseudotime while accounting for multi-sample variability. The framework employs functional mixed effects models to test two fundamental types of differential expression [5]:
- Time-associated differential expression (TDE): Identifies genes whose expression varies along pseudotime (testing H~0~: f(t) = c versus H~1~: f(t) ≠ c), revealing genes involved in differentiation progression regardless of condition.
- Covariate-associated differential expression (XDE): Detects genes whose pseudotemporal expression patterns differ across conditions (e.g., between treatment and control), identifying condition-specific regulatory changes.
The implementation properly accounts for the hierarchical data structure—cells nested within samples—preventing inflated false discovery rates that plague methods treating all cells as independent observations. This approach ensures identified expression differences represent consistent condition effects rather than sample-specific artifacts.
Table 2: Differential analysis capabilities in Lamian
| Analysis Type | Null Hypothesis | Alternative Hypothesis | Biological Interpretation in Stem Cell Studies |
|---|---|---|---|
| Differential Topology | Branch proportion unaffected by condition | Branch proportion associated with condition | Altered differentiation lineage availability |
| Differential Expression (TDE) | Gene expression constant along pseudotime | Gene expression varies along pseudotime | Gene involvement in differentiation process |
| Differential Expression (XDE) | Expression pattern identical across conditions | Expression pattern differs across conditions | Condition-specific alteration of differentiation program |
| Differential Cell Density | Cell distribution along pseudotime unaffected by condition | Cell distribution along pseudotime associated with condition | Altered differentiation kinetics or efficiency |
Module 4: Differential Cell Density Analysis
The final module identifies changes in how cells distribute along pseudotime between conditions. In stem cell differentiation, this can reveal condition effects on differentiation kinetics—for example, whether a treatment accelerates progression through a developmental stage or causes accumulation at specific points.
Lamian implements statistical tests to detect density differences while accounting for multi-sample variability, distinguishing consistent condition effects from random sample variations. This analysis complements gene expression findings by revealing potentially distinct regulatory mechanisms—conditions might alter the pace of differentiation without fundamentally changing gene expression patterns, or vice versa.
Experimental Protocol and Implementation
Data Preparation and Preprocessing
Successful application of Lamian begins with appropriate data preprocessing and harmonization. The following protocol outlines critical preparation steps for stem cell differentiation datasets:
Sample Processing: Process raw sequencing data through standard scRNA-seq pipelines (Cell Ranger, STARsolo, or Alevin) for each biological sample separately, generating count matrices for individual samples.
Quality Control: Apply sample-specific quality control filters using tools like Seurat or Scanpy, removing low-quality cells based on:
- Mitochondrial gene percentage (<10-20%)
- Number of detected genes (typically 500-5000 genes/cell depending on protocol)
- Total UMI counts (protocol-dependent thresholds)
- Doublet identification and removal (using Scrublet or DoubletFinder)
Normalization and Feature Selection: Normalize counts within each sample using SCTransform (Seurat) or scran methods, then select highly variable genes for downstream integration.
Data Integration: Harmonize multiple samples into a common low-dimensional space using integration methods such as Harmony, Seurat CCA, or scVI to remove technical batch effects while preserving biological variation [5]. Select integration approaches that effectively align similar cell states across samples without over-correction.
Input Formatting: Prepare three essential inputs for Lamian:
- Low-dimensional embeddings (e.g., PCA, Harmony dimensions)
- Normalized expression matrices
- Cell annotation data frame linking each cell to its sample of origin and condition information
Lamian Implementation Protocol
Once data is appropriately prepared, implement the Lamian analytical workflow through the following step-by-step protocol:
Figure 2: Step-by-step implementation protocol for Lamian analysis of stem cell differentiation data.
Code Implementation Example:
Table 3: Essential research reagents and computational tools for Lamian implementation
| Resource Category | Specific Tools/Reagents | Function/Purpose | Implementation Notes |
|---|---|---|---|
| Wet-lab Reagents | Chromium Next GEM Single Cell 3' Reagent Kit (10x Genomics) | High-throughput scRNA-seq library preparation | Optimized for cellular throughput and cost efficiency |
| Wet-lab Reagents | SMART-Seq2 Reagents | Full-length scRNA-seq with enhanced sensitivity | Preferred for detecting low-abundance transcripts |
| Wet-lab Reagents | Cell Hashtag Oligonucleotides (HTO) | Sample multiplexing in single-cell experiments | Enables processing of multiple samples in single run |
| Cell Culture Materials | Defined stem cell culture media | Maintenance of pluripotent stem cells | Essential for consistent differentiation studies |
| Cell Culture Materials | Differentiation induction factors | Directed differentiation toward specific lineages | Enables controlled differentiation experiments |
| Computational Tools | Seurat, SingleCellExperiment | Single-cell data container and basic processing | Standardized data structures for interoperability |
| Computational Tools | Harmony, scVI | Multi-sample data integration | Critical for batch effect correction |
| Computational Tools | Lamian R package | Differential multi-sample pseudotime analysis | Core analytical framework |
| Computational Resources | High-performance computing cluster | Computational-intensive bootstrap procedures | Recommended for large datasets (>10,000 cells) |
Application to Stem Cell Differentiation Research
Case Study: Identifying Differential Differentiation Trajectories
In a representative application to stem cell research, Lamian was employed to investigate how a specific genetic mutation alters mesenchymal stem cell (MSC) differentiation potential [45]. The study design incorporated multiple biological replicates of wild-type and mutant cells undergoing osteogenic differentiation, with scRNA-seq profiling at multiple time points.
Application of Lamian's Module 1 revealed consistent trajectory structures with high branch detection rates (>85%) for main osteogenic lineages, establishing a foundation for robust differential analysis. Module 2 identified significant differential topology, with mutant samples showing complete absence of a specific osteogenic branch present in all wild-type replicates, suggesting impaired lineage potential.
Differential expression analysis (Module 3) revealed delayed activation of key osteogenic transcription factors in mutant cells, while differential cell density analysis (Module 4) showed accumulation of mutant cells in early progenitor states with reduced progression to mature osteoblasts. This multi-faceted characterization provided a comprehensive understanding of the mutation's effects, demonstrating how Lamian integrates complementary evidence types to generate robust biological insights.
Interpretation Guidelines for Stem Cell Researchers
Effective interpretation of Lamian results requires attention to several key considerations:
Topology Changes: Significant differential topology indicates fundamental alterations in available differentiation paths. Researchers should distinguish between complete branch absence (zero cell proportion) versus reduced cellularity (low proportion), which may reflect distinct biological mechanisms.
Expression Dynamics: When interpreting XDE results, consider both the magnitude and temporal context of expression differences. Early-pseudotime differences may affect lineage specification, while late-pseudotime differences may impact terminal differentiation.
Density Distributions: Differential cell density along pseudotime can indicate altered differentiation kinetics. Accumulation at specific positions may suggest developmental bottlenecks or impaired progression through specific transitions.
Multiple Testing: Lamian appropriately adjusts for multiple testing within but not across analytical modules. Researchers should consider the overall evidence pattern when interpreting results, prioritizing genes and pathways with consistent signals across complementary tests.
Lamian represents a significant methodological advancement for stem cell researchers investigating differentiation trajectories across multiple experimental conditions. By providing a statistically rigorous framework that accounts for biological variability between samples, Lamian enables robust identification of differential trajectory topology, gene expression patterns, and cell distribution changes that genuinely reflect condition effects rather than sample-specific artifacts.
The framework's modular architecture offers comprehensive analytical capabilities through accessible implementation protocols, making sophisticated multi-sample trajectory analysis attainable for stem cell biologists. As single-cell studies increasingly incorporate complex experimental designs with multiple conditions, replicates, and time points, Lamian addresses the critical need for analytical methods that can properly account for hierarchical data structures while providing biological interpretability.
For the stem cell research community, Lamian facilitates unprecedented insight into how genetic, environmental, and therapeutic perturbations alter differentiation processes, accelerating discovery in regenerative medicine, disease modeling, and developmental biology.
Navigating Analytical Challenges: Optimization and Best Practices
In single-cell RNA sequencing (scRNA-seq) studies of stem cell differentiation, a primary challenge is distinguishing true differentiation signals from confounding effects, with the cell cycle being one of the most significant biological confounders [46]. The transcriptional oscillations associated with cell cycle progression can account for substantial gene expression heterogeneity, potentially obscuring the molecular programs guiding lineage specification [46] [47]. This protocol details computational methods for deconvoluting cell cycle effects from differentiation signals in pseudotime analysis, enabling researchers to achieve more accurate reconstruction of stem cell trajectories. The framework is particularly valuable for investigating developmental processes, disease mechanisms, and drug responses in stem cell systems.
Background
The Cell Cycle as a Confounder in scRNA-seq Data
Cell cycle progression introduces systematic variation in scRNA-seq data that can mimic or mask differentiation signals. Numerous studies have demonstrated a tight association between cell cycle and cell fate decisions during development and tissue regeneration [46]. As the main rate-limiting step of cell differentiation, cell cycle control is essential for generating cellular diversity and maintaining tissue homeostasis [46]. In cancer cells, de-differentiation and re-entry into the cell cycle further complicates transcriptional analysis [46]. Therefore, accurate identification and removal of cell cycle effects is crucial for resolving true differentiation trajectories.
Pseudotime Analysis in Stem Cell Research
Pseudotime analysis computationally orders cells along a continuum reflecting their biological progression, enabling the study of dynamic processes like stem cell differentiation [5] [47]. This approach has been successfully applied to diverse biological systems, including hematopoietic stem cell differentiation [48], neural stem cell development [49], pre-implantation embryo development [50], and macrophage phenotypic transitions in atherosclerosis [51]. However, when cell cycle effects are not properly accounted for, the inferred pseudotemporal trajectories and identified differentially expressed genes may reflect cycling rather than differentiation.
Computational Methods and Tools
Table 1: Computational Methods for Addressing Cell Cycle Effects in Pseudotime Analysis
| Method | Approach | Key Features | Applicability |
|---|---|---|---|
| CCPE [46] | Unsupervised pseudotime estimation | Uses discriminative helix to characterize circular cell cycle process; robust to dropout events | General scRNA-seq data without pre-annotated genes |
| Lamian [5] [52] | Multi-sample differential pseudotime analysis | Accounts for cross-sample variability; tests for topology, expression, and density changes | Multiple samples across conditions |
| PseudotimeDE [47] | Differential expression testing | Accounts for pseudotime inference uncertainty; provides well-calibrated p-values | Any user-provided pseudotime trajectory |
| Sceptic [4] | Supervised pseudotime analysis | Uses support vector machine; integrates observed time labels | Time-series single-cell data |
Cell Cycle Pseudotime Estimation (CCPE)
CCPE is specifically designed to characterize cell cycle timing and identify cell cycle phases from scRNA-seq data. The method uses a discriminative helix to characterize the circular process of the cell cycle and estimates each cell's pseudotime along this process [46]. Key advantages include:
- Robustness to dropout events: CCPE maintains performance even with high dropout rates common in scRNA-seq data [46]
- Application across cell types: Effectively identifies cell cycle marker genes across diverse biological systems [46]
- Circular trajectory modeling: The helical representation accurately captures the recurring nature of the cell cycle
The following diagram illustrates the CCPE workflow for deconvoluting cell cycle effects:
Multi-Sample Differential Analysis with Lamian
For studies involving multiple samples across different conditions, Lamian provides a comprehensive framework for differential pseudotime analysis while accounting for cell cycle effects [5] [52]. The method consists of four modules:
- Tree topology construction and uncertainty assessment: Uses cluster-based minimum spanning tree (cMST) to construct pseudotemporal trajectories and evaluates branch stability through bootstrap resampling [5]
- Differential topology testing: Identifies changes in trajectory branching associated with sample covariates using branch cell proportion analysis [5]
- Differential expression analysis: Tests for genes whose expression along pseudotime differs between conditions (XDE test) while accounting for sample-to-sample variation [5]
- Differential cell density analysis: Evaluates whether cell distribution along pseudotime differs between conditions [52]
Lamian's ability to account for cross-sample variability reduces false discoveries that are not generalizable to new samples, a critical consideration when studying heterogeneous stem cell populations [5].
Accounting for Pseudotime Inference Uncertainty with PseudotimeDE
PseudotimeDE addresses a crucial limitation in pseudotime analysis by incorporating the uncertainty of pseudotime inference into differential expression testing [47]. The method uses a subsampling approach to estimate pseudotime inference uncertainty and propagates this uncertainty to statistical tests for identifying differentially expressed genes. This approach generates well-calibrated p-values that enable reliable false discovery rate control, which is essential for identifying true differentiation markers amid cell cycle effects [47].
Experimental Protocol
Data Preprocessing and Quality Control
Materials:
- Raw scRNA-seq count matrix
- Computational resources (R/Python environment with sufficient memory)
- Quality control tools (Seurat, Scanpy, or equivalent)
Procedure:
- Data Normalization: Normalize single-cell RNA-seq datasets using log2 transformation with a pseudo count of 1:
log2(expression + 1)[46] - Feature Selection: Exclude genes expressed in fewer than 5% of all cells, then select significantly differentially expressed genes using
dpFeatureor similar unsupervised feature selection methods [46] - Cell Quality Filtering: Remove low-quality cells with fewer than 200 genes detected, unusually high gene counts (>7,000), or excessive mitochondrial content (>10%) [51]
- Batch Effect Correction: Apply harmonization methods such as Harmony, Seurat, or scVI to integrate multiple samples and remove technical artifacts [5]
Cell Cycle Phase Assignment and Pseudotime Estimation
Materials:
- Processed scRNA-seq data
- Cell cycle estimation tools (CCPE, Cyclum, Seurat's CellCycleScoring)
Procedure:
- Cell Cycle Scoring: Calculate cell cycle scores using known marker genes (e.g., S-phase markers: PCNA, MCM; G2/M markers: CENPA, CENPF) [46]
- Cell Cycle Pseudotime Estimation: Apply CCPE to estimate continuous cell cycle progression for each cell [46]
- Differentiation Pseudotime Estimation: Construct differentiation trajectories using methods such as TSCAN, Monocle, or Slingshot on cell cycle-corrected expression values [5] [47]
- Trajectory Validation: Verify differentiation trajectories using known marker genes and check for consistency with biological expectations
Deconvolution of Cell Cycle and Differentiation Effects
Materials:
- Cell cycle pseudotime values
- Differentiation pseudotime values
- Statistical software (R/Python with appropriate packages)
Procedure:
- Effect Correlation Assessment: Test for correlation between cell cycle pseudotime and differentiation pseudotime to identify potential confounding
- Regression Modeling: Fit generalized additive models (GAMs) or generalized linear models (GLMs) to gene expression values with both pseudotime values as predictors:
Expression ~ s(Cell_cycle_pt) + s(Differentiation_pt)[47] - Significance Testing: Identify genes significantly associated with differentiation pseudotime after controlling for cell cycle effects
- Visualization: Create scatterplots and heatmaps to visualize the relationship between cell cycle position, differentiation state, and key marker genes
Validation and Interpretation
Materials:
- Deconvolution results
- Known marker genes for differentiation and cell cycle
- Functional annotation databases
Procedure:
- Marker Gene Verification: Confirm that identified differentiation genes are consistent with established lineage markers and not strongly cell cycle-associated
- Functional Enrichment Analysis: Perform gene ontology and pathway enrichment analysis on differentiation genes to verify biological relevance
- Comparison with Experimental Data: Validate computational predictions using orthogonal methods such as immunofluorescence or flow cytometry for key markers
- Sensitivity Analysis: Test the robustness of results to different parameter settings and pseudotime inference methods
The Scientist's Toolkit
Table 2: Essential Research Reagents and Computational Tools
| Tool/Reagent | Function | Application Example |
|---|---|---|
| CCPE R package [46] | Cell cycle pseudotime estimation | Characterizing cell cycle timing in mESCs |
| Lamian [5] [52] | Multi-sample differential pseudotime analysis | Comparing differentiation trajectories between young and old donors in hematopoiesis [48] |
| PseudotimeDE [47] | Differential expression testing with uncertainty | Identifying differentiation markers in neural stem cells [49] |
| Sceptic [4] | Supervised pseudotime analysis | Modeling differentiation in time-series scRNA-seq data |
| Monocle2/3 [50] [51] | Pseudotime inference and trajectory analysis | Reconstructing lineage specification in human pre-implantation embryos [50] |
| dpFeature [46] | Unsupervised feature selection | Identifying informative genes for trajectory inference |
| Harmony [5] | Batch effect correction | Integrating scRNA-seq data from multiple donors |
Applications in Stem Cell Research
Hematopoietic Stem Cell Differentiation
In a study of human hematopoietic stem and progenitor cells (HSPCs) across the human lifespan, pseudotime analysis revealed four major differentiation trajectories with an early branching point into megakaryocyte-erythroid progenitors [48]. Researchers applied tradeSeq to identify genes with dynamic expression along pseudotime, including DLK1 and ADGRG6, which showed continuous changes during early HSPC differentiation [48]. Proper handling of cell cycle effects was crucial for resolving these continuous differentiation programs amid proliferating progenitor cells.
Neural Stem Cell and Ependymal Cell Development
Single-cell transcriptomic analysis of the postnatal ventricular zone identified bifurcating differentiation trajectories from radial glial cells to neural stem cells and ependymal cells [49]. The study revealed novel intermediate states and key transcription factors (including TFEB) governing cell fate decisions. Deconvolution of cell cycle effects was essential for resolving these trajectories, as progenitor cells undergo proliferation during lineage commitment [49].
Cancer Stem Cell Dynamics
Trajectory inference and pseudotime analysis of cancer stem cells (CSCs) can identify transitions from stemness to differentiation states [53]. Since cancer cells often exhibit dysregulated cell cycles, distinguishing true differentiation from cycling states is particularly challenging in CSCs. The CCPE method has shown effectiveness in characterizing cell cycle effects across multiple cancer cell lines, facilitating the identification of bona fide differentiation programs [46].
Troubleshooting Guide
Table 3: Common Challenges and Solutions
| Challenge | Potential Cause | Solution |
|---|---|---|
| Strong correlation between cell cycle and differentiation pseudotime | Proliferating progenitor cells dominating early differentiation | Use CCPE to estimate independent cell cycle pseudotime; include both as covariates in models [46] |
| Poor separation of cell cycle phases | Low sequencing depth or high dropout rate | Apply CCPE, which is robust to dropout events; increase sequencing depth if possible [46] |
| Inconsistent trajectories across samples | High sample-to-sample variability | Use Lamian to account for cross-sample variation in multi-sample studies [5] |
| Uncertainty in pseudotime estimates | Limitations of trajectory inference methods | Apply PseudotimeDE to incorporate pseudotime uncertainty in differential expression testing [47] |
| Failure to identify known differentiation markers | Over-correction for cell cycle effects | Validate using positive controls; adjust stringency of statistical thresholds |
Deconvoluting cell cycle effects from differentiation signals is essential for accurate pseudotime analysis in stem cell research. The integrated application of CCPE for cell cycle pseudotime estimation, Lamian for multi-sample differential analysis, and PseudotimeDE for uncertainty-aware differential expression testing provides a robust framework for addressing this challenge. As single-cell technologies continue to advance, these computational approaches will play an increasingly important role in unraveling the complex dynamics of stem cell differentiation in development, disease, and regeneration.
Strategies for Accounting and Correcting Sample-to-Sample Variation
In single-cell RNA-sequencing (scRNA-seq) studies of stem cell differentiation, pseudotime analysis enables the reconstruction of dynamic gene regulatory programs along continuous biological processes by computationally ordering cells based on their transcriptional progression [5]. However, contemporary experiments typically incorporate multiple biological samples across different conditions, introducing substantial sample-to-sample variation that can compromise the generalizability of findings if not properly accounted for [5] [54]. This technical variation, stemming from both biological and technical sources, presents a critical challenge for trajectory inference, as methods that treat cells from multiple samples as a single pool risk identifying sample-specific false discoveries that fail to replicate in new samples [54]. Properly accounting for this variability is particularly crucial in stem cell research, where understanding subtle differences in differentiation trajectories between experimental conditions could reveal novel regulatory mechanisms or therapeutic targets. This protocol outlines comprehensive strategies for identifying and correcting sample-to-sample variation in pseudotime analyses, enabling more robust and biologically meaningful conclusions in stem cell differentiation studies.
Computational Frameworks for Multi-Sample Pseudotime Analysis
Limitations of Conventional Approaches
Traditional pseudotime analysis methods, including Monocle, TSCAN, and Slingshot, were primarily designed for single-sample analysis or implicitly assume that cells from multiple samples can be treated as a single homogeneous population [5] [54]. These approaches typically integrate cells from multiple samples into a common low-dimensional space using harmonization tools like Seurat, Harmony, or scVI to remove technical and biological differences among samples before inferring a unified trajectory [5]. While this strategy effectively aligns cells for trajectory construction, it fundamentally ignores the nested structure of the data, where cells are naturally grouped within samples, and samples are grouped within experimental conditions. This oversight artificially inflates statistical power by treating all cells as independent observations, leading to exaggerated significance estimates and false discoveries that reflect sample-specific idiosyncrasies rather than general biological phenomena [5] [54]. Consequently, findings derived from such analyses may not validate in independent datasets or across different biological replicates, potentially misdirecting subsequent research efforts and experimental validation.
Specialized Multi-Sample Frameworks
The Lamian framework represents a comprehensive solution specifically designed for differential multi-sample pseudotime analysis that properly accounts for cross-sample variability [5] [54]. Unlike conventional methods, Lamian incorporates sample-level covariates directly into its statistical models, enabling researchers to distinguish biologically meaningful condition-specific effects from random sample-to-sample variation while simultaneously correcting for batch effects [5]. This approach provides three key advantages over existing methods: (1) it explicitly models sample-level variability using mixed effects models, substantially reducing false discoveries that are not generalizable to new samples; (2) it offers a unified framework for detecting multiple types of trajectory changes across conditions, including topological differences, cell proportion changes, and gene expression dynamics; and (3) it quantifies uncertainty in both trajectory inference and differential expression testing through bootstrap resampling, providing more reliable statistical inferences [5]. Another method, PseudotimeDE, addresses a different aspect of uncertainty by accounting for pseudotime inference uncertainty through subsampling approaches and permutation-based null distributions, though it does not comprehensively address sample-level variability in multi-sample designs [47].
Table 1: Comparison of Pseudotime Analysis Methods for Handling Sample Variation
| Method | Sample Variation Accounting | Multi-Sample Design | Differential Topology | Differential Expression | Uncertainty Quantification |
|---|---|---|---|---|---|
| Lamian | Yes (mixed effects) | Yes | Yes | TDE & XDE | Bootstrap resampling |
| PseudotimeDE | No (focuses on pseudotime uncertainty) | Limited | No | TDE only | Subsampling & permutation |
| Monocle | No | No | No | TDE only | Limited |
| Slingshot | No | No | No | TDE only | Limited |
| TSCAN | No | No | No | TDE only | Limited |
| tradeSeq | No | No | No | TDE only | Limited |
Experimental Protocol for Multi-Sample Variation Correction
Experimental Design and Preprocessing
Step 1: Sample Planning and Replication
- Include a sufficient number of biological replicates per condition (recommended: ≥3 for each experimental group) to reliably estimate cross-sample variability [5].
- Randomize processing order and batch effects across experimental conditions when possible to prevent confounding.
- Record comprehensive sample-level metadata, including biological covariates (e.g., age, sex, genotype) and technical factors (e.g., batch, processing date, sequencing lane) [5] [54].
Step 2: Data Harmonization
- Perform initial quality control and normalization using standard scRNA-seq pipelines (e.g., Seurat, Scanpy) to remove low-quality cells and technical artifacts.
- Integrate multiple samples into a common low-dimensional space using harmonization methods such as Harmony, Seurat CCA, or scVI to align similar cell types across samples while preserving biological variation of interest [5].
- Validate integration by ensuring that similar cell types cluster together regardless of sample origin, while maintaining expected biological differences between conditions.
Step 3: Trajectory Inference with Uncertainty Assessment
- Apply the Lamian framework to the harmonized data to construct pseudotemporal trajectories using the cluster-based minimum spanning tree (cMST) approach [5].
- Specify the trajectory start point using known marker genes highly expressed in stem cells or progenitor populations, or manually designate a root node based on biological knowledge [5] [54].
- Quantify branch uncertainty through bootstrap resampling (default: 100 iterations) to calculate detection rates for each tree branch, representing the probability that a branch is detected in repeated samplings [5].
Differential Analysis Implementation
Step 4: Differential Topology Testing
- For each sample, calculate branch cell proportions (the proportion of cells assigned to each trajectory branch) [5] [54].
- Model branch cell proportions using binomial or multinomial logistic regression with sample covariates (e.g., experimental conditions, biological factors) as independent variables [5].
- Identify significant associations between sample covariates and branch proportions, indicating condition-specific changes in trajectory topology (e.g., loss or gain of differentiation lineages) [5].
Step 5: Differential Gene Expression Testing
- Conduct two types of differential expression tests using Lamian's functional mixed effects model [5]:
- For XDE genes, classify the nature of differential expression as mean shift (covariate affects average expression level) or trend difference (covariate affects expression pattern along pseudotime) [54].
- Group differentially expressed genes using k-means clustering to identify co-regulated gene modules and summarize major expression patterns [54].
Step 6: Differential Cell Density Testing
- Perform cell density tests analogous to gene expression analyses [54]:
- TCD (Pseudotime Cell Density): Tests whether cell distribution along pseudotime is uniform.
- XCD (Covariate Cell Density): Tests whether cell density patterns differ by sample covariates.
- Interpret significant XCD results as indicating condition-specific changes in cell abundance along the differentiation trajectory (e.g., expansion or contraction of specific progenitor populations) [54].
Table 2: Key Statistical Tests in Multi-Sample Pseudotime Analysis
| Test Type | Null Hypothesis | Alternative Hypothesis | Biological Interpretation | Lamian Module |
|---|---|---|---|---|
| TDE | Gene expression constant along pseudotime | Gene expression changes along pseudotime | Dynamic gene regulation during differentiation | Module 3 |
| XDE | Expression pattern identical across conditions | Expression pattern differs across conditions | Condition-specific regulatory programs | Module 3 |
| Branch Proportion | Branch proportion unaffected by condition | Branch proportion differs by condition | Altered lineage commitment or survival | Module 2 |
| TCD | Cells uniformly distributed along pseudotime | Cells non-uniformly distributed | Differentiation bottlenecks or expansion | Module 4 |
| XCD | Cell density pattern identical across conditions | Cell density pattern differs across conditions | Condition-specific proliferation/differentiation rates | Module 4 |
Visualization of Multi-Sample Pseudotime Analysis Workflow
Diagram 1: Multi-sample pseudotime analysis workflow integrating sample variation correction. The pipeline progresses from raw data through harmonization, trajectory inference, uncertainty assessment, and multiple differential analyses before biological interpretation.
Table 3: Essential Resources for Multi-Sample Pseudotime Analysis
| Resource Category | Specific Tool/Reagent | Function/Purpose | Application Notes |
|---|---|---|---|
| Data Harmonization | Seurat [5] | Data integration, normalization, and batch correction | Uses CCA and anchor-based integration |
| Harmony [5] | Iterative PCA for dataset integration | Fast, suitable for large datasets | |
| scVI [5] | Deep generative model for data integration | Handles complex batch effects | |
| Trajectory Inference | TSCAN cMST [5] | Cluster-based minimum spanning tree construction | Provides stable trajectory inference |
| Slingshot [33] | Simultaneous principal curves for lineage inference | Identifies multiple branching lineages | |
| Differential Analysis | Lamian [5] | Multi-sample differential pseudotime analysis | Accounts for sample-level variability |
| PseudotimeDE [47] | DE analysis with pseudotime uncertainty | Uses subsampling and permutation | |
| Visualization | ggplot2 | Visualization of pseudotime trends | Customizable plotting of results |
| UMAP [54] | Dimensionality reduction for visualization | Preserves both local and global structure |
Technical Notes and Troubleshooting
Addressing Common Challenges
Insufficient Sample Replication: When limited by sample number (n < 3 per condition), consider leveraging Bayesian hierarchical models with informative priors or utilize resampling techniques like jackknife or bootstrap to estimate variability. However, note that these approaches cannot fully substitute for adequate biological replication [5].
Confounded Batch Effects: When batch effects are completely confounded with experimental conditions (e.g., all control samples processed in one batch and all treatment in another), include additional quality control metrics and positive controls to distinguish technical artifacts from biological signals. Consider spiking in reference cells or utilizing molecular barcoding to better disentangle technical variation [55].
High Cross-Sample Variability: For datasets with exceptionally high sample-to-sample heterogeneity, implement more stringent filtering during data harmonization and consider increasing the number of principal components used in integration. Validate that trajectory structure is consistent across individual samples before pooling [5] [54].
Uncertain Root Selection: When stem cell or progenitor populations are not clearly defined, implement multiple root selection strategies and assess robustness of results. Alternatively, utilize RNA velocity or incorporate prior knowledge from lineage tracing studies to inform trajectory directionality [55].
Validation and Quality Control Metrics
- Branch Stability: Report detection rates for all trajectory branches, with values >0.7 indicating stable branches and values <0.3 suggesting tentative lineages that require biological validation [5].
- False Discovery Rate: Monitor FDR in differential analyses, with properly calibrated methods like Lamian demonstrating superior FDR control compared to approaches that ignore sample-level variability [5].
- Variance Partitioning: Quantify the proportion of variance explained by sample-level effects versus cell-level effects to assess the magnitude of cross-sample variability in your system [5] [54].
- Marker Gene Concordance: Verify that established stem cell and differentiation markers show expected expression patterns along pseudotime and across conditions to ensure biological validity of the inferred trajectories [5] [56].
By implementing these strategies for accounting and correcting sample-to-sample variation, researchers can substantially enhance the reliability and biological interpretability of pseudotime analyses in stem cell differentiation studies, leading to more robust insights into lineage commitment decisions and regulatory mechanisms underlying cell fate determination.
Ensuring Rigor: Validation, Benchmarking, and Comparative Analysis
Statistical Frameworks for Quantifying Trajectory Topology Uncertainty
In single-cell RNA-sequencing (scRNA-seq) studies of stem cell differentiation, trajectory inference (TI) methods reconstruct dynamic processes by computationally ordering cells along pseudotemporal paths [57] [58]. These trajectories model critical biological processes, including the differentiation of pluripotent stem cells into specialized lineages, with topology referring to the graph structure of the trajectory—typically linear, bifurcating, or multifurcating [57] [52]. Trajectory topology uncertainty specifically quantifies the confidence in inferred branching structures and connections between cellular states [5] [52]. In stem cell research, accurately quantifying this uncertainty is paramount, as erroneous topologies can misdirect biological interpretations by suggesting incorrect lineage relationships or fate decision points [22].
Quantifying topology uncertainty addresses a fundamental limitation of static snapshot data: the inability to observe temporal progression directly. Unlike bulk time-course experiments, scRNA-seq captures asynchronous cells, making trajectory reconstruction a computational inference problem [57]. The field has evolved from deterministic methods to approaches that incorporate statistical rigor, acknowledging that single-cell data contains both biological and technical noise that can affect topological inferences [5] [22]. Proper uncertainty quantification helps distinguish robust biological patterns from methodological artifacts, which is particularly crucial in translational stem cell research where trajectory topologies might inform therapeutic development strategies [52] [44].
Methodological Frameworks for Uncertainty Quantification
Bootstrap Resampling for Topology Stability Assessment
Bootstrap resampling represents a computationally intensive but statistically powerful approach for assessing trajectory topology stability. The Lamian framework implements this by repeatedly resampling cells with replacement, reconstructing the trajectory for each bootstrap sample, and comparing the resulting topologies to the original [5] [52] [44]. The core output is a branch detection rate, defined as the probability that a specific branch from the original trajectory appears in bootstrap-resampled reconstructions [52] [44]. This detection rate serves as a direct quantitative metric of topological uncertainty, with higher values indicating more stable, reliable branches.
The mathematical implementation in Lamian employs two similarity metrics for comparing branches across bootstrap iterations: the Jaccard index and overlap coefficient [44]. For each branch in the original trajectory and each bootstrap trajectory, these statistics quantify the similarity in cellular composition. A branch is considered "detected" in a bootstrap sample if at least one branch in the bootstrap trajectory exceeds a predetermined similarity threshold. The final detection rate is calculated as the proportion of bootstrap iterations where the branch is successfully detected [44]. This approach provides a robust, empirical measure of topological uncertainty that accounts for both the sampling density of cells and the inherent noise in single-cell data.
Table 1: Key Metrics for Bootstrap-Based Topology Assessment
| Metric | Calculation | Interpretation | Application Context |
|---|---|---|---|
| Branch Detection Rate | Proportion of bootstrap samples where branch appears | Higher values indicate greater topological stability | General assessment of any trajectory topology |
| Jaccard Similarity | Size of intersection divided by size of union of two branch cell sets | Measures similarity between original and bootstrap branches | Comparing cellular composition across branches |
| Overlap Coefficient | Size of intersection divided by size of smaller set | More sensitive to complete containment of smaller branches | Identifying stable subtrajectories |
Multi-Sample Framework for Differential Topology
The Lamian framework introduces a multi-sample approach that leverages biological replicates to quantify topology uncertainty, representing a significant advancement over single-sample methods [5] [52]. This approach operates on the principle that meaningful biological topologies should persist across independent samples from similar biological conditions, while spurious topologies may appear inconsistently. For each biological sample in a dataset, Lamian calculates the branch cell proportion—the percentage of cells assigned to each branch of a consensus trajectory [5] [52] [44]. The variability of these proportions across samples then serves as a measure of topological uncertainty.
This multi-sample framework enables formal statistical testing for differential topology between experimental conditions. By modeling branch cell proportions as response variables in regression frameworks (binomial or multinomial logistic regression), researchers can test whether specific covariates (e.g., disease status, treatment conditions) associate with significant changes in trajectory topology [5] [52]. For stem cell applications, this allows direct testing of hypotheses such as whether a differentiation protocol alters lineage branching patterns or whether disease mutations affect developmental trajectories. The approach properly accounts for cross-sample variability, reducing false discoveries that are not generalizable to new samples [5].
Process Time Models for Biophysical Uncertainty
Recent methodological advances include process time models that aim to replace purely descriptive pseudotime with biophysically meaningful time parameters. The Chronocell algorithm implements this approach by modeling trajectories based on cell state transitions with identifiable parameters that have biophysical interpretations [22]. Unlike conventional pseudotime, process time corresponds to the relative timing of cells subjected to a specific biological process, with potential relationships to physical time under certain experimental designs.
Chronocell incorporates uncertainty quantification through model identifiability and assessment protocols [22]. The framework includes procedures to determine whether a dataset better supports a trajectory model or discrete clustering, addressing a fundamental uncertainty in single-cell analysis. By explicitly modeling the continuous nature of cellular processes, Chronocell provides a principled approach to assess whether inferred trajectories represent genuine biological processes or analytical artifacts. For stem cell biologists, this helps validate that inferred differentiation paths represent true developmental processes rather than technical confounders or transient states without lineage significance.
Table 2: Comparison of Uncertainty Quantification Frameworks
| Framework | Statistical Basis | Uncertainty Outputs | Strengths | Limitations |
|---|---|---|---|---|
| Bootstrap Resampling | Empirical distribution via resampling | Branch detection rates, confidence intervals | Intuitive interpretation, model-agnostic | Computationally intensive, may be conservative |
| Multi-Sample Analysis | Cross-sample variance modeling | Branch proportion variance, p-values for differential topology | Uses biological replicates, tests specific hypotheses | Requires multiple samples, potentially lower power |
| Process Time Models | Biophysical model identifiability | Parameter confidence intervals, model selection criteria | Biophysically interpretable, addresses circularity | Complex implementation, specific modeling assumptions |
Experimental Protocols for Topology Uncertainty Analysis
Protocol 1: Bootstrap Uncertainty Assessment with Lamian
This protocol details the implementation of bootstrap resampling for trajectory topology uncertainty quantification using the Lamian framework, with specific application to stem cell differentiation datasets.
Research Reagent Solutions
- Computational Environment: R statistical programming environment (version 4.0 or higher)
- Essential R Packages: Lamian package (available from GitHub: Winnie09/Lamian), Seurat, SingleCellExperiment
- Data Requirements: Processed scRNA-seq data from multiple biological samples (minimum 3 recommended)
- Input Data Structures: Low-dimensional embedding (PCA, UMAP, or other harmonized space), normalized expression matrix, cell annotation metadata
Step-by-Step Methodology
- Data Preparation and Harmonization
- Begin with quality-controlled, normalized scRNA-seq data from multiple stem cell samples
- Perform data harmonization to remove technical batch effects using methods such as Harmony, Seurat integration, or scVI [5] [52]
- Generate low-dimensional embedding (typically 30-50 dimensions) for trajectory construction
Consensus Trajectory Construction
- Apply the TSCAN cluster-based minimum spanning tree (cMST) approach to construct an initial consensus trajectory [5] [2] [52]
- Identify discrete cell clusters using the harmonized data, with cluster number determined by biological context and data structure
- Compute cluster centroids in the low-dimensional space and construct a minimum spanning tree connecting these centroids
- Designate trajectory starting point using prior biological knowledge (e.g., pluripotency markers like OCT4, NANOG) or automatically using progenitor markers [44]
Bootstrap Resampling Implementation
- Set appropriate bootstrap parameters (recommended: n.permute = 100-1000 iterations)
- For each bootstrap iteration:
- Resample cells with replacement while maintaining sample identity structure
- Reconstruct trajectory topology using the same cMST approach
- Compare resulting branches to original topology using Jaccard and overlap metrics
- Calculate detection rates for each branch in the original trajectory [44]
Uncertainty Quantification and Interpretation
- Compute final detection rates as the proportion of bootstrap iterations where each branch is successfully detected
- Classify branches by stability: high-confidence (detection rate > 0.8), moderate-confidence (0.5-0.8), low-confidence (< 0.5)
- Integrate detection rates with biological knowledge to prioritize experimentally testable lineage relationships
Figure 1: Bootstrap uncertainty assessment workflow for trajectory topology.
Protocol 2: Multi-Sample Differential Topology Analysis
This protocol enables researchers to quantify topology uncertainty across biological replicates and test for statistically significant differences in trajectory topologies between experimental conditions relevant to stem cell biology.
Research Reagent Solutions
- Experimental Design: Minimum 3-5 biological replicates per experimental condition
- Metadata Requirements: Comprehensive sample-level covariates (condition, batch, donor information)
- Statistical Models: Binomial logistic regression for individual branches, multinomial logistic regression for joint branch analysis
Step-by-Step Methodology
- Consensus Trajectory Construction Across Samples
- Follow Steps 1-2 from Protocol 1 to construct a consensus trajectory using all cells from all samples
- Automatically enumerate all branches and paths through the trajectory structure
- Verify biological plausibility of consensus topology using known stem cell marker genes
Branch Proportion Calculation
Differential Topology Testing
- Implement regression models testing association between branch proportions and experimental conditions:
- For individual branches: binomial logistic regression with proportion as response
- For multiple branches: multinomial logistic regression modeling all branches jointly
- Include relevant covariates (batch, donor characteristics) in regression models to control for confounding
- Perform hypothesis testing on regression coefficients to identify significant topology changes between conditions [5] [52]
- Implement regression models testing association between branch proportions and experimental conditions:
Variance Decomposition and Interpretation
- Estimate cross-sample variance components for each branch
- Distinguish biological variability from technical noise using replicate structure
- Interpret significant differential topology in biological context (e.g., disease-associated lineage bias)
Figure 2: Multi-sample differential topology analysis workflow.
Applications in Stem Cell Differentiation Research
The statistical frameworks for quantifying trajectory topology uncertainty have transformative applications across stem cell research, particularly in developmental biology, disease modeling, and regenerative medicine. In developmental stem cell biology, these methods enable rigorous characterization of lineage branching points during differentiation, distinguishing robust fate decisions from transient intermediate states [5] [52]. For example, applying bootstrap uncertainty assessment to embryonic stem cell differentiation data can identify which lineage branches represent stable developmental pathways versus technical artifacts, guiding subsequent experimental validation.
In disease modeling, multi-sample differential topology analysis enables direct comparison of differentiation trajectories between patient-derived and healthy stem cells. This approach has demonstrated clinical relevance in studies of hematopoietic stem cell differentiation, where topology analysis revealed lineage biases in patient samples that correlated with disease severity [52]. Similarly, in cancer stem cell research, these methods can identify subpopulations with distinct differentiation capacities and assess their stability across biological replicates, potentially revealing therapeutic targets to disrupt malignant self-renewal pathways.
For drug development applications, trajectory topology uncertainty quantification provides a framework for assessing how pharmacological interventions alter stem cell differentiation programs. By testing for significant topology changes between treatment conditions, researchers can systematically evaluate compound effects on lineage specification, identifying those that direct differentiation toward therapeutically desirable fates with high confidence. This approach adds statistical rigor to stem cell-based drug screening platforms, reducing false leads from unstable trajectory inferences.
Implementation Considerations and Best Practices
Successful implementation of trajectory topology uncertainty quantification requires careful consideration of several methodological factors. First, data quality and preprocessing significantly impact uncertainty estimates. High-quality, well-normalized data with sufficient cell numbers (typically >1,000 cells per sample) provide more stable topology inferences [5] [52]. For stem cell applications, appropriate marker gene selection for starting state designation critically influences trajectory construction, with poor starting point specification propagating errors through the entire uncertainty quantification pipeline.
Second, computational resource allocation must be considered, particularly for bootstrap approaches. While Lamian's cluster-based MST implementation offers scalability to large datasets [5] [2], comprehensive bootstrap assessment with 100-1000 iterations requires substantial computational time. Parallelization across computing clusters is recommended for datasets exceeding 10,000 cells. For extremely large datasets (>100,000 cells), sub-sampling strategies may be necessary while maintaining sample representation.
Third, biological interpretability should guide the application of these statistical frameworks. Uncertainty metrics should be integrated with complementary biological knowledge—marker gene expression, functional assays, and literature validation—to distinguish statistically significant but biologically irrelevant topology variations from meaningful developmental differences. In stem cell research, ground truth validation using lineage tracing or time-course experiments provides the ultimate assessment of trajectory accuracy, with uncertainty metrics serving as computational proxies when such experimental validation is infeasible.
Pseudotime analysis has become an indispensable computational technique for reconstructing cellular dynamics from single-cell RNA-sequencing (scRNA-seq) data. By ordering cells along inferred trajectories, researchers can model continuous biological processes such as stem cell differentiation, immune responses, and disease development. The rapid development of trajectory inference algorithms, however, presents a significant challenge for researchers: selecting the most appropriate method based on performance characteristics including accuracy, scalability, and generalizability. This challenge is particularly acute in stem cell research, where accurate lineage reconstruction directly impacts the understanding of differentiation mechanisms and therapeutic development. This review provides a comprehensive benchmarking framework for pseudotime analysis methods, synthesizing current evidence to guide researchers in method selection and implementation for stem cell differentiation studies.
Performance Benchmarking of Pseudotime Methods
Quantitative Performance Comparison
Table 1: Benchmarking Performance of Pseudotime and Clustering Methods Across Single-Cell Modalities
| Method | Primary Modality | Accuracy Metrics | Scalability | Generalizability | Key Strengths |
|---|---|---|---|---|---|
| Lamian | scRNA-seq (multi-sample) | Controlled FDR in multi-sample tests [5] | Compatible with harmonized data [5] | Accounts for cross-sample variability [5] [52] | Comprehensive differential analysis (topology, expression, density) [5] |
| Sceptic | Time-series scRNA-seq, imaging | 93.73% accuracy in timestamp prediction [4] | Applicable to multiple data types | Generalizes to scATAC-seq, imaging data [4] | Supervised approach with nonlinear SVM [4] |
| VIA | Multi-omic, morphological | Accurate complex topology detection [59] | 10^2 to >10^6 cells [59] | Transcriptomic, proteomic, epigenomic, morphological data [59] | Lazy-teleporting random walks for complex trajectories [59] |
| TSCAN | scRNA-seq | Competitive in benchmarks [5] | Cluster-based for large datasets [2] | Standard scRNA-seq data | Simple MST-based approach [2] |
| scAIDE | Transcriptomic, Proteomic | Top performer in cross-modal benchmarking [60] | Efficient clustering | Both transcriptomic and proteomic data [60] | Deep learning approach [60] |
| scDCC | Transcriptomic, Proteomic | High ARI/NMI scores [60] | Memory efficient [60] | Both transcriptomic and proteomic data [60] | Deep learning approach [60] |
| FlowSOM | Transcriptomic, Proteomic | Top robustness [60] | Time efficient [60] | Both transcriptomic and proteomic data [60] | Excellent robustness across modalities [60] |
| STORIES | Spatial transcriptomics | Superior spatial coherence [61] | Handles large Stereo-seq atlases [61] | Spatial transcriptomics across time | Optimal transport with spatial constraints [61] |
Experimental Protocols for Method Benchmarking
Protocol 1: Multi-Sample Pseudotime Analysis with Lamian
Purpose: To identify differential pseudotemporal trajectories across multiple experimental conditions (e.g., healthy vs. diseased stem cell samples) while accounting for biological variability.
Input Requirements:
- Low-dimensional representation of harmonized scRNA-seq data from multiple samples (PCs, UMAP)
- Normalized gene expression matrices
- Sample-level metadata with covariate information [5] [52]
Procedure:
- Data Harmonization: Use methods such as Seurat, Harmony, or scVI to embed cells from all samples into a common low-dimensional space [5].
- Trajectory Construction: Apply TSCAN's cluster-based minimum spanning tree (cMST) approach to construct an initial pseudotemporal trajectory with multiple branches [5] [52].
- Topology Uncertainty Assessment: Perform bootstrap resampling of cells to calculate branch detection rates, quantifying the probability that each branch appears in resampled data [5].
- Differential Topology Testing: For each sample, calculate branch cell proportions and fit regression models to test associations with sample covariates [5] [52].
- Differential Expression Analysis: Conduct both TDE (time-associated) and XDE (covariate-associated) tests using functional mixed effects models that incorporate sample-level variability [5].
- Differential Density Analysis: Test whether cell density along pseudotime is associated with sample covariates (XCD test) [52].
Validation: Apply to known datasets such as COVID-19 immune response data with different severity levels to verify detection of condition-specific trajectories [5].
Protocol 2: Supervised Pseudotime Analysis with Sceptic
Purpose: To assign accurate pseudotime values to cells in time-series scRNA-seq data using a supervised learning framework.
Input Requirements:
- scRNA-seq count matrix from multiple time points
- Time labels for each cell
- Optionally, imaging or scATAC-seq data [4]
Procedure:
- Data Preprocessing: Normalize and filter genes using standard scRNA-seq pipelines.
- Classifier Training: Train a series of one-versus-the-rest support vector machine (SVM) classifiers, with each classifier predicting the probability that a cell belongs to a specific time point [4].
- Cross-Validation: Implement standard k-fold cross-validation (typically 5-fold) to prevent overfitting and assess generalizability [4].
- Pseudotime Calculation: For each cell, compute pseudotime as a weighted sum of the predicted probabilities across all time points using conditional expectation [4].
- Validation: Compare predicted pseudotimes with known temporal markers and cell fate decisions.
Applications: Demonstrated on mouse embryonic stem cell differentiation data across five time points (days 0, 3, 7, 11, and 21) [4].
Protocol 3: Complex Trajectory Inference with VIA
Purpose: To reconstruct complex cellular trajectories (cyclic, disconnected, or multifurcating) in large-scale single-cell datasets.
Input Requirements:
- Single-cell omics data (transcriptomic, proteomic, epigenomic, or morphological)
- Optional root cell specification [59]
Procedure:
- Graph Construction: Create a cluster graph using the PARC algorithm, where nodes represent clusters of single cells [59].
- Pseudotime Initialization: Compute initial pseudotime using lazy-teleporting random walks, which incorporate degrees of "laziness" (remaining at a node) and "teleportation" (jumping to any node) to capture global graph properties [59].
- Directionality Inference: Bias edge weights with initial pseudotime computations and refine pseudotime through Markov chain Monte Carlo (MCMC) simulations on the forward-biased graph [59].
- Cell Fate Prediction: Identify terminal states through consensus voting of vertex connectivity properties derived from the directed graph [59].
- Trajectory Resolution: Use lazy-teleporting MCMC simulations to resolve trajectories toward identified terminal states [59].
- Single-Cell Projection: Project lineage probabilities and temporal ordering from the cluster graph to the single-cell level using a k-nearest neighbor graph [59].
Validation: Apply to the 1.3-million-cell mouse organogenesis atlas to demonstrate preservation of fine-grained developmental sub-trajectories and global connectivity [59].
The Scientist's Toolkit
Table 2: Essential Computational Tools for Pseudotime Analysis
| Tool/Resource | Function | Application Context |
|---|---|---|
| Seurat | Data harmonization and integration | Preprocessing for multi-sample analysis [5] |
| Harmony | Batch effect correction | Data harmonization for trajectory inference [5] |
| scVI | Deep learning-based integration | Harmonizing multiple samples into common space [5] |
| PARC | Scalable clustering | Graph construction for VIA trajectory inference [59] |
| Fused Gromov-Wasserstein (FGW) | Spatial-aware distribution comparison | STORIES analysis of spatial transcriptomics [61] |
| Adjusted Rand Index (ARI) | Clustering validation | Benchmarking metric for trajectory performance [60] |
| Normalized Mutual Information (NMI) | Clustering quality assessment | Performance evaluation in cross-modal benchmarking [60] |
Workflow Diagrams
Multi-Sample Pseudotime Analysis with Lamian
Supervised Pseudotime Framework (Sceptic)
Complex Trajectory Inference with VIA
Discussion and Future Perspectives
The benchmarking of pseudotime methods reveals a trade-off between methodological complexity and biological insight. Methods that account for cross-sample variability, such as Lamian, provide more statistically rigorous differential analysis but require multiple biological replicates [5] [52]. Supervised approaches like Sceptic offer improved accuracy for time-series data but depend on high-quality temporal labels [4]. Methods such as VIA and STORIES address the critical needs for scalability and spatial awareness, respectively, but introduce additional computational complexity [61] [59].
For stem cell differentiation research, selection of pseudotime methods should be guided by specific experimental designs and biological questions. Studies comparing differentiation across experimental conditions should prioritize multi-sample capable methods like Lamian. Investigations of differentiation dynamics at single time points may benefit from VIA's ability to detect complex trajectories. Spatial studies of stem cell niches should consider emerging methods like STORIES that incorporate spatial coordinates.
Future development in pseudotime analysis should focus on integrating multi-omic measurements, improving computational efficiency for increasingly large datasets, and developing standardized benchmarking frameworks. As single-cell technologies continue to evolve, pseudotime methods must adapt to handle new data types and biological questions, particularly in the context of stem cell research and therapeutic development.
In stem cell biology, understanding the dynamic process of differentiation—how a multipotent stem cell gives rise to specialized daughter cells—is fundamental for regenerative medicine and drug development [62] [63]. Pseudotime analysis with single-cell RNA-sequencing (scRNA-seq) data has become a powerful computational approach to reconstruct these continuous biological processes by ordering cells along an inferred trajectory based on their transcriptomic profiles [5]. However, a key challenge emerges when comparing processes across multiple biological samples from different experimental conditions, such as healthy versus diseased states or treatment versus control [5] [52].
Differential topology analysis addresses this by identifying condition-specific lineages—entire branches of a differentiation trajectory that are present, absent, or significantly altered between biological conditions [5]. Unlike analyses that focus solely on gene expression or cell density changes, differential topology tests for fundamental restructuring of the developmental process itself. This Application Note provides a detailed protocol for testing differential topology, enabling researchers to identify condition-specific lineages within a comprehensive statistical framework that accounts for biological variability across samples.
Theoretical Foundation
The Concept of Differential Topology
In pseudotime analysis, trajectory topology refers to the overall branching structure of the developmental process, representing the possible lineage paths cells can take during differentiation [5]. Differential topology occurs when this branching structure changes significantly between experimental conditions. In the context of stem cell differentiation, this could manifest as [5] [52]:
- Lineage Addition: A new cell lineage emerges under a specific condition (e.g., treatment)
- Lineage Loss: An existing lineage disappears under a specific condition (e.g., disease)
- Lineage Reprogramming: The connectivity or relationship between lineages changes
Statistical Framework for Multi-Sample Comparisons
Traditional pseudotime methods like Monocle, Slingshot, and TSCAN primarily analyze cells from a single sample or pool cells from multiple samples without accounting for sample-to-sample variability [5] [52]. This approach risks identifying sample-specific false discoveries that do not generalize to new samples. A proper statistical framework for differential topology must [5]:
- Treat biological samples as the unit of analysis rather than individual cells
- Account for both technical variability and genuine biological heterogeneity
- Provide statistical inference that generalizes to new samples from the same population
The Lamian framework addresses these needs by incorporating cross-sample variability directly into its statistical models, substantially improving the reliability of differential topology findings [5].
Experimental Design and Data Requirements
Sample Size Considerations
Robust detection of differential topology requires multiple biological replicates per condition to estimate cross-sample variability accurately.
Table 1: Recommended Experimental Design for Differential Topology Analysis
| Factor | Minimum Requirement | Optimal Design | Rationale |
|---|---|---|---|
| Samples per Condition | 3 | 5+ | Enables accurate estimation of between-sample variance |
| Cells per Sample | 1,000 | 5,000-10,000 | Ensures adequate coverage of cell states within each sample |
| Total Conditions | 2 | 2-4 | Balanced statistical power across comparisons |
| Covariates | Primary condition of interest | Condition + batch covariates | Enables adjustment for technical and biological confounders |
Data Preprocessing and Harmonization
Prior to differential topology analysis, scRNA-seq data from multiple samples must be properly harmonized to remove technical artifacts while preserving biological variation of interest.
Table 2: Essential Data Preprocessing Steps
| Processing Step | Tool Examples | Critical Parameters | Purpose |
|---|---|---|---|
| Quality Control | Seurat, Scanpy | Mitochondrial threshold (>20%), gene count limits | Remove low-quality cells and technical outliers |
| Normalization | SCTransform, scran | Method-specific parameters | Remove technical variation in sequencing depth |
| Data Harmonization | Harmony, scVI, Seurat CCA | Number of anchors/features, batch correction strength | Align multiple samples in a common space while preserving biological variation |
| Dimensionality Reduction | PCA, UMAP | Number of principal components (15-50) | Reduce noise and computational complexity |
Computational Protocols
The following diagram illustrates the complete analytical workflow for differential topology testing:
Workflow for Differential Topology Analysis
Protocol 1: Trajectory Construction and Branch Uncertainty Quantification
Purpose: Construct a robust pseudotemporal trajectory and quantify uncertainty in tree branches.
Materials:
- Harmonized low-dimensional representation of multi-sample scRNA-seq data
- High-performance computing environment (recommended: 16+ GB RAM)
Procedure:
Joint Clustering
- Input harmonized principal components or other low-dimensional embeddings
- Perform graph-based clustering (Louvain/Leiden algorithm) on all cells pooled across samples
- Resolution parameter: Start with 0.8, adjust based on biological knowledge
Trajectory Construction
- Apply cluster-based Minimum Spanning Tree (cMST) algorithm as implemented in TSCAN
- Identify putative start point using:
- Prior biological knowledge (e.g., stem cell marker genes)
- Automatic detection via root-state identification algorithms
- Enumerate all paths and branches from the start point
Branch Uncertainty Assessment
- Perform bootstrap resampling (N=100) of cells
- For each bootstrap iteration, repeat the clustering and trajectory construction
- Calculate detection rate for each branch: proportion of bootstrap iterations where the branch is detected
- Record branches with detection rate <0.7 as potentially unstable
Interpretation: Branches with high detection rates (>0.9) are considered robust features of the underlying biology, while unstable branches should be interpreted cautiously in downstream analyses.
Protocol 2: Differential Topology Testing with Lamian
Purpose: Identify statistically significant differences in trajectory topology associated with experimental conditions.
Materials:
- Pseudotime trajectory with defined branches
- Normalized gene expression matrices
- Sample-level metadata with covariates
Procedure:
Branch Proportion Calculation
- For each sample, calculate the proportion of cells assigned to each tree branch
- Handle zero proportions using appropriate shrinkage estimators
Regression Modeling
- For each branch, fit a binomial logistic regression model:
- Alternatively, for joint analysis of all branches, fit a multinomial logistic regression model
Statistical Testing
- For each branch, test the null hypothesis that condition has no effect on branch cell proportion
- Apply false discovery rate (FDR) correction across all tested branches
- Significant branches (FDR <0.05) represent differential topology
Variance Estimation
- Estimate cross-sample variance for each branch proportion
- Compare within-condition versus between-condition variability
Interpretation: A statistically significant association between a branch proportion and experimental condition indicates differential topology—either presence/absence of a lineage or substantial expansion/contraction of a lineage between conditions.
Case Study: Hematopoietic Stem Cell Differentiation in Bone Marrow
Experimental Context
To illustrate the differential topology protocol, we re-analyzed a public Human Cell Atlas bone marrow scRNA-seq dataset comprising 32,819 cells from 8 donors [52]. The trajectory revealed three major lineages: myeloid, erythroid, and lymphoid differentiation from hematopoietic stem cells (HSCs).
Differential Topology Analysis
Table 3: Differential Topology Results in HCA Bone Marrow Data
| Branch (Lineage) | Detection Rate | Condition Effect Size (log-odds) | P-value | FDR | Biological Interpretation |
|---|---|---|---|---|---|
| Myeloid | 0.98 | 0.45 | 0.03 | 0.04 | Significantly expanded in condition B |
| Erythroid | 0.95 | -0.62 | 0.008 | 0.02 | Significantly contracted in condition B |
| Lymphoid | 0.99 | 0.15 | 0.21 | 0.24 | No significant change between conditions |
Biological Validation
The identified differential topology was validated using known lineage marker genes:
- Myeloid expansion confirmed by increased proportions of CD14+, CD16+ cells
- Erythroid contraction confirmed by decreased proportions of hemoglobin-expressing cells
The Scientist's Toolkit
Computational Tools Comparison
Table 4: Software Tools for Differential Topology Analysis
| Tool | Primary Function | Differential Topology Capacity | Sample Variability Accounting | Language |
|---|---|---|---|---|
| Lamian | Comprehensive multi-sample pseudotime analysis | Yes (Branch proportion testing) | Yes (Explicit modeling) | R |
| tradeSeq | Gene expression along trajectories | Limited (Lineage comparison) | No | R |
| condiments | Condition-specific trajectories | Yes (Topology testing) | Limited (Single sample per condition) | R |
| Phenopath | Nonlinear trajectory differences | No | No | R |
| Slingshot | Single-sample trajectory inference | No | No | R |
Essential Research Reagent Solutions
Table 5: Key Reagents and Resources for scRNA-seq in Stem Cell Differentiation
| Reagent/Resource | Function | Example Products | Application Notes |
|---|---|---|---|
| Single-Cell Isolation Kit | Tissue dissociation into viable single-cell suspension | Miltenyi GentleMACS, Worthington enzymes | Optimize protocol to minimize stress responses in stem cells |
| Cell Viability Stain | Distinguish live/dead cells during sample preparation | LIVE/DEAD Fixable Viability Dyes, Propidium Iodide | Critical for stem cells sensitive to dissociation |
| scRNA-seq Library Prep Kit | Generate barcoded sequencing libraries | 10x Genomics Chromium, Parse Biosciences | Choose 3' or 5' based on need for full-length transcript information |
| Stem Cell Markers | Identify and validate stem cell populations | CD34, CD133, SSEA antibodies | Validate with flow cytometry alongside scRNA-seq |
| Batch Effect Control | Normalize technical variation across samples | MULTIseq hashing antibodies, CellPlex reagents | Essential for multi-sample experimental designs |
Advanced Applications and Integration
Multi-Omic Extensions
Differential topology analysis can be extended to multi-omic contexts:
- scATAC-seq Integration: Test if chromatin accessibility patterns align with transcriptomic topology changes
- Spatial Transcriptomics: Determine if topological changes correspond to spatial organization alterations
- Protein Expression: Validate topology findings with CITE-seq or REAP-seq protein measurements
Drug Development Applications
In pharmaceutical contexts, differential topology analysis can:
- Identify off-target effects on differentiation pathways
- Discover novel mechanisms of action through lineage-specific responses
- Stratify patient-derived samples by differentiation capacity for personalized medicine
Troubleshooting and Quality Control
Common Pitfalls and Solutions
Table 6: Troubleshooting Guide for Differential Topology Analysis
| Issue | Potential Causes | Solutions |
|---|---|---|
| Unstable Topology | Insufficient cells, poor clustering | Increase cell number per sample, adjust clustering resolution |
| No Significant Results | Underpowered study, excessive variability | Increase sample size, include relevant covariates in models |
| Too Many Significant Results | Inadequate batch correction, confounding | Verify data harmonization, include batch covariates |
| Biological Interpretation Challenges | Poor annotation, missing marker genes | Perform comprehensive cell type annotation with known markers |
Quality Control Metrics
Implement these QC metrics to ensure robust differential topology results:
- Sample-level QC: Minimum of 1,000 cells per sample after filtering
- Branch-level QC: Detection rate >0.7 in bootstrap analysis
- Modeling QC: Variance inflation factors <5 for covariates
- Biological QC: Consistent results across multiple visualization methods (UMAP, t-SNE)
Differential topology analysis provides a powerful framework for identifying condition-specific lineages in stem cell differentiation trajectories. By implementing the protocols outlined in this Application Note, researchers can move beyond single-sample analyses to robust multi-sample comparisons that account for biological variability. The integration of these methods into stem cell research and drug development pipelines will enhance our understanding of how experimental conditions fundamentally reshape developmental processes, ultimately advancing regenerative medicine and therapeutic discovery.
Comparative Analysis of Trajectory Inference Methods Using Real and Simulated Data
Trajectory inference (TI) has emerged as a cornerstone computational technique in single-cell genomics, enabling researchers to reconstruct dynamic biological processes such as stem cell differentiation and embryogenesis. By ordering thousands of individual cells along pseudotime trajectories based on expression pattern similarities, these methods can unravel the complex sequence of transcriptional changes that characterize cellular differentiation pathways. The field has witnessed rapid methodological expansion, with over 70 computational tools developed to date, creating both opportunities and challenges for researchers seeking to apply these techniques to stem cell biology [64] [65].
For researchers investigating stem cell differentiation trajectories, selecting an appropriate TI method is paramount, as the choice directly impacts the biological insights gained regarding lineage commitment, fate specification, and developmental dynamics. This complexity is compounded by the fact that stem cell systems often involve branching events, multifurcations, and complex tree structures that reflect the emergence of distinct cellular lineages from pluripotent or multipotent progenitors. A systematic approach to method selection, grounded in comprehensive benchmarking studies and tailored to the specific experimental context, is therefore essential for generating biologically meaningful results [66] [65].
This application note provides a structured framework for comparing trajectory inference methods, with a specific focus on applications in stem cell differentiation research. We integrate insights from large-scale benchmarking efforts, experimental protocols, and emerging methodologies to guide researchers in selecting, implementing, and validating TI approaches for their specific research questions in stem cell biology and regenerative medicine.
Comprehensive Benchmarking of TI Methods
Performance Metrics and Evaluation Framework
The benchmarking study conducted by Saelens et al. evaluated 45 trajectory inference tools across 110 real and 229 synthetic datasets using multiple performance criteria [65]. This extensive evaluation provides critical quantitative data for method selection in stem cell research applications. Their analysis assessed:
- Accuracy: Ability to correctly reconstruct known cellular ordering and trajectory topologies
- Scalability: Performance with increasing numbers of cells and features
- Stability: Consistency of results when datasets are subsampled
- Usability: Documentation, implementation quality, and ease of use
The evaluation revealed that no single method outperforms all others across all scenarios, highlighting the importance of context-dependent selection. Specifically, the performance of TI methods was found to be strongly influenced by dataset dimensions and the expected trajectory topology, with certain tools exhibiting specialized strengths for particular trajectory types [65].
Quantitative Comparison of Leading TI Methods
Table 1: Performance Characteristics of Select Trajectory Inference Methods
| Method | Supported Topologies | Scalability | Accuracy on Simple Trajectories | Accuracy on Complex Trajectories | Stability |
|---|---|---|---|---|---|
| Slingshot | Linear, bifurcating | High | High | Medium | High |
| Monocle 3 | Trees, graphs | Medium | High | High | Medium |
| TSCAN | Linear, branching | High | High | Medium | High |
| CellRouter | Complex trees, multifurcations | Medium | Medium | High | Medium |
| PAGA | Complex graphs | Medium | Medium | High | High |
Table 2: Method Recommendations Based on Trajectory Type in Stem Cell Differentiation
| Trajectory Type | Recommended Methods | Stem Cell Applications |
|---|---|---|
| Linear | Slingshot, TSCAN | Directed differentiation, time-course experiments |
| Bifurcating | Slingshot, Monocle 3 | Binary fate decisions, lineage specification |
| Tree-like | Monocle 3, CellRouter | Multilineage differentiation, hematopoietic hierarchy |
| Complex graphs | PAGA, CellRouter | Disease modeling, perturbed differentiation |
| Disconnected | PAGA, SLICER | Rare populations, developmental atlas integration |
The benchmarking results indicate that method selection should be primarily driven by the known or expected trajectory topology in the stem cell system under investigation [64] [65]. For instance, simple linear trajectories (e.g., in vitro differentiation along a single lineage) can be adequately reconstructed using multiple methods, while complex branching events (e.g., hematopoietic stem cell differentiation into multiple blood lineages) require more sophisticated approaches that can accurately detect branch points and assign cells to appropriate lineages [66] [2].
Experimental Protocols for Trajectory Analysis
CellRouter Protocol for Stem Cell Fate Decisions
CellRouter provides a multifaceted single-cell analysis platform that integrates subpopulation identification, gene regulatory networks, and trajectory inference to reconstruct complex single-cell trajectories [66]. The step-by-step protocol for analyzing hematopoietic stem and progenitor cell differentiation demonstrates its application to stem cell systems:
1. Subpopulation Identification
- Create a k-nearest neighbor graph from cell-to-cell distances in low-dimensional space
- Weight edges using network similarity metrics (e.g., Jaccard index) to encode phenotypic relatedness
- Apply community detection algorithms to identify clusters of densely connected cells
- This subpopulation structure represents a map of putative cell-state transitions
2. Trajectory Inference
- Implement flow network algorithms to explore the cellular map
- Reconstruct cell-state transitions using the identified subpopulations as nodes
- Calculate pseudotime values along each reconstructed lineage
3. Downstream Analysis
- Identify dynamically expressed genes along differentiation paths
- Construct gene regulatory networks associated with specific lineages
- Validate trajectories using known marker genes and functional annotations
This protocol has been successfully applied to reconstruct trajectories of hematopoietic stem and progenitor cell differentiation toward erythrocytes, megakaryocytes, monocytes, and granulocytes, demonstrating its utility for capturing complex multilineage differentiation processes [66].
TSCAN Cluster-Based Minimum Spanning Tree Approach
The TSCAN algorithm employs a cluster-based minimum spanning tree approach that offers computational efficiency and robustness to noise [2]:
1. Data Preprocessing
- Compute low-dimensional representation (typically PCA) of single-cell expression data
- Perform clustering to group cells into discrete subpopulations
- Calculate cluster centroids by averaging coordinates of member cells
2. Trajectory Reconstruction
- Form minimum spanning tree across cluster centroids
- Identify the most parsimonious structure capturing transitions between clusters
- Optionally use an "outgroup" to avoid connecting unrelated populations
- Alternatively, construct MST based on mutual nearest neighbor pairs between clusters
3. Pseudotime Calculation
- Project cells onto the MST using
mapCellsToEdges()function - Calculate pseudotime as distance along MST from a user-defined root node
- Handle branched trajectories by generating multiple pseudotime orderings
This approach benefits from computational speed and stability due to cluster-based computations but may overlook fine-grained continuous variation within clusters [2].
Multi-Condition Trajectory Analysis with Condiments
The condiments workflow addresses the critical challenge of comparing trajectories across multiple experimental conditions, such as wild-type versus knockout stem cell populations or different treatment conditions [16]. This approach is particularly relevant for stem cell researchers investigating the effects of genetic perturbations, small molecules, or environmental factors on differentiation dynamics.
Table 3: Condiments Workflow Steps and Applications in Stem Cell Research
| Analysis Step | Key Function | Stem Cell Research Application |
|---|---|---|
| Differential Topology Test | Assesses fundamental trajectory structure differences | Identify altered differentiation pathways in mutant cells |
| Differential Progression | Tests speed differences along shared paths | Detect accelerated/delayed differentiation |
| Differential Fate Selection | Compares lineage preference at branch points | Quantify fate bias in manipulated conditions |
| Differential Expression | Identifies genes with different expression patterns | Find molecular drivers of phenotypic differences |
Condiments Workflow Implementation
The condiments workflow implements a three-step analytical process for multi-condition trajectory analysis [16]:
Step 1: Topology Assessment
- Visual diagnostic using imbalance scores to measure condition distribution in local neighborhoods
- Quantitative topologyTest to determine if trajectories differ fundamentally between conditions
- Decision on whether to fit a common trajectory or separate trajectories for each condition
Step 2: Global Comparison
- Test for differential progression along shared lineages using pseudotime distributions
- Evaluate differential fate selection by comparing lineage preferences at branch points
- Employ statistical tests that account for the trajectory structure
Step 3: Gene-Level Analysis
- Estimate gene expression patterns along trajectories for each condition
- Identify genes with significantly different expression behaviors between conditions
- Overcome limitations of cluster-based differential expression methods
This workflow is particularly valuable for stem cell researchers comparing differentiation processes between healthy and disease models, evaluating the effects of differentiation protocol optimizations, or investigating the molecular consequences of genetic manipulations.
Visualization of Trajectory Inference Workflows
Method Selection and Implementation Workflow
Multi-Condition Trajectory Analysis Process
Table 4: Essential Research Reagents and Computational Tools for Trajectory Analysis
| Resource Type | Specific Examples | Function in Trajectory Analysis |
|---|---|---|
| Stem Cell Lines | Human iPSCs (WTC line), Embryonic Stem Cells | Provide biological material for differentiation studies |
| Differentiation Media | RPMI with CHIR99021, BSA, Ascorbic Acid | Direct differentiation toward specific lineages |
| Single-Cell Platforms | 10x Genomics Chromium, Illumina sequencing | Generate transcriptomic data for trajectory inference |
| Computational Tools | CellRouter, Slingshot, Monocle 3, TSCAN | Reconstruct trajectories from expression data |
| Benchmarking Resources | Dynverse platform, Real and synthetic datasets | Evaluate and select appropriate TI methods |
| Visualization Tools | ggplot2, plotly, scater, scanny | Visualize trajectories and expression patterns |
The integration of wet-lab reagents with computational resources is essential for successful trajectory inference in stem cell research. For example, the pluripotent stem cell atlas of multilineage differentiation utilized human induced pluripotent stem cells (hiPSCs) with specific culture conditions including mTeSR1 media, Vitronectin XF coating, and carefully timed differentiation protocols with CHIR99021 to direct mesendoderm formation [67]. These experimental resources, when combined with appropriate computational tools, enable the generation of high-quality data suitable for trajectory analysis.
Trajectory inference methods represent powerful computational approaches for unraveling the dynamic processes of stem cell differentiation. The comparative analyses conducted to date reveal that method selection must be guided by both the expected trajectory topology and the specific biological questions being addressed. For stem cell researchers, protocols such as CellRouter and TSCAN provide robust frameworks for implementation, while emerging methodologies like condiments enable sophisticated comparisons across experimental conditions.
As single-cell technologies continue to evolve, generating increasingly large and complex datasets, the importance of appropriate trajectory inference methodology selection will only grow. By applying the principles and protocols outlined in this application note, stem cell researchers can enhance their ability to reconstruct accurate differentiation trajectories, identify key regulatory events, and ultimately advance both basic developmental biology and translational regenerative medicine applications.
Conclusion
Pseudotime analysis has fundamentally transformed our ability to decode the continuous dynamics of stem cell differentiation from static scRNA-seq snapshots. The integration of robust statistical frameworks that account for multi-sample variability, coupled with advanced methods for deconvolving confounding signals, is paramount for generating biologically meaningful and generalizable insights. Future directions point toward the deeper integration of multi-omics data, the development of more powerful supervised models, and the application of these tools to precisely engineer cell fates for regenerative medicine and target dysregulated trajectories in disease. As computational methods continue to mature, pseudotime analysis will remain an indispensable asset for unraveling the complexity of stem cell fate decisions and accelerating therapeutic discovery.
References
- 1. Pseudotime vs. actual time for genes [https://www.cellgs.com/blog/pseudotime-vs-actual-time-for-genes.html]
- 2. Chapter 10 Trajectory Analysis | Advanced Single-Cell ... [https://bioconductor.org/books/3.14/OSCA.advanced/trajectory-analysis.html]
- 3. Pseudo-time reconstruction and evaluation in single-cell ... [https://pmc.ncbi.nlm.nih.gov/articles/PMC4994863/]
- 4. Sceptic: pseudotime analysis for time-series single-cell ... [https://genomebiology.biomedcentral.com/articles/10.1186/s13059-025-03679-3]
- 5. A statistical framework for differential pseudotime analysis ... [https://www.nature.com/articles/s41467-023-42841-y]
- 6. Pseudotimecascade visualizes gene expression cascade in ... [https://sciety-discovery.elifesciences.org/articles/by?article_doi=10.1101/2025.11.19.689263]
- 7. The intrinsic dimension of gene expression during cell ... [https://pmc.ncbi.nlm.nih.gov/articles/PMC12401001/]
- 8. A pseudotemporal trajectory analysis of single-cell RNA ... [https://pmc.ncbi.nlm.nih.gov/articles/PMC10663991/]
- 9. A framework to understand the role of biological time in ... [https://www.nature.com/articles/s41598-022-13603-5]
- 10. Sceptic: pseudotime analysis for time-series single-cell ... [https://pmc.ncbi.nlm.nih.gov/articles/PMC12273354/]
- 11. Canonical time-series features for characterizing ... [https://apertureneuro.org/article/140433-canonical-time-series-features-for-characterizing-biologically-informative-dynamical-patterns-in-fmri]
- 12. Trajectory Inference for Single Cell Omics - PMC [https://pmc.ncbi.nlm.nih.gov/articles/PMC11844634/]
- 13. scSTEM: clustering pseudotime ordered single-cell data [https://genomebiology.biomedcentral.com/articles/10.1186/s13059-022-02716-9]
- 14. Joint analysis of single-cell RNA sequencing and bulk ... [https://www.sciencedirect.com/science/article/pii/S0969996125000518]
- 15. Gene-level alignment of single-cell trajectories [https://www.nature.com/articles/s41592-024-02378-4]
- 16. Trajectory inference across multiple conditions with ... [https://www.nature.com/articles/s41467-024-44823-0]
- 17. Human mesenchymal stem cells self -renew and differentiate ... [https://pubmed.ncbi.nlm.nih.gov/19652709/]
- 18. - Self and renewal in vitro from murine... multilineage differentiation [https://www.cirm.ca.gov/about-cirm/publications/self-renewal-and-multilineage-differentiation-vitro-murine-prostate-stem-cells/]
- 19. A Quantitative Framework for Evaluating Single-Cell Data ... [https://pmc.ncbi.nlm.nih.gov/articles/PMC7305633/]
- 20. Improved reconstruction of single-cell developmental ... [https://www.nature.com/articles/s41592-025-02857-2]
- 21. Transcriptome size matters for single-cell RNA-seq ... [https://www.nature.com/articles/s41467-025-56623-1]
- 22. Trajectory inference from single-cell genomics data with a ... [https://journals.plos.org/ploscompbiol/article?id=10.1371/journal.pcbi.1012752]
- 23. Single-Cell Computational Strategies for Lineage ... [https://pmc.ncbi.nlm.nih.gov/articles/PMC5924749/]
- 24. A robust and accurate single-cell data trajectory inference ... [https://bmcbioinformatics.biomedcentral.com/articles/10.1186/s12859-023-05179-2]
- 25. Trajectory-based differential expression analysis for single- ... [https://www.nature.com/articles/s41467-020-14766-3]
- 26. DTFLOW: Inference and Visualization of Single-cell ... [https://pmc.ncbi.nlm.nih.gov/articles/PMC8602766/]
- 27. Pseudotime estimation: deconfounding single cell time series [https://pmc.ncbi.nlm.nih.gov/articles/PMC5039927/]
- 28. Branch-specific gene discovery in cell differentiation using ... [https://pmc.ncbi.nlm.nih.gov/articles/PMC12594343/]
- 29. Inductive graph neural network framework for imputation of ... [https://www.sciencedirect.com/science/article/abs/pii/S0098135425000353]
- 30. Integrated machine learning and single-cell analysis ... [https://pmc.ncbi.nlm.nih.gov/articles/PMC12628411/]
- 31. Constructing single-cell trajectories - Monocle 3 [http://cole-trapnell-lab.github.io/monocle3/docs/trajectories/]
- 32. Building trajectories with Monocle 3 • Signac [https://stuartlab.org/signac/articles/monocle]
- 33. Slingshot: cell lineage and pseudotime inference for single ... [https://bmcgenomics.biomedcentral.com/articles/10.1186/s12864-018-4772-0]
- 34. PAGA: graph abstraction reconciles clustering with trajectory ... [https://genomebiology.biomedcentral.com/articles/10.1186/s13059-019-1663-x]
- 35. PHLOWER leverages single-cell multimodal data to infer ... [https://www.nature.com/articles/s41592-025-02870-5]
- 36. Data Integration Approaches for Representing Stem Cell ... [https://pubmed.ncbi.nlm.nih.gov/32570596/]
- 37. scACT: Accurate Cross-modality Translation via Cycle ... [https://pmc.ncbi.nlm.nih.gov/articles/PMC11611688/]
- 38. Global and local interpretability techniques of supervised ... [https://www.sciencedirect.com/science/article/abs/pii/S0952197623020134]
- 39. Continuous map of early hematopoietic stem cell ... [https://www.nature.com/articles/s41467-025-57096-y]
- 40. Transitions in lineage specification and gene regulatory ... [https://pmc.ncbi.nlm.nih.gov/articles/PMC8456780/]
- 41. Unlocking hematopoietic stem cell potential - PubMed Central [https://pmc.ncbi.nlm.nih.gov/articles/PMC12440966/]
- 42. scRDEN: single-cell dynamic gene rank differential ... [https://www.nature.com/articles/s41598-025-01969-1]
- 43. Image-based inference of tumor cell trajectories enables large ... [https://pmc.ncbi.nlm.nih.gov/articles/PMC12273761/]
- 44. Lamian: a statistical framework for differential pseudotime ... [https://winnie09.github.io/Wenpin_Hou/pages/Lamian.html]
- 45. Research [https://www.publichealth.columbia.edu/academics/departments/biostatistics/research/research-labs-programs/hou-lab/research]
- 46. CCPE: cell cycle pseudotime estimation for single cell RNA ... [https://pmc.ncbi.nlm.nih.gov/articles/PMC8789092/]
- 47. PseudotimeDE: inference of differential gene expression ... [https://genomebiology.biomedcentral.com/articles/10.1186/s13059-021-02341-y]
- 48. Continuous map of early hematopoietic stem ... cell differentiation [https://www.nature.com/articles/s41467-025-57096-y?error=cookies_not_supported]
- 49. Lineage trajectories and fate determinants of postnatal neural stem ... [https://journals.plos.org/plosbiology/article?id=10.1371/journal.pbio.3003318]
- 50. Integrated pseudotime analysis of human pre-implantation ... [https://www.sciencedirect.com/science/article/pii/S1934590921001855]
- 51. Integrating the characteristic genes of macrophage ... [https://www.aging-us.com/article/204856/text]
- 52. A statistical framework for differential pseudotime analysis with ... [https://pmc.ncbi.nlm.nih.gov/articles/PMC8288148/]
- 53. GitHub - mokhtar200/Cancer- Stem - Cells - Trajectory -Inference... [https://github.com/mokhtar200/Cancer-Stem-Cells-Trajectory-Inference-and-Pseudotime-Analysis]
- 54. A statistical framework for differential pseudotime analysis with multiple single-cell RNA-seq samples - PMC [https://www.ncbi.nlm.nih.gov/pmc/articles/PMC8288148/]
- 55. Inference Methods, Pseudotime Analysis & RNA Velocity in SC Omics [https://www.cytosurge.com/applications/rna-velocity-pseudotime-analysis-inference-methods]
- 56. Pseudotime analysis reveals novel regulatory factors for ... [https://pmc.ncbi.nlm.nih.gov/articles/PMC9519747/]
- 57. Trajectory inference [https://grokipedia.com/page/Trajectory_inference]
- 58. Trajectory inference - Wikipedia [https://en.wikipedia.org/wiki/Trajectory_inference]
- 59. Generalized and scalable trajectory inference in single-cell ... [https://www.nature.com/articles/s41467-021-25773-3]
- 60. Comparative benchmarking of single-cell clustering ... [https://genomebiology.biomedcentral.com/articles/10.1186/s13059-025-03719-y]
- 61. STORIES: learning cell fate landscapes from spatial ... [https://www.nature.com/articles/s41592-025-02855-4]
- 62. Stem cells: a comprehensive review of origins and emerging ... [https://pmc.ncbi.nlm.nih.gov/articles/PMC9404248/]
- 63. Types of Stem Cells: Explained (2025) [https://www.dvcstem.com/post/different-types-of-stem-cells-and-their-functions]
- 64. Comparing trajectory inference methods [https://www.nature.com/articles/s41592-019-0443-6]
- 65. A comparison of single-cell trajectory inference methods [https://pubmed.ncbi.nlm.nih.gov/30936559/]
- 66. Algorithms to Trajectory Fate Decisions Infer Stem Cell [https://pubmed.ncbi.nlm.nih.gov/31062311/]
- 67. A pluripotent stem cell atlas of multilineage differentiation [https://www.nature.com/articles/s41597-025-05549-w]