Decoding Cell Fate: A Comprehensive Guide to Single-Cell RNA Sequencing for Stem Cell Potency Assessment
This article provides researchers, scientists, and drug development professionals with a comprehensive overview of how single-cell RNA sequencing (scRNA-seq) is revolutionizing the assessment of stem cell potency.
Decoding Cell Fate: A Comprehensive Guide to Single-Cell RNA Sequencing for Stem Cell Potency Assessment
Abstract
This article provides researchers, scientists, and drug development professionals with a comprehensive overview of how single-cell RNA sequencing (scRNA-seq) is revolutionizing the assessment of stem cell potency. We cover the foundational principles of cellular potency, from totipotency to unipotency, and detail the key scRNA-seq methodologies and computational tools, such as CytoTRACE 2 and signaling entropy, used to quantify developmental potential. The article further addresses critical troubleshooting and optimization strategies for sensitive stem cell applications and offers a comparative analysis of validation frameworks to ensure accurate and reproducible potency measurements. This guide synthesizes current best practices and emerging trends to empower robust stem cell characterization in both research and clinical settings.
Understanding Stem Cell Potency: From Totipotency to Lineage Restriction
Stem Cell Potency Hierarchy Stem cells are classified by their developmental potential, or "potency," which refers to their capacity to differentiate into various specialized cell types. This classification forms a hierarchical structure, ranging from cells that can generate a complete organism to those that can produce only a single cell type. Understanding this hierarchy is fundamental for selecting the appropriate stem cell type for specific research and therapeutic applications.
Table of Contents
- The Hierarchy of Cell Potency
- Totipotent Stem Cells
- Pluripotent Stem Cells
- Multipotent Stem Cells
- Unipotent Stem Cells
- Experimental Assessment of Potency
- The Research Toolkit
The Hierarchy of Cell Potency
The potency hierarchy categorizes stem cells based on the diversity of cell lineages they can produce. The spectrum progresses from the most versatile to the most restricted.
Comparative Overview of Stem Cell Potency
| Feature | Totipotent | Pluripotent | Multipotent | Unipotent |
|---|---|---|---|---|
| Differentiation Potential | Can generate all embryonic and extra-embryonic (placental) tissues [1] [2] [3]. | Can generate all cells derived from the three germ layers (ectoderm, mesoderm, endoderm) [4] [2] [5]. | Can generate multiple, but limited, cell types within a specific lineage [6] [1] [3]. | Can generate only a single cell type [4] [3] [7]. |
| Key Examples | Zygote (fertilized egg), early blastomere cells [2] [3] [7]. | Embryonic Stem Cells (ESCs), Induced Pluripotent Stem Cells (iPSCs) [4] [2] [7]. | Mesenchymal Stem Cells (MSCs), Hematopoietic Stem Cells (HSCs), Neural Stem Cells [6] [7] [8]. | Muscle stem cells, epidermal stem cells [4] [3] [7]. |
| Primary In Vivo Location | Early embryo (first few divisions post-fertilization) [2] [7] [8]. | Inner cell mass (ICM) of the blastocyst [6] [2] [7]. | Various adult tissues (e.g., bone marrow, adipose tissue, brain) [6] [7] [8]. | Specific niches within mature tissues [4]. |
| Expression of Pluripotency Genes | +++ (High) [1] | ++ (Medium) [1] | + (Low) [1] | - (None/Undetectable) [4] |
| Therapeutic Pros | N/A (Not used in therapy) | Unlimited self-renewal; broad differentiation potential; disease modeling [4] [8] [5]. | Fewer ethical concerns; lower risk of teratoma formation; clinically accessible (autologous use) [7] [8]. | Minimal risk of off-target differentiation; tissue-specific repair [4]. |
| Therapeutic Cons | N/A (Not used in therapy) | Ethical issues (ESCs); risk of teratoma formation; immune rejection [4] [2] [8]. | Limited differentiation scope; can be hard to isolate and expand [6] [1] [7]. | Very scarce in tissues; limited expansion capacity [4]. |
Totipotent Stem Cells
Totipotent cells sit at the pinnacle of the potency hierarchy. The term "totipotent" is derived from the Latin totus, meaning "whole" or "entire," reflecting their unique ability to form a whole organism [3]. This includes generating all the specialized cells of the embryo proper and the extra-embryonic tissues, such as the placenta, which are essential for development [1] [2]. In humans, the zygote formed at fertilization is totipotent, and this state is transiently maintained through the first few cell divisions of the early morula [2] [3]. Due to profound ethical considerations and technical challenges, totipotent cells are not used in therapeutic applications.
Pluripotent Stem Cells
Pluripotent stem cells, from the Latin plures meaning "many," represent the next level of potency [3]. These cells can give rise to all cell types derived from the three primary germ layers—ectoderm, mesoderm, and endoderm—and therefore every cell type in the adult body [4] [2] [5]. However, they cannot contribute to extra-embryonic tissues and thus cannot form a complete organism on their own [1] [2].
Key Types and Research Applications:
- Embryonic Stem Cells (ESCs): Derived from the inner cell mass of the pre-implantation blastocyst [6] [7]. They serve as a powerful tool for developmental biology studies.
- Induced Pluripotent Stem Cells (iPSCs): Artificially derived by reprogramming adult somatic cells (e.g., skin fibroblasts) through the forced expression of specific transcription factors (OCT4, SOX2, KLF4, c-MYC) [4] [2]. This groundbreaking technology, pioneered by Shinya Yamanaka, allows for the creation of patient-specific pluripotent cells, overcoming ethical concerns associated with ESCs and enabling advanced disease modeling and personalized regenerative medicine approaches [4] [2] [5].
A critical concept in pluripotency is the distinction between the "naïve" state (representing the pre-implantation epiblast) and the "primed" state (representing the post-implantation epiblast). Mouse ESCs are typically naïve, while human ESCs and EpiSCs (Epiblast Stem Cells) resemble the primed state, which has different growth requirements and molecular signatures [6] [2].
Multipotent Stem Cells
Multipotent stem cells are more restricted in their differentiation potential, typically limited to generating the cell types within a particular tissue or organ lineage [6] [1]. These cells are crucial for the body's natural maintenance, repair, and renewal throughout life.
Key Examples and Clinical Relevance:
- Mesenchymal Stem Cells (MSCs): Found in bone marrow, adipose tissue, and umbilical cord blood, MSCs can differentiate into osteoblasts (bone cells), chondrocytes (cartilage cells), and adipocytes (fat cells) [3] [7]. They are widely investigated for their regenerative and immunomodulatory properties in treating orthopedic conditions, inflammatory diseases, and graft-versus-host disease [7] [8].
- Hematopoietic Stem Cells (HSCs): Residing in the bone marrow, HSCs are responsible for the continuous production of all blood cell lineages, including red blood cells, white blood cells, and platelets [6] [7]. Bone marrow transplants, a long-established form of stem cell therapy, rely on the potency of HSCs to reconstitute the entire blood and immune system in patients with hematological cancers or disorders [7] [5].
Unipotent Stem Cells
Unipotent stem cells have the most narrow differentiation potential, as they can only produce one single cell type [4] [3]. Despite this limitation, they are essential for the regeneration and repair of specific tissues. A key example is the muscle stem cell (satellite cell), which is responsible for generating new muscle fibers and is therefore critical for muscle growth and repair after injury [4] [7]. Their unidirectional nature minimizes the risk of generating unintended cell types, making them ideal for targeted tissue regeneration, though their scarcity can pose a challenge for clinical applications [4].
Experimental Assessment of Potency
Rigorous assays are required to definitively characterize the potency of any stem cell population. The following table summarizes key experimental methods used in the field.
Key Experimental Assays for Assessing Stem Cell Potency
| Assay Name | Key Readout | Protocol Summary | Key Data Output | Applicable Cell Types |
|---|---|---|---|---|
| Teratoma Formation Assay [4] [2] | Formation of differentiated tissues from all three germ layers. | Test cells are injected into an immunodeficient mouse (e.g., kidney capsule, testis, intramuscular). The resulting tumor (teratoma) is harvested, sectioned, and histologically analyzed for the presence of tissues like cartilage (mesoderm), epithelium (ectoderm), and gut-like structures (endoderm). | Histological images and analysis confirming tissues from the three germ layers. | Pluripotent (ESCs, iPSCs) |
| In Vitro Differentiation [4] [7] | Spontaneous formation of specialized cell types. | Pluripotent cells are grown in suspension to form 3D aggregates called embryoid bodies (EBs). Without factors to maintain pluripotency, the cells spontaneously differentiate. EBs are then analyzed via PCR or immunostaining for markers of the three germ layers. | Gene expression data (qPCR) and protein markers (immunofluorescence) for ectoderm, mesoderm, and endoderm. | Pluripotent (ESCs, iPSCs) |
| Directed Differentiation [6] [9] | Efficient generation of a specific target cell type. | Pluripotent cells are exposed to a specific, timed sequence of small molecules, growth factors, and proteins (e.g., Activin A, bFGF) to mimic developmental signals and guide them toward a desired lineage, such as neurons, cardiomyocytes, or hepatocytes. | Flow cytometry or immunostaining for specific lineage markers (e.g., TUJ1 for neurons, cTnT for cardiomyocytes). High efficiency of target cell production. | Pluripotent (ESCs, iPSCs) |
| Single Cell RNA Sequencing (scRNA-seq) [10] | Unbiased, high-resolution transcriptomic profiles of individual cells. | Single cells are isolated (e.g., via FACS or microfluidics), their mRNA is reverse-transcribed and amplified to create a sequencing library, and high-throughput sequencing is performed. Computational analysis (clustering, trajectory inference) then reveals cellular heterogeneity, identifies subpopulations, and predicts developmental pathways. | t-SNE/UMAP plots showing cell clusters; lists of differentially expressed genes; pseudo-temporal trajectories showing potential differentiation paths. | All types (especially powerful for heterogeneous populations) |
The Role of Single-Cell RNA Sequencing
scRNA-seq has revolutionized stem cell research by moving beyond population-level averages to reveal the transcriptome of each individual cell [10]. This is particularly powerful for:
- Resolving Heterogeneity: Identifying distinct subpopulations within a seemingly pure culture of stem cells, which is crucial for understanding differentiation biases and functional variability [10].
- Defining Novel Markers: Discovering new cell surface or genetic markers for rare stem cell subtypes, enabling their purification and further study [10].
- Predicting Lineage Trajectories: Using computational methods to reconstruct the sequence of transcriptional changes as a stem cell differentiates, mapping out the developmental "roads" it can take [10].
The Research Toolkit
Successful stem cell research requires a suite of specialized reagents and tools to maintain, differentiate, and analyze stem cells effectively.
Essential Research Reagents and Tools
| Tool / Reagent | Function in Research | Example Use Cases |
|---|---|---|
| Pluripotency Transcription Factor Kits | Detect core pluripotency factors (OCT4, SOX2, NANOG) via immunostaining or PCR. | Routine quality control of ESCs/iPSCs; confirming successful reprogramming [4]. |
| Cytokines & Growth Factors | Direct cell fate decisions during differentiation. | LIF: Maintaining mouse ESC pluripotency [6].bFGF/FGF2: Essential for human ESC/iPSC culture [6].Activin A/BMP4: For directing mesendoderm differentiation [6] [9]. |
| Small Molecule Inhibitors/Activators | Precisely modulate key signaling pathways to control self-renewal and differentiation. | Mimicking developmental cues to guide cells toward specific lineages (e.g., neurons, cardiomyocytes) [6]. |
| Defined Culture Matrices | Provide a consistent, xeno-free surface for cell attachment and growth. | Coating culture vessels to support the adherent growth of ESCs/iPSCs in defined conditions. |
| Flow Cytometry Antibody Panels | Identify and isolate specific cell types based on surface marker expression. | Isulating hematopoietic stem cells (CD34+); characterizing differentiated cell populations; assessing purity after differentiation [10] [7]. |
| scRNA-seq Kits & Platforms | Enable transcriptome-wide analysis of gene expression at single-cell resolution. | Profiling heterogeneity in stem cell cultures; discovering novel subtypes; building lineage trajectories [10]. |
Understanding the defined hierarchy of stem cell potency—from totipotent to unipotent—provides a critical framework for research and drug development. This knowledge guides the selection of the most appropriate cell type for modeling diseases, screening drugs, and developing regenerative therapies. The integration of advanced technologies like single-cell RNA sequencing is adding unprecedented resolution to this framework, allowing scientists to dissect cellular heterogeneity and potency states with greater precision than ever before, thereby accelerating the translation of stem cell biology into clinical applications.
In regenerative medicine, the therapeutic potential of any stem cell-based product hinges on a fundamental biological property: potency. Potency refers to a cell's ability to differentiate into specialized cell types, a hallmark that ranges from the broad capacity of totipotent and pluripotent cells to the more restricted potential of multipotent and unipotent cells [11] [12]. Assessing this characteristic is not merely a technical checkbox for regulatory compliance; it is a biological imperative to ensure that cellular products will function as intended in patients. The loss of stemness during ex vivo expansion is a key factor behind diminished therapeutic benefits, including reduced proliferation, impaired differentiation capacity, and altered secretome profiles [13]. As the field advances, leveraging sophisticated tools like single-cell RNA sequencing (scRNA-seq) has become indispensable for deconvoluting cellular heterogeneity and quantifying potency, thereby providing the evidence base needed for clinical success [11] [12].
The Evolving Toolkit for Potency Assessment
The transition from traditional, reductionist assays to high-resolution, multi-omics profiling has revolutionized how scientists evaluate cell potency. Modern frameworks integrate diverse data types to build a comprehensive picture of cellular function and potential.
Computational and ScRNA-Seq Platforms Single-cell RNA sequencing sits at the core of modern potency assessment, and the choice of bioinformatics platform directly impacts the insights researchers can glean. The following table compares key tools available in 2025, highlighting their specific applicability to potency research.
| Tool Name | Best For | Key Features for Potency Research | Cost & Access |
|---|---|---|---|
| CytoTRACE 2 [11] | Predicting absolute developmental potential from scRNA-seq data. | Interpretable deep learning framework (GSBN); predicts potency categories & continuous potency score; batch effect suppression. | Academic/Non-commercial |
| Scanpy [14] [15] | Large-scale scRNA-seq analysis (Python environment). | Comprehensive preprocessing, clustering, trajectory inference (pseudotime); part of the scverse ecosystem. | Open Source |
| Seurat [14] [15] | Versatile data integration (R environment). | Robust integration across batches/modalities; native support for spatial transcriptomics and multiome data. | Open Source |
| Monocle 3 [14] | Advanced pseudotime and trajectory inference. | Graphs abstraction to model lineage branching; identifies developmental paths and cell fate decisions. | Open Source |
| scvi-tools [14] | Deep generative modeling for complex data. | Probabilistic modeling for superior batch correction; supports multiple omics modalities. | Open Source |
| Nygen [15] | Researchers needing AI insights and no-code workflows. | AI-powered automated cell annotation; intuitive dashboards; batch correction. | Freemium model |
| BBrowserX [15] [16] | Intuitive, AI-assisted analysis of large-scale datasets. | Access to a large single-cell atlas for comparison; automated cell type prediction; trajectory analysis. | Paid, on-demand pricing |
| Trailmaker [16] | User-friendly, cloud-based analysis for Parse Biosciences data. | Automated workflow from FASTQ to analysis; automatic cell annotation and trajectory analysis. | Free for academics & Parse customers |
Key Experimental and Molecular Profiling Methods Beyond computational analysis, a matrix of wet-lab assays is critical for a holistic potency profile, especially in advanced therapies like CAR T-cells [17] [18]. These methods move beyond single-point measures to capture dynamic functional and molecular states.
- Functional Potency Assays: These measure a cell's biological activity based on its mechanism of action. Key assays include cytotoxicity tests to measure target cell killing, cytokine release assays (e.g., IFN-γ, IL-2) to quantify immune activation, and proliferation and persistence assays to evaluate long-term therapeutic potential [17] [18].
- Multi-Omics Profiling: A layered, multi-omics approach provides a deeper molecular understanding:
- Genomics: Vector Copy Number (VCN) analysis via ddPCR is a standard safety and dosing metric, while T-cell receptor (TCR) sequencing assesses repertoire diversity, a factor linked to clinical efficacy [17] [18].
- Epigenomics: Assays like ATAC-seq and ChIP-seq characterize chromatin accessibility and transcription factor binding, revealing the epigenetic programs that underlie cell differentiation states and potency [17] [18].
- Transcriptomics: Bulk and single-cell RNA-seq identify expression patterns and transcriptional regulators of stemness, allowing for the discovery of novel potency biomarkers [11] [13].
- Metabolomics: Tools like the Seahorse XF Analyzer probe real-time cellular metabolism, as metabolic states such as cholesterol and unsaturated fatty acid synthesis are strongly linked to multipotency [11] [18].
Detailed Experimental Protocols for Key Assays
To ensure reproducibility and rigor in potency assessment, below are detailed methodologies for two cornerstone experiments: computational prediction of developmental potential and functional validation of T-cell potency.
Protocol 1: Predicting Developmental Potential with CytoTRACE 2 This protocol outlines the use of the CytoTRACE 2 algorithm to analyze scRNA-seq data and predict the developmental potency of individual cells [11].
- Input Data Preparation: Prepare a count matrix (genes x cells) from your scRNA-seq pipeline in a standard format, such as an AnnData object for use with Scanpy in Python.
- Model Application: Run the CytoTRACE 2 algorithm on the preprocessed data. The model's Gene Set Binary Network (GSBN) architecture will assign binary weights to genes to identify highly discriminative gene sets for each potency category.
- Output Interpretation: The algorithm generates two primary outputs for each cell:
- Potency Category: The discrete potency state (e.g., pluripotent, multipotent, differentiated) with the maximum likelihood.
- Potency Score: A continuous value from 1 (highest potency, totipotent) to 0 (lowest potency, differentiated).
- Score Smoothing: To account for transcriptional noise, CytoTRACE 2 employs Markov diffusion combined with a nearest-neighbor approach to smooth individual cell potency scores, producing a more robust trajectory.
- Validation: Correlate the CytoTRACE 2 predictions with known developmental timelines or functional assay outcomes to validate the biological relevance of the predicted potency ordering.
The following diagram illustrates the core workflow and architecture of the CytoTRACE 2 analysis pipeline.
Protocol 2: A Multi-Omics Potency Assay for CAR T-Cell Products This integrated protocol assesses the potency of chimeric antigen receptor (CAR) T-cells by combining genomic, functional, and metabolic readouts [17] [18].
Genomic Quality Control:
- Vector Copy Number (VCN): Quantify the average number of CAR vectors integrated per cell using droplet digital PCR (ddPCR). This is a critical safety and lot-release test.
- TCR Repertoire Diversity: Perform single-cell V(D)J RNA sequencing on the infusion product to assess the clonality and diversity of the T-cell population, which is associated with persistence and efficacy.
Functional Potency Assay:
- Co-culture Setup: Co-culture CAR T-cells with antigen-positive target cells at a standardized effector-to-target ratio (e.g., 1:1, 5:1) for a defined period (e.g., 24 hours).
- Cytokine Measurement: Collect the supernatant and use a multiplex immunoassay (e.g., Luminex) or ELISA to quantify the secretion of key effector cytokines like IFN-γ, TNF-α, and IL-2.
- Cytotoxicity Analysis: Measure specific lysis of target cells using a real-time cell death assay (e.g., impedance-based) or flow cytometry with a viability dye.
Metabolic Profiling:
- Utilize a Seahorse XF Analyzer to perform a Mitochondrial Stress Test and a Glycolysis Stress Test on the CAR T-cells.
- Key parameters like basal respiration, maximal respiration, and glycolytic capacity provide a readout of the cells' metabolic fitness, which is tightly linked to their long-term in vivo potency.
Visualizing the Molecular Basis of Stemness
The core signaling pathways and genetic regulators that maintain stemness are primary targets for potency assessment. Research has identified a core network of transcription factors and pathways that are essential for maintaining stemness in mesenchymal stem cells (MSCs), which are widely used in clinical trials [13]. Key regulators include TWIST1, which suppresses senescence genes like p16; OCT4, which promotes proliferation and inhibits differentiation; and SOX2, which helps maintain an undifferentiated state. Furthermore, pathways like cholesterol and unsaturated fatty acid (UFA) metabolism have been empirically validated as positive correlates of multipotency [11].
The following diagram maps these key molecular relationships that underpin stem cell potency.
Essential Research Reagent Solutions
A successful potency assessment strategy relies on a suite of reliable reagents and tools. The table below lists key materials and their functions in this field.
| Research Reagent / Material | Function in Potency Assessment |
|---|---|
| ddPCR Assay Kits [17] [18] | Precisely quantify Vector Copy Number (VCN) for genetically modified cell products (e.g., CAR T-cells). |
| Multiplex Cytokine Panels [17] | Simultaneously measure multiple cytokines (e.g., IFN-γ, TNF-α, IL-2) from supernatant to evaluate functional immune cell activation. |
| Seahorse XF Assay Kits [17] [18] | Probe cellular metabolic phenotypes in real-time, providing data on mitochondrial respiration and glycolysis. |
| Chromatin Accessibility Kits [17] [18] | Enable epigenomic profiling via methods like ATAC-seq to reveal differentiation states and regulatory landscapes. |
| Validated Antibody Panels [17] [13] | Detect key stemness (e.g., OCT4, SOX2, NANOG) and differentiation markers via flow cytometry or CyTOF. |
| scRNA-seq Library Preps [11] [14] | Generate sequencing libraries from single cells to analyze transcriptional heterogeneity and predict potency. |
The path to reliable and effective regenerative medicines is paved with rigorous potency assessment. As this article outlines, a siloed approach is no longer sufficient. The future lies in integrated strategies that combine the predictive power of interpretable AI tools like CytoTRACE 2, the rich descriptive power of multi-omics profiling, and the definitive functional readouts of classical biological assays [11] [12] [17]. Adopting this comprehensive framework is the biological imperative that will ensure cellular therapies are not only well-characterized and consistent but also clinically potent, ultimately fulfilling their promise to patients.
In stem cell research, accurately assessing cellular potency—the ability of a cell to differentiate into various lineages—is paramount. This process is fundamentally complicated by cellular heterogeneity, the natural variation in gene expression between individual cells, even within a supposedly pure population. For decades, bulk RNA sequencing (bulk RNA-seq) has been a standard tool for transcriptome analysis. However, its limitation in resolving cellular diversity presents a significant challenge, which single-cell RNA sequencing (scRNA-seq) is uniquely positioned to address. This guide objectively compares these two approaches within the context of stem cell potency research, detailing how heterogeneity impacts data interpretation and outlining robust experimental solutions.
The Fundamental Limitation of Bulk Sequencing
Bulk RNA-seq analyzes the transcriptome of a population of cells, producing an average gene expression profile for the entire sample [19]. Imagine listening to a large choir from a distance; you hear the collective sound but cannot distinguish the individual voices. Similarly, in a heterogeneous sample of stem cells at different potency stages, bulk RNA-seq measures the average expression level of each gene across all cells [19] [20].
This averaging effect has critical consequences for potency assessment:
- Masking Rare Populations: Crucial, rare cell types—such as a small subpopulation of highly potent stem cells driving regeneration or a group of drug-resistant cancer stem cells—are often invisible in bulk data. Their distinct gene expression signatures are diluted by the signals from the more abundant cell types [19] [20].
- Obscuring Dynamic Transitions: Stem cell differentiation is not a synchronized process. Bulk RNA-seq cannot capture the continuous spectrum of transitional states that cells pass through, failing to reveal the true trajectory of cellular fate decisions [21].
The following table summarizes the core differences between bulk and single-cell RNA-seq approaches in the face of heterogeneity.
| Feature | Bulk RNA-seq | Single-Cell RNA-seq |
|---|---|---|
| Resolution | Population average [19] | Individual cells [19] |
| Impact of Heterogeneity | Averages out differences, masking rare cells and states [19] | Reveals and characterizes differences, identifying rare cells and continuous states [21] [20] |
| Key Use Cases in Potency | Comparing average expression between defined sample groups (e.g., diseased vs. healthy) [19] | Identifying novel stem cell subtypes, reconstructing differentiation lineages, quantifying potency of individual cells [21] [22] [23] |
| Cost & Throughput | Lower cost per sample; simpler analysis [19] [24] | Higher cost per cell; more complex data and analysis [19] [24] |
| Ideal for Potency Assessment | No, due to lack of resolution. | Yes, enables direct in-silico potency estimation of each cell [22]. |
Single-Cell Solutions for Direct Potency Quantification
Single-cell technologies overcome the heterogeneity challenge by barcoding and sequencing the transcriptomes of thousands of individual cells in parallel [19] [20]. This allows researchers to move from a blurred average to a high-resolution census of all cell states present.
A powerful computational method derived from scRNA-seq data is signaling entropy, a robust metric for estimating the differentiation potential of a single cell [22]. This model posits that a pluripotent stem cell, capable of choosing any lineage, exhibits high signaling promiscuity or entropy. In contrast, a differentiated cell has committed to a specific fate, resulting in lower, more focused signaling activity [22].
The following diagram illustrates the core conceptual framework of signaling entropy for assessing cellular potency.
Experimental Validation of Signaling Entropy
The validity of signaling entropy as a potency measure is well-documented. In a landmark study analyzing over 1,000 single cells, pluripotent human embryonic stem cells (hESCs) showed the highest signaling entropy values. As cells differentiated into progenitors (e.g., neural, endoderm) and further into terminally differentiated cells (e.g., fibroblasts), entropy values decreased significantly and consistently [22]. The method successfully discriminated pluripotent from non-pluripotent cells with an exceptional area under the curve (AUC) of 0.96 [22].
This approach has been validated across diverse systems, including:
- Time-course differentiation: Tracking hESCs as they differentiate into definite endoderm, revealing a sharp drop in entropy around 3-4 days post-induction, aligning with known commitment timelines [22].
- Cancer stem cells: Identifying drug-resistant cancer stem-cell phenotypes within tumors, including those derived from circulating tumor cells [22].
Experimental Protocols for Stem Cell Potency Assessment
For researchers aiming to implement these approaches, below is a comparative overview of key experimental workflows.
Protocol 1: Bulk RNA-seq for Population-Level Analysis
Bulk RNA-seq remains a valid tool for specific, non-heterogeneity-focused applications. The protocol involves digesting the entire tissue or cell population to extract total RNA, followed by conversion to cDNA and the preparation of a sequencing library. The final data represents a composite, average gene expression profile for the entire sample [19]. This method is suitable for comparing gross transcriptional differences between well-defined sample groups but cannot deconvolve cellular heterogeneity.
Protocol 2: Single-Cell RNA-seq for Resolving Heterogeneity
The scRNA-seq workflow is designed to capture and preserve cell-to-cell differences [19] [24].
- Generation of Single-Cell Suspension: The tissue of interest is dissociated into a viable suspension of single cells through enzymatic or mechanical means. This is a critical step that requires optimization to minimize stress-induced transcriptional artifacts [19] [24].
- Single-Cell Partitioning and Barcoding: Single cells are isolated into individual reaction vessels. In droplet-based systems (e.g., 10x Genomics), cells are partitioned into oil-based droplets (GEMs) together with barcoded beads. Each bead contains millions of oligonucleotides with a unique cell barcode (to tag all RNAs from one cell) and a unique molecular identifier (UMI) to count individual mRNA molecules accurately [19] [20].
- Library Preparation and Sequencing: Within each droplet, cells are lysed, and mRNA is reverse-transcribed into barcoded cDNA. The cDNA is then pooled for sequencing library preparation and ultimately sequenced [19].
The following diagram contrasts the key stages of both experimental workflows.
The Scientist's Toolkit: Essential Research Reagents and Platforms
Selecting the right tools is critical for a successful single-cell study. The table below lists key solutions and their functions in the context of stem cell research.
| Tool / Reagent | Function in Experiment |
|---|---|
| 10x Genomics Chromium | A widely adopted droplet-based microfluidics system for partitioning single cells, barcoding their RNA, and preparing sequencing libraries [19] [20]. |
| Fluorescence-Activated Cell Sorting (FACS) | Used to sort live or fixed cells based on specific surface markers (e.g., stem cell markers), enriching for target populations before scRNA-seq library preparation [21] [24]. |
| Enzymatic Dissociation Mix | A cocktail of enzymes (e.g., collagenase, trypsin) tailored to specific tissues to break down extracellular matrix and generate high-quality single-cell suspensions with high viability [19] [24]. |
| Viability Stains | Dyes used to distinguish and remove dead cells from the suspension, which is crucial for reducing background noise in scRNA-seq data [24]. |
| Single Cell Multiplexing Kit | Reagents that allow sample barcoding, enabling the pooling of multiple samples in a single scRNA-seq run to reduce batch effects and per-sample costs [19]. |
| SCENT Algorithm | A computational tool (Single-Cell Entropy) that uses scRNA-seq data and a protein interaction network to compute signaling entropy and estimate the differentiation potency of individual cells [22]. |
Cellular heterogeneity is not a minor complication but a central feature of stem cell biology that fundamentally limits the utility of bulk RNA-seq for potency assessment. By averaging the transcriptome, bulk approaches obscure the very cellular diversity that drives fate decisions, masking rare stem cell populations and critical transitional states. Single-cell RNA sequencing, coupled with advanced computational metrics like signalling entropy, directly addresses this heterogeneity challenge. It transforms the "blurred average" into a precise, high-resolution map of cellular states, enabling accurate quantification of potency at the individual cell level. For researchers focused on stem cell potency, embracing single-cell technologies is no longer optional but essential for generating biologically accurate and impactful insights.
Pluripotency, the capacity of a cell to differentiate into all derivatives of the three primary germ layers, represents a foundational concept in developmental biology and regenerative medicine. The transcription factors OCT4, SOX2, and NANOG form the core of the pluripotency gene regulatory network (PGRN), governing the delicate balance between self-renewal and differentiation in embryonic stem cells (ESCs) and induced pluripotent stem cells (iPSCs). With the advent of single-cell RNA sequencing (scRNA-seq), our understanding of this network has transformed from a static circuitry to a dynamic, heterogeneous system.
Recent advances in single-cell technologies have revealed unprecedented details about how these factors operate within complex cell populations. The development of sophisticated computational tools like CytoTRACE 2, an interpretable deep learning framework that predicts developmental potential from scRNA-seq data, has enabled researchers to decode the hierarchical organization of cellular potency from totipotency to fully differentiated states [11]. This technological evolution provides the context for reassessing the specific roles, interactions, and regulatory relationships between OCT4, SOX2, and NANOG—an assessment crucial for both basic developmental biology and applied stem cell research.
Molecular Profiles and Expression Dynamics of Core Pluripotency Factors
Defining Characteristics and Expression Patterns
The core pluripotency transcription factors, though often discussed as a unified network, exhibit distinct expression patterns and molecular characteristics that underlie their specialized functions.
Table 1: Core Pluripotency Transcription Factors: Characteristics and Expression Patterns
| Marker | Gene Name | Protein Type | Pre-implantation Expression | Post-implantation Expression | Key Regulatory Role |
|---|---|---|---|---|---|
| OCT4 | POU5F1 | POU-domain transcription factor | All cells of compacted morulae; maintained in ICM | Widely expressed in epiblast | Master regulator of pluripotency; essential for ICM formation |
| SOX2 | SOX2 | HMG-box transcription factor | First expressed in inside cells of morula; marks ICM precursors | Becomes restricted to anterior epiblast; repressed by NANOG in posterior epiblast | Partners with OCT4; essential for establishing pluripotent state |
| NANOG | NANOG | Homeobox transcription factor | Co-expressed with SOX2 in ICM | Segregated from SOX2; high in posterior epiblast | Guardian of pluripotency; promotes self-renewal; represses differentiation |
OCT4 (encoded by POU5F1) exhibits one of the most consistent expression profiles across early development. It is expressed in all cells of the compacted morula and becomes restricted to the inner cell mass (ICM) as the blastocyst forms [25]. In the post-implantation embryo, OCT4 remains widely expressed throughout the epiblast, even as other core factors demonstrate regional specificity [26]. This persistent expression suggests OCT4 plays fundamental roles beyond initial pluripotency establishment.
SOX2 expression initiates slightly later than OCT4, first appearing in the inside cells of the morula, making it one of the earliest markers distinguishing inner from outer cells [25]. This spatially restricted expression pattern foreshadows its complex post-implantation dynamics, where it becomes repressed in the posterior epiblast by NANOG—a surprising regulatory relationship that contrasts with their cooperative function in pre-implantation stages [26].
NANOG demonstrates the most dynamic expression pattern of the three factors. In pre-implantation embryos, NANOG and SOX2 protein levels positively correlate, but following implantation, NANOG protein becomes undetectable at E5.5 before re-emerging with a striking anticorrelated relationship to SOX2 as gastrulation approaches [26]. This expression segregation occurs before primitive streak formation, suggesting NANOG's role extends beyond pluripotency maintenance to facilitating the onset of differentiation in specific embryonic regions.
Functional Interdependence and Regulatory Relationships
The functional relationships between these factors form a complex network of interdependence, cooperation, and context-dependent regulation. In the early ICM, OCT4 and SOX2 gradually establish a cooperative relationship, activating pluripotency-related genes through composite OCT-SOX enhancers [25]. This cooperativity is essential for the substantial reorganization of the chromatin landscape and transcriptome that occurs during the transition to the pluripotent epiblast state.
However, this cooperative relationship appears to be stage-specific. Recent research has revealed that in post-implantation development, NANOG actually represses SOX2 expression in the posterior epiblast, creating a NANOG-high/SOX2-low region that precociously loses pluripotency [26]. This repression is functionally significant—embryos with post-implantation deletion of Nanog maintain posterior SOX2 expression, suggesting that one of NANOG's key roles during this stage is to actively extinguish the pluripotent state in specific regions through SOX2 repression.
The sensitivity of this network to dosage is further highlighted by research on NANOG enhancers in human ESCs. Deletion of a single copy of specific NANOG enhancers significantly reduces NANOG expression, compromising self-renewal and increasing differentiation propensity [27]. This dosage sensitivity underscores the precision required in the regulatory relationships between these core factors.
Experimental Assessment of Pluripotency Markers
Methodologies for Marker Analysis
Accurate assessment of pluripotency markers requires sophisticated methodological approaches, each with distinct advantages and limitations in specificity, sensitivity, and throughput.
Table 2: Methodologies for Assessing Pluripotency Markers
| Methodology | Key Applications | Advantages | Limitations | Example Findings |
|---|---|---|---|---|
| Single-cell RNA-seq | Transcriptome-wide profiling of pluripotency networks; heterogeneity assessment | Reveals cellular heterogeneity; identifies novel subpopulations | High dropout rates; technical noise | CytoTRACE 2 identifies potency gradients from scRNA-seq data [11] |
| Low-input ATAC-seq | Chromatin accessibility mapping in limited cell numbers (e.g., early embryos) | Identifies regulatory elements; reveals transcription factor binding | Requires specialized protocols; limited by cell number | Revealed OCT4/SOX2 co-binding at enhancers in early ICM [25] |
| Long-read transcriptome sequencing | Comprehensive isoform characterization; novel gene discovery | Detects full-length transcripts; identifies novel isoforms | Higher error rate than short-read; computationally intensive | Identified 172 genes linked to cell states not covered by current guidelines [28] |
| Immunofluorescence/Flow Cytometry | Protein-level validation; spatial localization in embryos and colonies | Single-cell resolution; quantitative protein data | Limited by antibody specificity and availability | Revealed anticorrelated NANOG/SOX2 protein expression in epiblast [26] |
Single-cell RNA sequencing has emerged as particularly transformative for pluripotency research. Optimized workflows for stem cells, such as those developed for hematopoietic stem/progenitor cells (HSPCs), emphasize careful cell sorting, library preparation, and quality control to ensure biologically meaningful results [29]. These technical refinements are crucial given the unique transcriptional profiles of stem cells and the critical importance of capturing rare subpopulations.
The computational interpretation of scRNA-seq data has similarly advanced. CytoTRACE 2 represents a significant evolution in potency prediction, employing a gene set binary network (GSBN) architecture that assigns binary weights (0 or 1) to genes, identifying highly discriminative gene sets that define each potency category [11]. This interpretable deep learning approach outperforms previous methods in predicting developmental hierarchies and has confirmed the premier importance of established pluripotency factors, with Pou5f1 and Nanog ranking within the top 0.2% of pluripotency genes identified by the algorithm [11].
Standardized Differentiation Assays and Marker Validation
Pluripotency testing faces significant challenges in standardization, with researchers choosing between various methods and markers without established thresholds or reporting guidelines [28]. Common assessment methods include:
- Embryoid Body (EB) Formation: Spontaneous differentiation in 3D aggregates; cost-effective but stochastic
- Teratoma Assay: In vivo differentiation in immunocompromised mice; considered gold standard but ethically concerning and variable
- Directed Trilineage Differentiation: Defined media driving specific germ layer fate; potentially more standardized but protocol-dependent
Recent reassessment of marker genes using long-read nanopore transcriptome sequencing has identified significant limitations in current marker recommendations. Many traditionally recommended markers show overlapping expression patterns between germ layers, complicating unambiguous cell state identification [28]. For instance, GDF3 shows considerable overlap between undifferentiated iPSCs and endoderm, while SOX2 overlaps between undifferentiated iPSCs and ectoderm [28].
This work has validated 12 genes as unique markers for specific cell fates, including NANOG for pluripotency, with the development of a machine learning-based scoring system ("hiPSCore") that accurately classifies pluripotent and differentiated cells and predicts their differentiation potential [28]. Such approaches address the critical need for standardized, quantitative assessment tools in pluripotency research.
Regulatory Networks and Signaling Pathways
The core pluripotency transcription factors do not operate in isolation but within complex regulatory circuits that maintain the balance between self-renewal and differentiation. The following diagram illustrates the dynamic regulatory relationships between OCT4, SOX2, and NANOG across developmental stages:
Diagram 1: Dynamic Regulatory Relationships Between Core Pluripotency Factors. The network transitions from cooperative activation pre-implantation to antagonistic relationships post-implantation, with NANOG repressing SOX2 in the posterior epiblast.
The regulatory dynamics extend beyond the core transcription factors to include signaling pathways that modulate their expression and activity. Key pathways include:
- TGF-β/Activin A Signaling: Promotes NANOG expression and maintains pluripotency in human ESCs; inhibited by SB 431542 [30]
- Wnt/β-catenin Signaling: Supports self-renewal through regulation of target genes; enhanced by CHIR 99021 (GSK-3 inhibitor) [30]
- ERK Signaling: Promotes differentiation; inhibited by PD0325901 (MEK inhibitor) to maintain ground-state pluripotency [25]
The experimental workflow for analyzing these relationships in stem cell biology typically involves integrated genomic and functional approaches:
Diagram 2: Integrated Experimental Workflow for Pluripotency Research. Combined genomic and functional approaches enable comprehensive characterization of pluripotency networks.
Research Reagents and Experimental Tools
Contemporary research on pluripotency markers relies on specialized reagents and tools that enable precise manipulation and measurement of the core regulatory network.
Table 3: Essential Research Reagents for Pluripotency Studies
| Reagent Category | Specific Examples | Primary Function | Application Context |
|---|---|---|---|
| Small Molecule Inhibitors | Y-27632 (ROCK inhibitor), SB 431542 (TGF-βRI inhibitor), CHIR 99021 (GSK-3 inhibitor) | Modulate signaling pathways to control self-renewal vs. differentiation | Improves stem cell survival after freezing; enables reprogramming; directs differentiation [30] |
| Cell Surface Markers | SSEA-3, SSEA-4, TRA-1-60, TRA-1-81, CD34, CD133 | Identification and isolation of specific stem cell populations by FACS | Enrichment of hematopoietic stem/progenitor cells; purification of pluripotent populations [31] [29] |
| CRISPR Tools | CRISPRi screens, enhancer deletion constructs | Functional validation of regulatory elements | Identified essential NANOG enhancers in hESCs; validated OCT4/SOX2 co-binding sites [27] [25] |
| scRNA-seq Reagents | Chromium Next GEM Chip G Single Cell Kit, Gel Bead kits | High-throughput single-cell transcriptome profiling | Analysis of hematopoietic stem cell heterogeneity; potency prediction [11] [29] |
The selection of appropriate cell surface markers requires special consideration between species. While human pluripotent stem cells express SSEA-3 and SSEA-4, mouse embryonic stem cells express SSEA-1 but not SSEA-3/4 [31]. These carbohydrate antigens, while useful for identification and isolation, are not exclusive to pluripotent cells and should be interpreted with caution—none serve as definitive proof of pluripotency alone [31].
Small molecule inhibitors have become indispensable for controlling stem cell states. Y-27632, a selective ROCK inhibitor, significantly improves the survival of human embryonic stem cells after cryopreservation [30]. CHIR 99021 enables reprogramming of fibroblasts into iPSCs by inhibiting GSK-3 and activating Wnt signaling, while SB 431542 induces proliferation and differentiation of ESC-derived endothelial cells through TGF-β pathway inhibition [30]. These tools provide precise temporal control over signaling pathways that modulate the core pluripotency network.
The integration of single-cell technologies with computational approaches has revealed unprecedented complexity in the pluripotency network. Rather than a static circuit, we now understand the OCT4/SOX2/NANOG axis as a dynamic system whose regulatory relationships evolve across developmental stages. The surprising finding that NANOG represses SOX2 in the posterior epiblast to facilitate loss of pluripotency underscores this dynamic nature [26].
Future research directions will likely focus on several key areas: First, understanding how the dosage sensitivity of these factors and their enhancers [27] contributes to developmental precision and how perturbations lead to disease states. Second, leveraging long-read sequencing technologies [28] to discover previously overlooked markers and regulatory relationships. Third, integrating multi-omics data across temporal and spatial dimensions to build predictive models of cell fate decisions.
For researchers and drug development professionals, these advances translate to more refined tools for quality control—such as the hiPSCore scoring system [28]—and more precise manipulation of stem cell states for therapeutic applications. As single-cell technologies continue to evolve, so too will our understanding of the fundamental regulators that orchestrate the remarkable phenomenon of pluripotency.
scRNA-seq in Action: Techniques and Computational Tools for Potency Analysis
Single-cell RNA sequencing (scRNA-seq) has fundamentally transformed biological research by enabling the resolution of cellular heterogeneity at an unprecedented resolution, moving beyond the limitations of bulk RNA sequencing which obscures critical differences between individual cells [32]. This technological evolution is particularly crucial for stem cell potency assessment research, where understanding the transcriptomic landscape of individual cells is paramount for quantifying differentiation potential and functional plasticity [22] [33]. The ability to quantify differentiation potency at a single-cell level represents a task of critical importance for developmental biology, regenerative medicine, and therapeutic discovery [22].
Over the past decade, scRNA-seq methodologies have diversified into two primary categories: full-length transcript methods like Smart-seq2 that provide superior gene coverage, and high-throughput droplet-based systems that enable massive parallelization for analyzing thousands of cells simultaneously [34] [32]. This guide provides an objective comparison of core scRNA-seq platforms, focusing on their performance characteristics, technical requirements, and applicability for stem cell potency research, supported by experimental data from systematic benchmarking studies.
Core scRNA-seq Platform Comparisons
Comprehensive Performance Metrics
Table 1: Performance Comparison of Major scRNA-seq Methods
| Method | Throughput | Genes/Cell | UMIs | Key Strengths | Key Limitations | Cost Efficiency |
|---|---|---|---|---|---|---|
| Smart-seq2 | Low (96-384 cells) | Highest (~8,000) [35] | No [34] | Full-length transcript coverage; superior sensitivity [36] [35] | Not strand-specific; transcript length bias [37] | Less efficient for large cell numbers [34] |
| CEL-seq2 | Medium | Medium | Yes [34] | Reduced amplification noise [34] | Lower sensitivity than Smart-seq2 [34] | Cost-effective for intermediate throughput [34] |
| Drop-seq | High (thousands of cells) | Medium | Yes [34] | High cell throughput; cost-effective [34] | Lower genes/cell than Smart-seq2 [34] | Most cost-effective for large numbers [34] |
| 10X Genomics | High (thousands of cells) | Medium (1,000-5,000) [32] | Yes [32] | Optimized workflow; high cell capture efficiency (65-75%) [32] | mRNA capture efficiency 10-50% [32] | Higher per-cell cost than alternatives [32] |
| MARS-seq | High | Medium | Yes [34] | Quantified mRNA with less amplification noise [34] | - | Efficient for fewer cells [34] |
| FLASH-seq | Medium | High (more than Smart-seq3) [35] | Optional [35] | Fast protocol (~4.5 hours); high sensitivity [35] | Newer method with less established track record [35] | - |
| smRandom-seq | High (single microbes) | ~1,000 (E. coli) [38] | Yes [38] | Applicable to bacteria; high species specificity (99%) [38] | Specialized for microbial applications [38] | - |
Recent Methodological Advancements
Table 2: Emerging scRNA-seq Methods and Features
| Method | Year | Key Innovation | Detected Features | Transcriptome Diversity | Strand Invasion Reduction |
|---|---|---|---|---|---|
| FLASH-seq | 2022 | Combined RT-PCR; SSRTIV enzyme [35] | Highest in HEK293T cells [35] | Captures more diverse isoforms [35] | Yes (riboguanosine replaces LNA) [35] |
| Smart-seq3 | 2020 | UMI incorporation [35] | High | Good isoform detection [35] | Limited (strand invasion issues) [35] |
| VASA-seq | 2023 | Whole transcriptome coverage [39] | High metrics [39] | - | - |
| HIVE | 2023 | - | Good results with no automation [39] | - | - |
Systematic comparisons of scRNA-seq methods reveal that bulk transcriptome sequencing still detects more unique transcripts than any single-cell method, highlighting an inherent limitation of current scRNA-seq technologies [39]. However, newer methods like FLASH-seq and VASA-seq demonstrate superior performance metrics, including increased feature detection, suggesting that methodological development continues to advance the field substantially [39] [35]. Notably, a 2023 benchmarking study comparing eight methods concluded that older methods should be phased out in favor of these more recent developments that offer improved performance characteristics [39].
Technical Protocols and Workflows
Full-Length Transcript Protocols
The Smart-seq2 protocol represents a foundational method for full-length scRNA-seq and involves a detailed workflow that takes approximately 2 days from cell picking to final library preparation [36]. The methodology begins with cell lysis in a buffer containing dNTPs and oligo(dT)-tailed oligonucleotides with a universal 5'-anchor sequence [37]. Reverse transcription is performed using template-switching oligos (TSO) carrying riboguanosines and a modified guanosine to produce a locked nucleic acid (LNA) [37]. After first-strand synthesis, cDNA is amplified using a limited number of cycles, followed by tagmentation to construct sequencing libraries efficiently [37]. While this method provides excellent sensitivity and full-length coverage across transcripts, it lacks strand specificity and cannot detect non-polyadenylated RNA [36].
FLASH-seq (FS) represents a significant evolution of the SMART-seq protocol, reducing hands-on time to approximately 4.5 hours while maintaining high sensitivity [35]. Key modifications include combining reverse transcription and cDNA preamplification into a single step, replacing Superscript II with the more processive Superscript IV reverse transcriptase, and shortening the RT reaction time [35]. Additionally, FLASH-seq increases the amount of dCTP to favor C-tailing activity of the reverse transcriptase and replaces the 3'-terminal locked nucleic acid guanidine in the TSO with riboguanosine to reduce strand-invasion artifacts [35]. The method can be miniaturized to 5-μl reaction volumes, reducing reagent costs while maintaining efficiency, and can proceed directly to tagmentation without intermediate purification steps in the FS-LA (low amplification) variant [35].
Droplet-Based High-Throughput Workflows
Droplet-based scRNA-seq methods, such as the 10X Genomics Chromium system, utilize sophisticated microfluidic technology to partition individual cells into nanoliter-scale droplets [32]. The process begins with preparation of a high-quality single-cell suspension optimized for concentration (700-1,200 cells/μL) and viability (>85%) [32]. As this suspension passes through precisely engineered microfluidic channels, it merges with barcoded gel beads and partitioning oil to generate monodisperse droplets [32]. Within each droplet, cell lysis releases mRNA that binds to the bead's oligo(dT) primers, followed by reverse transcription to produce cDNA molecules tagged with unique cellular identifiers and unique molecular identifiers (UMIs) [32]. This elegant barcoding strategy enables subsequent computational deconvolution of pooled sequencing data while accounting for amplification biases through molecular counting [32].
The smRandom-seq protocol adapts droplet-based technology for bacterial single-cell RNA sequencing, which presents unique challenges since bacterial mRNAs lack poly(A) tails [38]. This method fixes bacteria with paraformaldehyde, permeabilizes them, then uses random primers with a PCR handle to capture total RNAs through multiple temperature cycling [38]. After in situ cDNA conversion, poly(dA) tails are added to the 3' hydroxyl terminus of the cDNAs by terminal transferase, creating a binding site for the poly(T) barcoded beads used in droplet encapsulation [38]. The method incorporates CRISPR-based rRNA depletion to dramatically reduce rRNA percentage from 83% to 32%, significantly enriching mRNA reads for sequencing [38].
Experimental Visualization of Methodologies
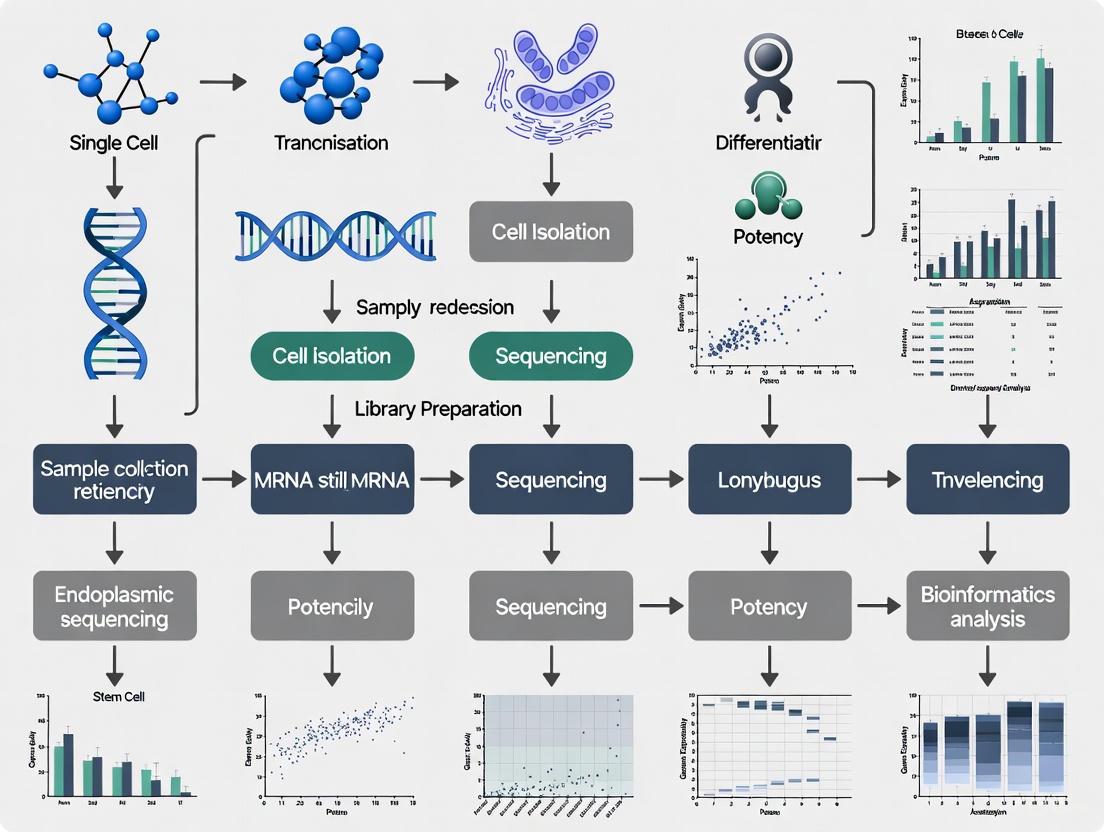
scRNA-seq Workflow Diagram
Figure 1: Core scRNA-seq Experimental Workflow. This diagram illustrates the generalized workflow for single-cell RNA sequencing, highlighting key methodological variations between platforms. Common steps include single-cell suspension preparation, microfluidic partitioning, cell lysis with mRNA capture, cDNA synthesis with barcoding, amplification, library preparation, sequencing, and bioinformatic analysis. Method-specific variations occur primarily during the mRNA capture and barcoding steps, with different platforms utilizing poly(dT) primers (10X Genomics, Drop-seq), random primers (smRandom-seq), or template switching (Smart-seq2, FLASH-seq). Additional variations include the incorporation of UMIs for reducing amplification noise and CRISPR-based rRNA depletion for enhancing microbial transcriptome analysis [36] [38] [35].
Stem Cell Potency Assessment Framework
Figure 2: Signaling Entropy Framework for Potency Assessment. This diagram illustrates the computational framework for estimating stem cell differentiation potency using scRNA-seq data through signaling entropy analysis. The method integrates single-cell transcriptomic profiles with protein-protein interaction networks to construct a cell-specific stochastic matrix representing signaling probabilities [22]. The entropy rate of this network-based signaling process quantifies the differentiation potential of individual cells, with pluripotent cells exhibiting high entropy (signaling promiscuity) and differentiated cells showing low entropy (focused signaling) [22]. This approach provides a robust, quantitative potency metric that correlates strongly with established pluripotency signatures and can accurately discriminate between pluripotent and differentiated cell states without requiring feature selection [22].
Research Reagent Solutions Toolkit
Table 3: Essential Research Reagents for scRNA-seq Experiments
| Reagent Category | Specific Examples | Function | Method Applications |
|---|---|---|---|
| Reverse Transcriptases | Superscript II, Superscript IV [35] | cDNA synthesis from RNA templates | Smart-seq2, FLASH-seq |
| Template-Switching Oligos | TSO with riboguanosines [35] [37] | Enable full-length cDNA amplification | Smart-seq2, Smart-seq3, FLASH-seq |
| Barcoded Beads | 10X Gel Beads [32] | Cellular barcoding and mRNA capture | 10X Genomics, Drop-seq |
| Unique Molecular Identifiers | UMI-containing primers [34] [38] | Quantitative mRNA counting | CEL-seq2, Drop-seq, MARS-seq, 10X |
| Cell Lysis Reagents | Specific buffers with dNTPs [37] | Cell membrane disruption and RNA stabilization | Smart-seq2, Droplet methods |
| cDNA Amplification Kits | PCR master mixes with optimized cycles [36] | cDNA library amplification | All full-length methods |
| Library Preparation Kits | Tagmentation enzymes [35] | Sequencing library construction | Smart-seq2, FLASH-seq |
| rRNA Depletion Reagents | CRISPR-based depletion systems [38] | Microbial mRNA enrichment | smRandom-seq |
| Microfluidic Chips | 10X Chromium Chip [32] | Single-cell partitioning | 10X Genomics, Drop-seq |
Application to Stem Cell Potency Research
The application of scRNA-seq platforms to stem cell potency assessment represents a particularly powerful use case, with specific methodological considerations. Research demonstrates that signaling entropy - computed by integrating scRNA-seq data with protein-protein interaction networks - provides an excellent proxy for differentiation potential at the single-cell level [22]. This approach quantifies the degree of signaling promiscuity in a cell's transcriptome, with pluripotent cells exhibiting high entropy (reflecting equal probability of all lineage choices) and differentiated cells showing low entropy (reflecting commitment to specific lineages) [22].
Experimental validation across diverse cell types confirms the utility of this approach. In a study of 1,018 single-cell transcriptomes spanning pluripotent human embryonic stem cells (hESCs) and various progenitor cells, signaling entropy accurately discriminated pluripotent from non-pluripotent states with remarkable accuracy (AUC=0.96) [22]. Pluripotent hESCs consistently exhibited the highest signaling entropy values, followed by multipotent neural progenitors and definitive endoderm progenitors, with terminally differentiated fibroblasts showing the lowest values [22]. This method outperformed conventional pluripotency gene expression signatures, demonstrating particular strength in identifying varying degrees of potency beyond simple pluripotency classification [22].
For stem cell researchers selecting scRNA-seq platforms, full-length methods like Smart-seq2 and FLASH-seq offer advantages for potency assessment due to their superior sensitivity and ability to detect more genes per cell [34] [35]. This enhanced detection capability is particularly valuable for capturing the complex transcriptional landscape of pluripotent cells. However, for large-scale studies tracking differentiation trajectories across thousands of cells, droplet-based methods provide the necessary throughput to capture rare transitional states and heterogeneous subpopulations that emerge during stem cell differentiation [32].
The integration of scRNA-seq with functional genomics approaches further enhances its utility in stem cell research. CRISPR screening technologies coupled with scRNA-seq, such as Perturb-seq, enable systematic functional assessment of gene networks regulating pluripotency and differentiation [33]. These methods can identify key regulators of cell fate decisions by measuring transcriptomic responses to targeted perturbations across thousands of individual stem cells, providing unprecedented insight into the molecular mechanisms controlling potency and lineage specification [33].
The ability to assess a cell's developmental potential—its capacity to differentiate into other cell types—is fundamental to advancing stem cell research, developmental biology, and regenerative medicine. Single-cell RNA sequencing (scRNA-seq) has transformed our ability to study cell fate decisions, but interpreting these complex data to determine cellular potency remains challenging [11]. Computational methods have emerged as essential tools for quantifying this potential, allowing researchers to move beyond descriptive analyses to predictive modeling of cellular hierarchies.
Two prominent computational frameworks for potency assessment are signaling entropy, a network-theoretical approach, and CytoTRACE 2, an interpretable deep learning framework. While both aim to quantify features of cellular potency, they differ fundamentally in their underlying principles, methodologies, and applications. Signaling entropy quantifies the uncertainty or randomness in cellular signaling networks by integrating gene expression data with protein interaction networks [40] [41]. In contrast, CytoTRACE 2 employs deep learning to predict absolute developmental potential directly from scRNA-seq data by learning multivariate gene expression programs associated with different potency states [11] [42]. This guide provides a comprehensive comparison of these frameworks, enabling researchers to select appropriate tools for their specific experimental needs.
Theoretical Foundations and Methodologies
The CytoTRACE 2 Framework
CytoTRACE 2 is an interpretable deep learning framework designed to predict both potency categories and a continuous "potency score" from scRNA-seq data. Its development addressed key limitations of previous methods, including the inability to perform cross-dataset comparisons of cellular potency [11] [42]. The framework was trained on an extensive atlas of human and mouse scRNA-seq datasets with experimentally validated potency levels, spanning 33 datasets, nine platforms, 406,058 cells, and 125 standardized cell phenotypes [11].
The core innovation of CytoTRACE 2 is its Gene Set Binary Network (GSBN) architecture, which assigns binary weights (0 or 1) to genes, identifying highly discriminative gene sets that define each potency category [11]. This design provides two key advantages: (1) identification of interpretable gene programs driving potency predictions, and (2) generation of absolute potency scores calibrated from 1 (totipotent) to 0 (differentiated), enabling direct comparison across datasets and experimental conditions [11] [43].
The method further refines its predictions through Markov diffusion combined with a nearest neighbor approach to smooth individual potency scores based on the assumption that transcriptionally similar cells occupy related differentiation states [11]. This integrated approach allows CytoTRACE 2 to learn conserved biological principles of development while suppressing batch and platform-specific variations.
Signaling Entropy Framework
Signaling entropy adopts a network-theoretical framework based on statistical mechanical principles to quantify the uncertainty in cellular signaling pathways [40] [44]. This approach integrates scRNA-seq data with protein-protein interaction (PPI) networks to model signaling flows and compute entropy measures that reflect the complexity and variability of intracellular communication [41].
The fundamental premise of signaling entropy is that cellular potency correlates with signaling diversity. In Waddington's epigenetic landscape metaphor, cells with higher developmental potential occupy higher elevations with more possible differentiation paths, which corresponds to higher signaling entropy [41] [44]. As cells differentiate and their fate options become restricted, their signaling entropy decreases accordingly.
A key challenge in signaling entropy calculation is its dependence on the quality and completeness of PPI networks. Both experimental and computational methods for detecting molecular interactions are prone to false positives and false negatives, which can affect entropy measurements [41]. The framework requires careful selection of PPI databases—such as Pathway Commons, STRING, or BioGRID—and may involve correction strategies to mitigate the impact of spurious interactions.
Key Conceptual Differences
The table below summarizes the fundamental differences between these two computational frameworks:
| Feature | CytoTRACE 2 | Signaling Entropy |
|---|---|---|
| Theoretical Basis | Interpretable deep learning | Statistical mechanics & information theory |
| Core Principle | Learns gene expression programs from training data | Quantifies uncertainty in signaling networks |
| Primary Input | scRNA-seq expression matrix | scRNA-seq data + Protein-protein interaction network |
| Key Output | Absolute potency score (0-1) and discrete categories | Entropy rate (continuous measure) |
| Interpretability | High (identifies specific gene programs) | Moderate (depends on network topology) |
| Training Requirement | Requires pre-training on annotated datasets | does not require pre-training |
| Cross-Dataset Comparison | Directly supported through absolute scaling | Possible but dependent on network consistency |
Performance Comparison and Benchmarking
Experimental Design for Method Evaluation
Comprehensive benchmarking of CytoTRACE 2 against multiple computational strategies provides critical insights into their relative performance. The developers of CytoTRACE 2 established a rigorous evaluation framework using two complementary metrics: (1) "absolute order" comparing predictions to known potency levels across datasets, and (2) "relative order" ranking cells within each dataset from least to most differentiated [11]. Performance was quantified using weighted Kendall correlation to ensure balanced evaluation and minimize bias.
The benchmarking encompassed diverse biological systems, including 33 scRNA-seq datasets with experimentally validated potency levels, 62 developmental time points from mouse embryogenesis, and cancer datasets including acute myeloid leukemia and oligodendroglioma [11]. This diverse validation set ensured robust assessment of each method's generalizability across tissues, species, and experimental platforms.
Quantitative Performance Metrics
The table below summarizes the key performance metrics from comprehensive benchmarking studies:
| Performance Metric | CytoTRACE 2 | Signaling Entropy | Other Methods (Average) |
|---|---|---|---|
| Multiclass F1 Score (potency categorization) | 0.89 (median) | Not reported | 0.41-0.72 (range) |
| Mean Absolute Error (potency prediction) | 0.15 | Not reported | 0.31-0.58 (range) |
| Relative Ordering Correlation | 0.81 (mean) | Not reported | 0.50 (mean) |
| Absolute Ordering Correlation | 0.79 (mean) | Not reported | Not applicable |
| Cross-Dataset Generalizability | High (train-test AUC: 0.87-0.92) | Moderate (network-dependent) | Variable |
| Run-time Efficiency | ~2 minutes for 2,850 cells | Varies with network size | Method-dependent |
In direct comparisons, CytoTRACE 2 outperformed eight state-of-the-art machine learning methods for cell potency classification across 33 datasets, achieving a higher median multiclass F1 score and lower mean absolute error [11]. Additionally, it surpassed eight developmental hierarchy inference methods for both cross-dataset (absolute) and intra-dataset (relative) performance, demonstrating over 60% higher correlation on average for reconstructing relative orderings in 57 developmental systems [11].
Biological Validation
Beyond computational metrics, both methods have been validated against experimental gold standards. CytoTRACE 2 predictions were confirmed through multiple approaches:
CRISPR screen validation: The top 100 positive multipotency markers identified by CytoTRACE 2 were enriched for genes whose knockout promotes differentiation, while the top 100 negative markers were enriched for genes whose knockout inhibits differentiation (Q = 0.04) [11].
Pathway discovery: CytoTRACE 2 identified cholesterol metabolism and unsaturated fatty acid synthesis genes (Fads1, Fads2, Scd2) as key multipotency-associated pathways, which were experimentally validated via quantitative PCR on sorted mouse hematopoietic cells [11].
Cancer stem cell identification: In oligodendroglioma, CytoTRACE 2 correctly identified cells with known multilineage potential, highlighting its applicability to cancer biology [11].
Signaling entropy has similarly been validated through its ability to:
- Discriminate cells according to differentiation potential and cancer status [40]
- Correlate with drug resistance in cancer cell lines, where high signaling entropy correlates with robustness to therapeutic intervention [40] [44]
- Identify critical regulatory networks in disease models through differential entropy analysis [41]
Experimental Protocols and Implementation
CytoTRACE 2 Workflow Protocol
Implementing CytoTRACE 2 involves the following key steps:
Data Preparation: Format input data as a raw count matrix (cells × genes) with gene symbols as column names and cell identifiers as row names. The package supports both R and Python implementations [45].
Package Installation: Install the CytoTRACE 2 package using devtools in R:
Running Analysis: Execute the main function with default parameters:
Result Visualization: Generate plots integrating predictions with annotations:
For human data, users should specify species = "human" parameter. The method automatically handles normalization and preprocessing [45].
Signaling Entropy Calculation Protocol
The standard protocol for signaling entropy calculation involves:
Network Selection: Choose an appropriate protein-protein interaction network. Commonly used databases include Pathway Commons, STRING, and BioGRID, each with different coverage and confidence levels [41].
Data Integration: Map gene expression values onto the network nodes, creating a weighted network where edge weights reflect expression levels of interacting proteins.
Entropy Calculation: Compute local and global signaling entropy measures using random walk-based algorithms that quantify the uncertainty in information flow through the network [40] [44].
Validation and Correction: Apply correction strategies for false-positive interactions in the PPI networks to improve reliability. This may involve confidence filtering or integration of multiple database sources [41].
The signaling entropy framework is implemented in R and available from sourceforge.net/projects/signalentropy/files/ [44].
Research Reagent Solutions
The table below outlines essential computational tools and resources for implementing these potency assessment frameworks:
| Resource | Type | Function | Availability |
|---|---|---|---|
| CytoTRACE 2 Package | Software Tool | Predicts absolute developmental potential from scRNA-seq data | GitHub: digitalcytometry/cytotrace2 |
| Signaling Entropy Package | Software Tool | Calculates signalling entropy from expression and PPI data | sourceforge.net/projects/signalentropy/ |
| Pathway Commons | PPI Database | Curated protein-protein interactions for entropy calculations | pathwaycommons.org |
| STRING Database | PPI Database | Predictive and known protein interactions with confidence scores | string-db.org |
| BioGRID | PPI Database | Literature-curated molecular interactions | thebiogrid.org |
| Tabula Sapiens | Reference Data | Cross-tissue scRNA-seq atlas for validation | tabulasapiens.org |
| Pancreas Epithelium Data | Example Dataset | Mouse developmental dataset for testing methods | Provided in CytoTRACE 2 vignette |
Applications in Stem Cell and Cancer Research
Developmental Biology Applications
Both frameworks have proven valuable for reconstructing developmental hierarchies from scRNA-seq data. CytoTRACE 2 has successfully captured the progressive decline in potency across 258 phenotypes during mouse development without requiring data integration or batch correction [11]. It accurately reconstructed the temporal hierarchy of mouse embryogenesis across 62 timepoints, demonstrating superior performance compared to other methods [11] [46].
In studying pancreatic epithelial development, CytoTRACE 2 correctly ordered cells from multipotent progenitors to differentiated endocrine cells, with predictions meticulously aligning with known biology [45]. The method also corroborated a pluripotency program in cranial neural crest cell precursors and correctly distinguished datasets with and without immature cells [11].
Cancer Research Applications
In oncology, both methods provide insights into cancer stem cells and tumor heterogeneity. CytoTRACE 2 predictions aligned with known leukemic stem cell signatures in acute myeloid leukemia and identified multilineage potential in oligodendroglioma [11]. The method has enabled identification of cancer cell stages and marker genes at the single-cell level, associating them with therapy response and survival [42].
Signaling entropy has demonstrated particular value in understanding drug resistance mechanisms, where high entropy correlates with robustness to therapeutic intervention [40] [44]. The method has identified critical signaling pathways that serve as "Achilles' heels" in cancer cells, potentially informing combination therapy strategies [40].
Biomarker Discovery
A key advantage of both frameworks is their utility for biomarker discovery. CytoTRACE 2's interpretable architecture enables direct identification of gene programs driving potency predictions, leading to discoveries like the association between cholesterol metabolism and multipotency [11] [42]. This capability narrows the search space for potential drug targets, boosting the efficiency of therapeutic development.
Signaling entropy analysis enables identification of critical nodes in regulatory networks whose perturbation disproportionately affects system behavior, highlighting potential therapeutic targets in cancer and other diseases [40] [41].
Integrated Analysis Framework
The complementary strengths of these frameworks suggest value in their integrated application. The following diagram illustrates a potential workflow for combining both approaches in a comprehensive potency assessment strategy:
This integrated approach leverages CytoTRACE 2's strengths in absolute potency assessment and gene program identification while incorporating signaling entropy's insights into network-level dynamics and system robustness. Such integration may be particularly powerful for studying complex biological processes like cancer progression, tissue regeneration, and cellular reprogramming.
CytoTRACE 2 and signaling entropy represent distinct but complementary approaches to computational assessment of cellular potency from scRNA-seq data. CytoTRACE 2 offers superior performance in potency categorization and developmental ordering, with the distinct advantage of providing absolute, cross-dataset comparable scores and interpretable gene programs [11]. Its robust implementation and extensive validation make it suitable for researchers seeking a standardized, high-performance solution for potency assessment.
Signaling entropy provides a theoretically grounded framework based on statistical mechanics that connects gene expression patterns to systems-level properties through network analysis [40] [44]. While more dependent on network quality and potentially less accurate for precise potency categorization, it offers unique insights into system robustness, drug resistance, and critical network nodes.
For researchers entering this field, CytoTRACE 2 represents the current state-of-the-art for most applications, particularly when absolute potency assessment and biological interpretability are priorities. Signaling entropy remains valuable for studies focused on network dynamics, systems biology principles, and understanding the relationship between cellular complexity and phenotypic robustness. As both fields continue to evolve, their integration may offer the most comprehensive approach to unraveling the complexities of cellular potency in development, regeneration, and disease.
Single-cell RNA sequencing (scRNA-seq) has revolutionized our understanding of cellular heterogeneity, enabling the dissection of complex tissues into distinct cell subpopulations and the inference of dynamic developmental processes. For researchers in stem cell biology, accurately identifying a cell's position within a developmental hierarchy is paramount. This guide provides a comparative analysis of computational methods for extracting these insights, with a special focus on their application in stem cell potency assessment.
A Primer on Key Computational Tasks
Before comparing methods, it is essential to define the core computational challenges in scRNA-seq analysis:
- Cell Subpopulation Identification: This task involves classifying individual cells into distinct types or states based on their transcriptomic profiles. It is typically addressed through a pipeline of dimensionality reduction followed by clustering or automatic cell classification [47] [48] [49].
- Developmental Trajectory Inference: This process reconstructs the dynamic pathways along which cells differentiate, ordering cells along a pseudo-temporal continuum to model transitions from potent stem cells to specialized progeny [50].
- Potency Assessment: This specifically aims to quantify the developmental potential of a cell—its ability to differentiate into other cell types—ranging from totipotent and pluripotent to multipotent and fully differentiated states [22] [11].
Comparative Analysis of Computational Methods
The following tables provide a structured comparison of popular and recently developed methods based on their performance in published benchmarks.
Table 1: Comparison of Automatic Cell Identification Methods
This table summarizes the performance of selected classifiers, as benchmarked across multiple datasets [47].
| Method | Type | Key Principle | Strengths | Limitations |
|---|---|---|---|---|
| SVM (Support Vector Machine) | General-purpose classifier | Finds an optimal hyperplane to separate cell types in high-dimensional space [47]. | High accuracy and top performer in intra- and inter-dataset predictions; scales well [47]. | Does not inherently provide a rejection option for uncertain cells [47]. |
| SVMrejection | General-purpose classifier | Extends SVM by allowing cells with low prediction confidence to remain unclassified [47]. | High accuracy; reduces mislabeling by assigning "unlabeled" to uncertain cells [47]. | Leaves a percentage of cells unclassified, requiring further analysis [47]. |
| scPred | Single-cell-specific classifier | Uses a reference atlas to train a classifier for predicting cell identities in new data [47]. | High performance; incorporates a rejection option [47]. | Can assign a relatively high percentage of cells as unlabeled (e.g., >10%) [47]. |
| scmap-cell | Single-cell-specific classifier | Projects cells from a new dataset to the closest reference cell using a k-nearest neighbor search [47]. | Fast and accurate; includes a rejection option [47]. | Performance can be sensitive to the quality and completeness of the reference atlas [47]. |
| Cell-BLAST | Single-cell-specific classifier | A deep learning-based method for cell type annotation and fate prediction [47]. | Potentially powerful for complex predictions [47]. | Inconsistent performance; can be poor on some datasets [47]. |
Table 2: Comparison of Developmental Trajectory and Potency Assessment Methods
This table focuses on methods that infer developmental hierarchies and quantify cellular potency [22] [50] [11].
| Method | Category | Key Principle | Application in Stem Cell Potency |
|---|---|---|---|
| Signalling Entropy (SCENT) | Potency & Trajectory | Integrates scRNA-seq data with a protein interaction network to compute an entropy rate, which measures signaling promiscuity [22]. | Accurately distinguishes pluripotent stem cells from progenitors and differentiated cells; serves as a robust proxy for differentiation potential without need for feature selection [22]. |
| CytoTRACE 2 | Potency & Trajectory | An interpretable deep learning framework that predicts absolute developmental potential using a gene set binary network (GSBN) [11]. | Outperforms other methods in predicting absolute potency categories (e.g., pluripotent, multipotent) and ordering cells in developmental hierarchies across diverse datasets [11]. |
| RNA Velocity (e.g., ScVelo) | Dynamics & Fate | Models cellular dynamics by leveraging the ratio of unspliced to spliced mRNAs to predict future cell states [50]. | Infers short-term cell fate and direction of state transitions; useful for understanding the dynamics of exit from pluripotency [50]. |
| Monocle 3 | Trajectory Inference | Learns a trajectory graph (often a tree) through cells embedded in a reduced space to order them in pseudotime [50]. | Reconstructs complex branching lineages during differentiation, ideal for mapping fate decisions from progenitor cells [50]. |
| Slingshot | Trajectory Inference | Uses a minimum spanning tree and principal curves to fit branching trajectories onto pre-defined cell clusters [50] [49]. | Effective for inferring lineage paths when major cell states are already known, such as in directed differentiation experiments [50]. |
| Waddington-OT | Fate Modeling | Applies optimal transport theory to time-series data to infer probabilistic fate maps and transitions [50]. | Predicts how cell populations redistribute over time, quantifying probabilities of reaching different fates from a starting population [50]. |
Experimental Protocols for Key Methodologies
Protocol: Assessing Potency with Signalling Entropy (SCENT)
Objective: To estimate the differentiation potential of single cells from scRNA-seq data without prior feature selection [22].
Workflow Overview:
Detailed Steps:
- Data Input: Provide two inputs: a matrix of gene expression counts from scRNA-seq and a high-quality Protein-Protein Interaction (PPI) network [22].
- Network Mapping: Map the expression level of each gene onto its corresponding protein node within the PPI network. The underlying assumption is that two proteins are more likely to interact if their genes are highly expressed [22].
- Stochastic Matrix Construction: For each cell, construct a stochastic matrix (transition probability matrix) that defines a random walk on the network. The probabilities reflect the promiscuity of signaling—how likely information is to flow from one protein to another [22].
- Entropy Rate Calculation: Compute the entropy rate of this probabilistic signaling process. A high entropy rate indicates a state of high signaling promiscuity and uncertainty, characteristic of a pluripotent cell. A low entropy rate indicates restricted signaling, characteristic of a committed, differentiated cell [22].
- Validation: The method has been validated on over 7,000 single cells, showing its ability to accurately discriminate pluripotent stem cells from various progenitor and differentiated cell types (AUC = 0.96) [22].
Protocol: Cell Type Annotation Using SVM Classifiers
Objective: To automatically and accurately assign cell type labels to individual cells in a new dataset using a pre-trained reference.
Workflow Overview:
Detailed Steps:
- Reference Selection: Obtain a comprehensively annotated scRNA-seq dataset (reference atlas) that encompasses the expected cell types [47].
- Feature Selection: Identify a set of informative genes, typically the top highly variable genes, to reduce dimensionality and noise [47].
- Model Training: Train a Support Vector Machine (SVM) classifier on the reference data. The model learns the decision boundaries that separate different cell types in the multidimensional gene expression space [47].
- Prediction: Apply the trained SVM model to the gene expression profiles of cells in a new, unannotated dataset to predict their identities [47].
- Performance Consideration: For higher confidence, use a classifier with a rejection option (like SVMrejection) which leaves uncertain cells as "unlabeled" rather than risking misassignment [47].
The Scientist's Toolkit: Essential Research Reagents and Platforms
Successful execution of the analyses above depends on the quality of the initial scRNA-seq data. The table below lists key reagents and platforms used in the field.
Table 3: Key Research Reagent Solutions for scRNA-seq
| Item | Function | Example Platforms / Kits |
|---|---|---|
| Microfluidic Platform | Isolates single cells into nanoliter reactions for parallel library preparation. | Fluidigm C1, WaferGen ICELL8 [51]. |
| Droplet-Based Platform | Encapsulates single cells in droplets with barcoded beads for high-throughput profiling. | 10x Genomics Chromium, BioRad ddSEQ, DropSeq [51]. |
| Library Prep Kit | Converts the minute amount of RNA from a single cell into a sequencer-compatible library. | SMARTer Ultra Low RNA Kit (for full-length), Chromium Single Cell 3' Kit (for 3'-counting) [51]. |
| Viability Stain | Distinguishes live cells from dead cells during sample preparation to ensure data quality. | Calcein AM/EthD-1, Propidium Iodide, Hoechst 33324 [51]. |
| Protein Interaction Network | Provides the scaffold for network-based analysis methods like Signalling Entropy. | Public databases such as STRING or BioGRID [22]. |
The choice of computational method is dictated by the specific biological question. For straightforward cell type annotation, SVM-based classifiers offer a robust, high-accuracy solution [47]. When the goal is to understand differentiation dynamics and cellular plasticity, trajectory inference and potency assessment methods are indispensable.
- Signalling Entropy provides a powerful, theory-based estimate of potency that integrates network biology and requires no prior training, making it highly generalizable [22].
- CytoTRACE 2 represents a significant advance as it uses deep learning to provide an absolute developmental potential score, enabling direct cross-dataset and cross-tissue comparisons. Its interpretable architecture also reveals the gene programs driving potency decisions, offering not just a prediction but biological insight [11].
For the most comprehensive analysis, a hybrid approach is often best: using a classifier to define discrete cell states, followed by a trajectory/potency method to order these states and infer their relationships. As the field progresses towards integrating multi-omics data at the single-cell level, these computational tools will become even more critical for building a precise and dynamic Human Cell Atlas and for advancing stem cell-based therapies and drug development.
The hierarchical process of blood cell formation, or hematopoiesis, represents one of the most extensively studied adult stem cell systems. For decades, the conventional model depicted hematopoiesis as a tree-like structure originating from multipotent hematopoietic stem cells (HSCs) that progressively differentiate through increasingly lineage-restricted progenitors [52] [29]. However, this established paradigm has been fundamentally challenged and refined by the advent of single-cell RNA sequencing (scRNA-seq) technologies, which enable researchers to dissect cellular heterogeneity at unprecedented resolution [53] [29].
This case study examines how scRNA-seq has transformed our understanding of hematopoietic stem and progenitor cell (HSPC) biology. We focus specifically on how this technology has enabled the construction of detailed transcriptional maps of hematopoiesis, revealed previously unrecognized progenitor populations, and provided insights into the molecular mechanisms governing cell fate decisions. By comparing experimental approaches, analytical methods, and technological innovations, we provide a comprehensive overview of how scRNA-seq has become an indispensable tool for probing the complexity of blood formation.
Experimental Foundations: scRNA-seq Methodologies for HSPC Analysis
Core Experimental Workflows
Current protocols for HSPC scRNA-seq generally follow a streamlined workflow encompassing cell isolation, library preparation, sequencing, and computational analysis [54] [29]. The critical initial step involves the careful isolation of HSPC populations using fluorescence-activated cell sorting (FACS) with well-established surface marker combinations. For human studies, common enrichment strategies target CD34+Lin−CD45+ or CD133+Lin−CD45+ cells from sources including bone marrow, peripheral blood, or umbilical cord blood [54] [29]. For murine studies, researchers typically isolate Lineage−cKit+Sca1+ (LKS) populations from bone marrow [52] [55].
Following cell sorting, most contemporary studies utilize droplet-based scRNA-seq platforms such as the 10X Genomics Chromium system, which enables efficient capture and barcoding of thousands of single cells [52] [29]. Standard quality control metrics are then applied to filter out low-quality cells, typically excluding those with fewer than 200-500 detected genes or elevated mitochondrial gene expression (>5-10%), which may indicate compromised cell viability or technical artifacts [52] [29].
Critical Analytical Considerations
The analysis of HSPC scRNA-seq data presents unique challenges that require specialized computational approaches:
- Feature Selection: The choice of feature selection method significantly impacts integration performance and biological interpretation. Highly variable gene selection has been shown to effectively produce high-quality integrations, though the number of features selected, batch-aware selection, and lineage-specific features all influence results [56].
- Batch Effect Correction: Technical variations between samples processed in different batches can confound biological signals. Canonical correlation analysis (CCA) and other integration algorithms implemented in tools like Seurat effectively align datasets while preserving biological variation [52] [56].
- Trajectory Inference: Computational methods such as Monocle and CytoTRACE reconstruct developmental trajectories by ordering cells along pseudotemporal axes based on transcriptional similarity, allowing inference of differentiation pathways directly from snapshot data [52] [11].
- Regulatory Network Analysis: Tools like SCENIC infer gene regulatory networks from scRNA-seq data by identifying transcription factor motifs enriched in co-expressed gene modules, providing insights into the regulatory logic underlying cell fate decisions [52].
Table 1: Key Experimental Considerations for HSPC scRNA-seq Studies
| Experimental Stage | Critical Considerations | Common Approaches |
|---|---|---|
| Cell Isolation | Preservation of native transcriptional states; purity | FACS with CD34/CD133 (human) or LKS (mouse) markers |
| Library Preparation | Capture efficiency; transcript diversity | 10X Genomics Chromium; Smart-seq2 |
| Sequencing | Read depth; gene detection | 25,000-50,000 reads per cell; 10X platform |
| Quality Control | Removal of technical artifacts; doublet detection | Filtering by gene counts, mitochondrial percentage |
| Data Integration | Batch correction; biological conservation | Seurat CCA; Harmony; scVI |
Comparative Analysis of scRNA-seq Approaches
Sample Source and Processing Strategies
Different sampling strategies significantly influence the comprehensiveness of the resulting hematopoietic map. Studies focusing exclusively on immunomagnetic-selected CD34+ cells from human bone marrow successfully identified major lineage branches but missed important early fate decisions, particularly toward basophil and monocyte lineages [53]. In contrast, extending analysis to encompass the broader Lineage-negative (Lin−) fraction, including both CD34+ and CD34−/low populations, recovered these missing branches and provided a more complete landscape of early hematopoiesis [53]. This approach revealed that CD34 expression is downregulated at different rates along commitment to various cell fates, causing biased representation in CD34-enriched samples.
Umbilical cord blood represents an alternative HSPC source that offers practical advantages, including easier procurement and potentially more primitive stem cell populations. Comparative scRNA-seq analysis of CD34+ versus CD133+ HSPCs from cord blood revealed remarkably similar transcriptional profiles (R = 0.99), suggesting substantial overlap between these populations despite the hypothesis that CD133+ cells might represent more primitive stem cells [54] [29].
Cross-Species Conservation and Differences
Comparative transcriptomic analysis of HSPCs from human and mouse demonstrates remarkable evolutionary conservation. Integration of 32,805 single cells from both species revealed that hematopoietic cell types cluster primarily by cell type rather than species, with conserved gene expression patterns across 17 identified subpopulations [52]. The overall architecture of hematopoietic differentiation follows similar trajectories in both species, with three dominant branches (erythroid/megakaryocytic, myeloid, and lymphoid) deriving directly from hematopoietic stem cells [52].
Despite this overall conservation, important species-specific differences exist. A comprehensive single-cell framework comparing adult human and mouse multipotent progenitors (MPPs) identified similar cellular states and differentiation trajectories but also revealed distinct immunophenotypic definitions for functionally analogous populations [57]. For instance, researchers prospectively isolated distinct human MPP subpopulations using CD69, CLL1, and CD2 expression in addition to classical markers like CD90 and CD45RA [57].
Table 2: Performance Comparison of scRNA-seq Analytical Methods
| Method Category | Specific Tools | Key Applications | Performance Notes |
|---|---|---|---|
| Trajectory Inference | Monocle, CytoTRACE 1 | Pseudotemporal ordering; lineage relationships | Dataset-specific predictions; limited cross-dataset comparability |
| Developmental Potential | CytoTRACE 2 | Absolute potency scores; cross-dataset comparisons | Outperformed 8 methods for developmental hierarchy inference [11] |
| Data Integration | Seurat CCA, Harmony, scVI | Batch correction; reference mapping | Highly variable genes effective for integration; 2,000 features often optimal [56] |
| Regulatory Networks | SCENIC | Transcription factor activity; regulons | Identifies conserved regulatory programs across species [52] |
| Query Mapping | Multiple algorithms | Atlas construction; cell type annotation | Affected by feature selection strategy; batch-aware methods preferred [56] |
Emerging Technologies and Functional Validation
Beyond Transcriptomics: Multi-modal Approaches
While scRNA-seq provides powerful insights into cellular heterogeneity, it captures only a snapshot of cellular states. Innovative approaches are now combining transcriptional profiling with functional assessment to bridge this gap. Quantitative phase imaging (QPI) with temporal kinetics represents one such advancement, enabling non-invasive, label-free monitoring of live HSCs during ex vivo expansion [58]. This technology has revealed remarkable functional diversity within phenotypically pure HSC fractions, with individual cells exhibiting distinct proliferation dynamics, morphological characteristics, and division patterns that correlate with functional potential [58].
The integration of QPI with machine learning algorithms enables the prediction of HSC functional quality based on cellular kinetics, moving the field from snapshot-based identification toward dynamic, time-resolved prediction of stem cell behavior [58]. Similarly, multi-omic approaches that combine scRNA-seq with additional data modalities, such as chromatin accessibility or surface protein expression, provide more comprehensive views of HSPC regulation [57].
Advanced Computational Framework
The recently developed CytoTRACE 2 algorithm represents a significant advance in computational methods for assessing developmental potential from scRNA-seq data [11]. This interpretable deep learning framework predicts absolute developmental potential using a novel gene set binary network (GSBN) architecture that identifies highly discriminative gene sets defining each potency category. Unlike earlier trajectory inference methods that provide dataset-specific predictions, CytoTRACE 2 generates absolute potency scores calibrated from 1 (totipotent) to 0 (differentiated), enabling meaningful cross-dataset comparisons [11].
In comprehensive benchmarking across 33 datasets and 406,058 cells, CytoTRACE 2 outperformed eight state-of-the-art machine learning methods for cell potency classification and eight developmental hierarchy inference methods, demonstrating over 60% higher correlation with ground truth developmental orderings [11]. The method also identified molecular programs driving potency predictions, including cholesterol metabolism genes that were experimentally validated as functional markers of multipotency in hematopoietic cells [11].
Research Reagent Solutions Toolkit
Table 3: Essential Research Reagents and Tools for HSPC scRNA-seq Studies
| Reagent/Tool | Specific Example | Function/Application |
|---|---|---|
| Cell Surface Markers (Human) | CD34, CD133, CD45, Lineage cocktail | Identification and isolation of HSPC populations by FACS |
| Cell Surface Markers (Mouse) | c-Kit, Sca-1, Lineage markers, CD150, CD48 | Murine HSC identification and isolation |
| scRNA-seq Platform | 10X Genomics Chromium | High-throughput single-cell capture and barcoding |
| Analysis Software | Seurat, Monocle, SCENIC | Data integration, trajectory inference, regulatory network analysis |
| Developmental Potential | CytoTRACE 2 | Prediction of absolute potency from scRNA-seq data |
| Live Cell Imaging | Quantitative Phase Imaging (QPI) | Label-free monitoring of HSC kinetics and behavior |
Visualizing Experimental Workflows and Biological Insights
Integrated scRNA-seq Analysis Workflow
The following diagram illustrates the comprehensive workflow for mapping hematopoietic hierarchy using scRNA-seq, from sample preparation through biological interpretation:
Hematopoietic Differentiation Hierarchy
This diagram summarizes the current understanding of hematopoietic hierarchy as revealed by scRNA-seq studies, highlighting key lineage branch points and progenitor populations:
Single-cell RNA sequencing has fundamentally transformed our understanding of hematopoietic stem cell hierarchy, moving the field beyond simplistic tree-like models to embrace the complexity and continuous nature of blood cell differentiation. Through comparative analysis of different experimental approaches, we have identified that comprehensive sampling strategies, appropriate computational methods, and integration of multimodal data are critical for reconstructing accurate developmental trajectories.
The emerging paradigm recognizes that hematopoiesis follows a hierarchically structured continuum with conserved lineage relationships across species, but also incorporates substantial heterogeneity at the cellular level. Technologies like CytoTRACE 2 for potency assessment and QPI for live-cell kinetic analysis represent the next frontier in stem cell research, enabling not just description but prediction of cellular behavior. As these tools continue to evolve, they promise to further refine our maps of hematopoietic development and enhance our ability to manipulate this system for therapeutic purposes.
Navigating Technical Pitfalls: Optimizing scRNA-seq for Sensitive Stem Cell Assays
In single-cell RNA sequencing (scRNA-seq) for stem cell potency assessment, the biological insight gained is fundamentally constrained by the quality of the starting sample. Pre-analytical steps—encompassing tissue dissociation, cell sorting, and viability preservation—are not merely preparatory but are decisive in determining the accuracy and reliability of downstream potency analyses [59] [60]. Technical artifacts introduced during these stages can obscure true biological signals, such as the subtle transcriptional differences between pluripotent and early-differentiated cells [61]. This guide objectively compares the technologies and methodologies that define best practices for handling rare and sensitive cell populations, providing a framework for optimizing research on stem cell developmental potential.
Cell Sorting Technologies: A Comparative Analysis
The choice of cell sorting technology directly impacts cell viability, recovery, and transcriptional integrity, which are paramount for meaningful potency assessment.
citation:2] [61] [62]. The following table summarizes the core performance characteristics of major sorting technologies.
Table 1: Comparative Analysis of Cell Sorting Technologies for scRNA-seq
| Technology | Mechanism | Throughput | Key Strengths | Key Limitations | Typical Viability Post-Sort | Best Suited for Potency Research |
|---|---|---|---|---|---|---|
| FACS (Fluorescence-Activated) [63] | Electrostatic droplet deflection | High | High-speed, multi-parameter sorting, excellent purity [59] | High shear stress, potential for cellular stress [61] | Variable (can be lower for fragile cells) | Isulating well-defined populations using surface markers. |
| MACS (Magnetic-Activated) [63] | Magnetic column separation | Medium | Gentle process, simple, cost-effective, closed-system options [63] | Lower purity and throughput than FACS, limited to fewer parameters | >90% (gentler process) [61] | Quick enrichment of target populations prior to a more refined sort. |
| Microfluidic/MEMS [63] [62] | Microchip-based sorting (e.g., acoustic, mechanical) | Low to Medium | Very gentle, minimal shear stress, integrated with downstream analysis [62] | Lower throughput, can be limited by chip/clogging | >95% (highly gentle) [62] | Rare, fragile cells (e.g., primary stem cells, CTCs) where viability is critical. |
| LIFT-Assisted Systems [62] | Laser-induced forward transfer | Low | Extremely high viability, precise single-cell retrieval, label-free | Very low throughput, specialized equipment | >95% (non-contact, minimal energy) [62] | Ultra-rare cell validation and single-cell clonal culture. |
Supporting Experimental Data: Gentle Sorting in Practice
A 2025 study developed a Laser-Induced Forward Transfer-assisted microfiltration system (LIFT-AMFS) for sorting circulating tumor cells (CTCs), a model for rare and fragile cells. The system achieved a single-cell retrieval yield of over 95% while maintaining viability sufficient for ex vivo culture and high-quality scRNA-seq [62]. The cDNA yields from isolated cells surpassed 4.5 ng, and single-cell sequencing data exhibited Q30 scores above 95.92%, demonstrating that gentle handling preserves nucleic acid integrity [62].
In a personalized medicine case study for T-cell therapy, the use of a gentle, microchip-based sorter (MACSQuant Tyto Lux) was critical for preserving the functionality and viability of patients' T-cells, enabling subsequent expansion and effective tumor cell elimination [61].
Assessing and Preserving Cell Viability
Cell viability is a critical metric that profoundly influences scRNA-seq data quality. Dead cells and cellular debris increase background noise through ambient RNA and can lead to the misidentification of cell types [60].
Quantifying the Impact of Viability on Data Quality
Table 2: Viability Metrics and Their Impact on scRNA-seq Outcomes
| Viability Level | Expected Impact on scRNA-seq Data | Recommended Action |
|---|---|---|
| >90% [64] | Optimal. Low ambient RNA, clear cell clustering. | Proceed with standard library prep. Ideal for potency assays. |
| 80% - 90% | Moderate ambient RNA, potential for some batch effects. | Proceed with caution; use viability-enhancing reagents. |
| <80% | High levels of ambient RNA, poor cell recovery, unreliable identification of rare populations. | Not recommended. Requires sample cleanup or reprocessing. |
Methodologies for Viability Enhancement
- Enzymatic Dissociation Optimization: The use of cold-active proteases (e.g., from Bacillus licheniformis) during tissue dissociation minimizes stress-induced transcriptional changes compared to standard 37°C enzymatic digestion [59].
- Gentle Sorting Pressures: Technologies that reduce shear forces, such as microchip-based sorting, are proven to maintain higher cell viability and functionality [61].
- Cryopreservation and Fixation: Studies confirm that cryopreserved cells maintain transcriptional profiles similar to freshly isolated cells, allowing for batch processing and reducing technical variability [59]. Single-nucleus RNA sequencing (snRNA-seq) is a viable alternative for fixed tissues or tissues that cannot be dissociated into live single-cell suspensions [59].
Strategies for Rare Cell Population Analysis
Rare cell populations, such as stem and progenitor cells, are central to potency research. Their accurate identification and analysis require specialized approaches.
Experimental Design for Rare Cell Profiling
A key consideration is choosing between a strict a priori enrichment of the target population versus a more agnostic approach that sequences a broader mixed population [59]. The former reduces heterogeneity and sequencing costs but may introduce bias and overlook novel cell states. The latter is superior for de novo discovery of new cell subtypes but requires sequencing a greater number of cells at higher depth [59] [65].
Fluorescent reporter systems driven by lineage-specific promoters allow for precise identification without relying on surface markers [59]. For spatially rare cells in microanatomical niches, photolabeling technologies (e.g., photoactivatable-GFP) enable optical marking and subsequent isolation based on both marker expression and location [59].
Computational Tools for Inferring Developmental Potential
Once rare cells are isolated, computational methods can infer their developmental potency from scRNA-seq data alone.
Table 3: Computational Methods for Potency Assessment from scRNA-seq Data
| Method | Underlying Principle | Key Application | Experimental Validation |
|---|---|---|---|
| CytoTRACE 2 [11] | Interpretable deep learning framework trained on an atlas of cells with known potency. | Predicts absolute developmental potential on a continuous scale from 0 (differentiated) to 1 (totipotent). | Outperformed 8 other methods in benchmarking; predictions aligned with known stem cell signatures in leukemia and oligodendroglioma. |
| SCENT [22] | Computes signaling entropy (SR) by integrating a cell's transcriptome with a protein-protein interaction network. | Quantifies signaling promiscuity as a proxy for differentiation potential. | Validated on >7,000 cells; SR robustly discriminated pluripotent hESCs from differentiated progenitors (AUC=0.96). |
A 2025 study introduced CytoTRACE 2, a method that accurately orders cells by developmental potential across diverse datasets. The model was trained on a compendium of human and mouse scRNA-seq datasets with experimentally validated potency levels. In benchmarking, it achieved over 60% higher correlation with ground truth developmental orderings compared to previous methods, enabling detailed mapping of single-cell differentiation landscapes without requiring data integration or batch correction [11].
The Scientist's Toolkit: Essential Reagent Solutions
Successful pre-analytical workflows rely on a suite of specialized reagents and kits.
Table 4: Key Research Reagent Solutions for Pre-analytical Workflows
| Reagent/Kits | Function | Application Note |
|---|---|---|
| Tissue Dissociation Kits [64] | Pre-defined enzyme mixes for standardized tissue digestion. | Kits tailored to specific tissues (e.g., neural, tumor) improve viability and yield. |
| Fluorescent Conjugated Antibodies | Cell surface marker identification for FACS/MACS. | Critical for isolating rare populations defined by surface antigens (e.g., CD34+ stem cells). |
| Viability Stains (e.g., Propidium Iodide, DAPI) | Distinguish live from dead cells during sorting. | Essential for gating out dead cells to reduce ambient RNA. |
| Cell Preservation Media | Cryopreserve cells without loss of viability or transcriptome integrity. | Allows for batch processing of samples collected at different times. |
| RNase Inhibitors | Preserve RNA integrity during cell processing. | Added to lysis and sorting buffers to prevent RNA degradation. |
| External RNA Controls (e.g., ERCC, Sequin) [59] | Spike-in RNA molecules to calibrate measurements and account for technical variation. | Crucial for quality control and normalizing data from rare cell samples. |
The path to robust scRNA-seq data in stem cell potency research is paved during the pre-analytical phase. The choice between high-throughput FACS and gentler microfluidic or LIFT-based systems represents a trade-off between scale and viability preservation. As demonstrated by experimental data, technologies that prioritize cell integrity enable more reliable downstream molecular assays, from scRNA-seq to functional culture. Coupled with rigorous viability management and sophisticated computational tools like CytoTRACE 2, these methods empower researchers to accurately dissect the developmental hierarchies that underpin regenerative biology and disease.
Single-cell RNA sequencing (scRNA-seq) has revolutionized stem cell research by enabling the characterization of cellular diversity at unprecedented resolution. However, a significant challenge in droplet-based scRNA-seq protocols is the frequent lack of expression data for genes that can be detected using other methods. This sensitivity limitation poses a particular problem for stem cell potency assessment, where accurately quantifying the complete transcriptome is essential for identifying true cellular identity and differentiation potential. Recent research has demonstrated that these observed sensitivity deficits primarily stem from three sources: poor annotation of 3' gene ends, issues with intronic read incorporation, and gene overlap-derived read loss. This guide objectively compares the performance of a novel approach—optimized transcriptomic references—against other established data recovery and imputation methods, providing researchers with experimental data to inform their analytical choices.
The Problem of Missing Data in scRNA-seq
Droplet-based scRNA-seq datasets often lack expression data for genes that can be detected with alternative methods. Through systematic investigation, researchers have identified three primary technical sources for these sensitivity deficits [66] [67] [68]:
- Poor annotation of 3' gene ends: Incomplete annotation of 3' untranslated regions (UTRs) in reference transcriptomes leads to discarding sequencing reads that map to unannotated regions.
- Issues with intronic read incorporation: Standard exonic references fail to incorporate intronically mapped reads, resulting in loss of valuable transcriptional information.
- Gene overlap-derived read loss: Overlapping gene transcripts cause ambiguous read mapping, forcing computational pipelines to discard these reads during analysis.
The implications of these technical issues are particularly significant for stem cell research. Missing data can obscure critical marker genes and even entire cell types, compromising the accurate assessment of cellular potency and differentiation states [67]. For instance, researchers investigating thirst-related neurons in the media preoptic nucleus of the brain found that scRNA-seq failed to detect these neurons despite knowing they were present based on other evidence [67].
Comparative Analysis of Data Recovery Methods
Methodologies and Experimental Protocols
The ReferenceEnhancer approach addresses missing data through a systematic optimization of the reference transcriptome itself, rather than post-hoc imputation [66] [67] [68]. The methodology involves three key steps:
- Implementing a hybrid pre-mRNA mapping strategy: This incorporates intronic reads that would otherwise be discarded, effectively creating a 'pre-mRNA reference' that captures more transcriptional information.
- Resolving gene overlaps: The method identifies and removes rare read-through and premature-start transcripts, along with poorly supported gene models and pseudogenes that cause elimination of sequencing data from well-established protein-coding genes.
- Extending 3' boundaries: This step incorporates unannotated 3' UTRs with sequencing reads spliced to reads mapping to known exons, addressing the poor annotation of gene ends.
The framework is implemented in the ReferenceEnhancer R package, available for researchers to optimize genome annotations for their own scRNA-seq analyses [67] [68].
Alternative Imputation Methods
Various computational imputation methods have been developed to address scRNA-seq dropouts, each with distinct methodological approaches [69] [70]:
- Neural network-based methods: scNTImpute uses a neural topic model to extract underlying topic features of single-cell transcriptome data, inferring cell similarity and identifying dropout values based on mixture model learning [70].
- Statistical model-based methods: SAVER uses information across genes and cells to impute zero values by leveraging potential relationships between genes [69].
- Deep learning approaches: DCA (deep count autoencoder) employs a reconstruction error defined as the probability of the noise model distribution rather than direct reconstruction of input data [69].
Performance Comparison Across Experimental Datasets
Quantitative Recovery of Gene Expression
Evaluation studies comparing 11 imputation methods on 12 real biological datasets and 4 simulated datasets reveal significant differences in numerical recovery capabilities [69]:
Table 1: Performance Comparison of Data Recovery Methods in scRNA-seq Analysis
| Method | Approach Type | Numerical Recovery on Real Data | Effect on Cell Clustering | Computational Efficiency | Stem Cell Applications |
|---|---|---|---|---|---|
| ReferenceEnhancer | Reference optimization | Substantial improvement [66] | Reveals missing cell types [67] | Moderate (pre-processing) | Directly recovers marker genes [68] |
| SAVER | Statistical model | Slight, consistent improvement [69] | Better than raw data [69] | Variable | Limited validation |
| scNTImpute | Neural topic model | Accurate dropout identification [70] | Improves subset clustering [70] | Moderate | Not specifically tested |
| DCA | Deep learning (autoencoder) | Overestimates expression [69] | Negative effect on some datasets [69] | High | Limited validation |
| scVI | Statistical model | Overestimates expression [69] | Poor on real datasets [69] | High | Limited validation |
| DrImpute | Similarity learning | Moderate improvement [69] | Improves clustering coherence [69] | High | Limited validation |
Impact on Stem Cell Potency Assessment
The accurate estimation of differentiation potency is crucial for stem cell research. Methods specifically designed for potency assessment include:
Table 2: Methods for scRNA-seq Potency Estimation in Stem Cell Research
| Method | Underlying Principle | Accuracy in Potency Assessment | Computational Requirements | Key Advantages |
|---|---|---|---|---|
| CytoTRACE 2 | Deep learning framework | High accuracy across 33 datasets [11] | Moderate to high | Predicts absolute developmental potential [11] |
| CCAT | Correlation of connectome and transcriptome | Comparable to state-of-art [71] | Ultra-fast (minutes for 1M cells) [71] | Scalable to large studies [71] |
| SCENT/SR | Signaling entropy | Accurate for pluripotency identification [22] | Computationally intensive | Robust potency proxy [22] |
| CytoTRACE 1 | Number of genes expressed | Dataset-specific predictions [11] | Low to moderate | Simple intuitive basis [11] |
ReferenceEnhancer particularly benefits potency assessment by recovering missing marker genes essential for identifying stem cell states. In one study, optimizing the reference transcriptome revealed "the full repertoire of thirst-, satiety-, and temperature-sensing neural populations in our brain regions that we suspected would be there but were unable to detect" [67].
Experimental Workflow and Visualization
ReferenceEnhancer Methodology
The following diagram illustrates the three-step workflow for optimizing transcriptomic references with ReferenceEnhancer:
Signaling Entropy in Potency Assessment
For stem cell research, signaling entropy provides a computational framework for estimating differentiation potency from scRNA-seq data. The following diagram illustrates how signaling entropy quantifies cellular potency states:
Table 3: Key Research Reagent Solutions for scRNA-seq Data Recovery
| Resource | Function | Application Context | Availability |
|---|---|---|---|
| ReferenceEnhancer R Package | Optimizes genome annotations for scRNA-seq | Pre-processing step for data recovery | https://github.com/PoolLab/ReferenceEnhancer [67] |
| Optimized Mouse/Human Transcriptomes | Enhanced reference for mapping | Improved read registration in mouse/human studies | www.thepoollab.org/resources [68] |
| SCENT R Package | Estimates single-cell potency using signaling entropy | Stem cell differentiation studies | https://github.com/aet21/SCENT [71] |
| CytoTRACE 2 | Deep learning framework for developmental potential | Cross-dataset potency comparisons | https://cytotrace2.stanford.edu [11] |
| Protein-Protein Interaction Networks | Context for signaling entropy calculations | Integration with transcriptome data | Pathway Commons, STRING [71] |
The recovery of missing data in scRNA-seq represents a critical frontier in stem cell research, particularly for accurate potency assessment. While multiple imputation methods exist, the optimization of transcriptomic references through tools like ReferenceEnhancer offers a distinct advantage by addressing the fundamental sources of missing data rather than applying post-hoc corrections. Experimental evidence demonstrates that reference optimization can substantially improve cellular profiling resolution, reveal missing cell types, and recover marker genes essential for stem cell characterization. For researchers focused on stem cell potency, combining reference optimization with robust potency estimation methods like CytoTRACE 2 or CCAT provides a comprehensive framework for maximizing biological insights from scRNA-seq data. As single-cell technologies continue to evolve, these approaches will be essential for building accurate and comprehensive cell atlases and advancing regenerative medicine applications.
In single-cell RNA sequencing (scRNA-seq), amplification bias introduces significant technical noise that can distort the true biological signal, a critical concern in sensitive applications like stem cell potency assessment. During scRNA-seq library preparation, the minute amount of starting RNA from a single cell must be amplified, typically by Polymerase Chain Reaction (PCR) or in vitro transcription (IVT), to generate sufficient material for sequencing [72] [73]. However, this amplification process is not uniform; some transcripts are amplified more efficiently than others due to factors such as sequence length, GC content, and secondary structure [73]. This bias directly compromises the accuracy of transcript quantification, potentially leading to the misidentification of cell types or states—a paramount issue when distinguishing nuanced differences between pluripotent, multipotent, and committed progenitor cells.
The core of the problem lies in the non-linear nature of amplification. PCR-based methods are exponential and can significantly amplify small initial differences in template concentration, while IVT methods, though linear, have their own limitations in efficiency [72] [73]. These technical artifacts are often confounded with the biological heterogeneity that scRNA-seq seeks to illuminate. For stem cell research, where the transcriptomic profiles of rare sub-populations with high regenerative potential are of immense interest, inaccurate quantification can lead to false conclusions about potency markers and regulatory pathways. Therefore, understanding and mitigating amplification bias is not merely a technical exercise but a prerequisite for generating biologically meaningful and reliable data.
Experimental Comparison of Amplification Bias Mitigation Strategies
Researchers have developed various experimental and computational strategies to combat amplification bias. The following experiments provide quantitative data on the performance of different methods.
Experiment 1: Evaluating PCR Error Correction with Novel UMI Designs
A 2024 study directly quantified the impact of PCR errors on transcript counting and tested a novel error-correcting UMI design [74].
Experimental Protocol:
- Cell Lines: Used JJN3 human and 5TGM1 mouse cell lines.
- Encapsulation: Cells were encapsulated using the 10X Chromium system (using standard monomer UMIs) and Drop-seq with custom homotrimeric nucleotide block UMI beads.
- PCR Amplification: Libraries underwent varying numbers of PCR cycles (10, 20, 25, 30, 35).
- Sequencing: Libraries were sequenced on Oxford Nanopore Technologies (ONT) PromethION and MinION platforms.
- Analysis: Compared the accuracy of common molecular identifiers (CMIs) and transcript counts after standard monomer UMI deduplication versus the homotrimeric UMI correction method.
Results: Table 1: Impact of PCR Cycles and UMI Type on Transcript Counting Accuracy
| PCR Cycles | UMI Type | CMI Accuracy (%) | CMI Accuracy after Correction (%) | Differentially Expressed Transcripts (vs. 20-cycle library) |
|---|---|---|---|---|
| 20 | Monomer | ~80% | Not Applicable | Baseline |
| 25 | Monomer | ~73% | Not Applicable | >300 |
| 25 | Homotrimer | ~73% | ~99% | 0 |
The data demonstrates that increasing PCR cycles from 20 to 25 with standard monomer UMIs led to a drop in CMI accuracy and resulted in over 300 falsely identified differentially expressed transcripts. In contrast, the homotrimer UMI correction method restored CMI accuracy to over 99% and eliminated all false differential expression calls, providing highly accurate molecular counts [74].
Experiment 2: Benchmarking Computational Denoising for Dropout Correction
Amplification inefficiencies contribute to "dropouts" (false zero counts). A 2025 study introduced ZILLNB, a deep learning model, and benchmarked it against other computational tools for denoising scRNA-seq data [75].
Experimental Protocol:
- Datasets: Applied to public scRNA-seq datasets from mouse cortex and human Peripheral Blood Mononuclear Cells (PBMCs).
- Methods Compared: ZILLNB was compared against VIPER, scImpute, DCA, DeepImpute, SAVER, scMultiGAN, and ALRA.
- Evaluation Tasks:
- Cell Type Classification: Measured using Adjusted Rand Index (ARI) and Adjusted Mutual Information (AMI).
- Differential Expression (DE) Analysis: Measured using Area Under the Receiver Operating Characteristic Curve (AUC-ROC) and Area Under the Precision-Recall Curve (AUC-PR), validated against bulk RNA-seq data.
Results: Table 2: Performance of Denoising Methods in Downstream Analysis
| Method | Cell Classification (ARI) | Differential Expression (AUC-ROC) | Key Approach |
|---|---|---|---|
| ZILLNB | Highest | 0.05 to 0.3 improvement over others | Zero-Inflated Negative Binomial model with deep learning |
| DCA | Moderate | Moderate | Denoising Autoencoder |
| scImpute | Moderate | Moderate | Statistical imputation |
| SAVER | Moderate | Moderate | Bayesian recovery of expression |
| VIPER | Lower | Lower | Poisson regression model |
ZILLNB's integration of a statistical zero-inflated model with a deep generative framework allowed it to systematically decompose technical variability from biological heterogeneity, achieving superior performance in key analytical tasks [75].
Detailed Methodologies for Key Experiments
The homotrimeric UMI method provides a robust experimental solution for accurate molecule counting.
UMI Synthesis and Library Preparation:
- UMI Design: Unique Molecular Identifiers (UMIs) are synthesized using homotrimeric nucleotide blocks (e.g., 'AAA', 'CTC', 'GGG') instead of single nucleotides.
- Bead-Based Capture: For droplet-based methods like Drop-seq, beads are conjugated with oligonucleotides containing these homotrimeric UMIs, cell barcodes, and poly(dT) sequences.
- Reverse Transcription: Single cells are encapsulated in droplets with these beads. Within the droplet, cells are lysed, and mRNA is captured by the poly(dT) sequence and reverse-transcribed. The resulting cDNA is tagged with the cell barcode and homotrimeric UMI.
Amplification and Sequencing:
- PCR Amplification: The cDNA undergoes PCR amplification. With each cycle, polymerase errors can introduce base substitutions in the UMI sequence.
- Sequencing: The final library is sequenced on a platform such as Illumina or ONT.
Computational Error Correction and Deduplication:
- Trimer Processing: The sequenced UMI is divided into its constituent trimer blocks.
- Majority Vote Correction: For each position in a trimer, the nucleotide that appears in the majority of sequencing reads for that molecular family is taken as correct. For example, if a trimer is sequenced as 'ATC', 'ATC', 'AAC', the consensus is corrected to 'ATC'.
- Accurate Deduplication: Reads with corrected UMIs that are identical are considered PCR duplicates originating from the same original mRNA molecule and are counted as a single molecule.
For situations where experimental control is not feasible, ZILLNB offers a powerful computational correction.
Latent Factor Learning:
- Input: The raw scRNA-seq gene expression count matrix (cells x genes) is used as input.
- Model Architecture: An ensemble deep generative framework combining an Information Variational Autoencoder (InfoVAE) and a Generative Adversarial Network (GAN) is employed.
- Objective: This step learns low-dimensional latent representations that capture the underlying structure of both cells and genes, separating signal from noise.
Zero-Inflated Negative Binomial (ZINB) Model Fitting:
- Modeling: The observed count for each gene in each cell is modeled using a Zero-Inflated Negative Binomial (ZINB) distribution. This distribution explicitly accounts for two sources of zeros: technical "dropouts" and true biological absence.
- Parameter Optimization: The latent factors from Step 1 are integrated as covariates into the ZINB model. The model parameters are then iteratively refined using an Expectation-Maximization (EM) algorithm to decompose technical variability from biological heterogeneity.
Data Imputation:
- Generation of Denoised Data: The fitted ZINB model's adjusted mean parameters are used to generate a new, denoised, and complete expression matrix.
- Output: This final matrix has reduced technical noise and imputed values for likely dropout events, making it more suitable for downstream analyses like differential expression and cell clustering.
The Scientist's Toolkit: Essential Reagents and Materials
Table 3: Key Research Reagent Solutions for Mitigating Amplification Bias
| Item | Function | Example Use Case |
|---|---|---|
| Homotrimeric UMI Beads | Enables error-correcting quantification of original mRNA molecules during droplet-based scRNA-seq. | Accurate absolute counting of transcripts in stem cell populations to identify potency markers without PCR error inflation [74]. |
| Full-Length scRNA-seq Kits (e.g., Smart-Seq3) | Provides nearly complete transcript coverage, enabling isoform and variant analysis, and often includes UMIs. | Detecting alternative splicing isoforms or allelic expression differences that define stem cell states [72] [73]. |
| Spike-In RNA Controls (e.g., ERCC) | Adds a known quantity of exogenous RNA to the sample to track technical variation and aid normalization. | Quantifying technical noise and validating the performance of amplification and sequencing in a given experiment [73]. |
| Unique Molecular Identifiers (UMIs) | Random nucleotide tags that label each original molecule before amplification to correct for PCR duplicates. | Standard in many high-throughput protocols (10X Genomics, Drop-seq) for accurate gene expression quantification [72] [73]. |
Mitigating amplification bias is indispensable for unlocking the full potential of scRNA-seq in stem cell potency research. As the experimental data demonstrates, both experimental innovations like homotrimeric UMIs and advanced computational methods like ZILLNB provide powerful, complementary strategies to achieve this goal. The homotrimeric UMI approach offers a robust path to accurate absolute molecular counting by addressing PCR errors at their source [74]. Meanwhile, sophisticated deep learning models can retrospectively denoise complex datasets, effectively disentangling technical artifacts from meaningful biological variation, such as the subtle transcriptional differences that herald a change in cell potency [75].
Looking forward, the integration of these methods with emerging long-read sequencing technologies and multi-omics approaches at the single-cell level will further refine our ability to quantify gene expression accurately. For the stem cell biologist, the careful selection of protocols and analytical tools that minimize amplification bias is no longer optional but fundamental. It ensures that the identified transcriptional signatures of potency are a true reflection of cellular identity, thereby accelerating the development of reliable diagnostic assays and safe, effective cell-based therapies.
Best Practices for Library Preparation and Sequencing Depth in Stem Cell Studies
Single-cell RNA sequencing (scRNA-seq) has revolutionized transcriptomic studies by enabling researchers to investigate gene expression profiles at the individual cell level, providing unprecedented insights into cellular heterogeneity in complex biological systems [76]. In stem cell research, this technology is particularly valuable for identifying and quantifying 'intercellular transcriptomic heterogeneity'—biologically relevant variation between transcriptomes of single cells that often correlates with different states of differentiation potency or functional plasticity [22]. The ability to quantify differentiation potential at the single-cell level is a task of paramount importance for understanding developmental hierarchies, regenerative processes, and disease mechanisms [22] [11].
Accurate assessment of stem cell potency depends heavily on appropriate experimental design, particularly in selecting library preparation methods and determining optimal sequencing depth. These technical considerations directly impact the resolution with which researchers can distinguish subtle transcriptional differences between stem cell subpopulations, track developmental trajectories, and identify rare cell phenotypes—including drug-resistant cancer stem-cell populations [22]. This guide objectively compares current approaches for library preparation and sequencing in stem cell studies, focusing on their performance characteristics for potency assessment.
Library Preparation Protocols: A Comparative Analysis
Protocol Classifications and Key Characteristics
Multiple scRNA-seq approaches have been developed that differ significantly in their technical parameters, including cell isolation methods, amplification strategies, transcript coverage, and use of Unique Molecular Identifiers (UMIs) [76]. These methodological differences directly impact transcript detection sensitivity, quantitative accuracy, and applicability to different research scenarios in stem cell biology.
Table 1: Comparison of Major scRNA-seq Library Preparation Protocols
| Protocol Type | Transcript Coverage | Amplification Method | UMIs | Throughput | Key Advantages | Main Limitations |
|---|---|---|---|---|---|---|
| Smart-Seq2 | Full-length | PCR (template-switching) | No | Low | Detects more expressed genes; ideal for isoform analysis | Lower throughput; higher cost per cell |
| MATQ-Seq | Full-length | PCR | No | Low | Superior for low-abundance genes | Limited scalability |
| 10x Genomics (3′) | 3' end counting | PCR | Yes | High | High cell throughput; cost-effective | Limited to 3' end sequencing |
| Drop-Seq | 3' end counting | PCR | Yes | High | High scalability; minimal reagent use | Requires specialized equipment |
| CEL-Seq2 | 3' end counting | IVT | Yes | Medium | Reduced amplification bias | 3' coverage biases |
| inDrop | 3' end counting | IVT | Yes | High | Good for large cell numbers | Complex protocol |
Impact of Library Choice on Potency Assessment
The choice between full-length and 3' end counting protocols has significant implications for stem cell research. Full-length scRNA-seq methods (e.g., Smart-Seq2, MATQ-Seq) excel in tasks like isoform usage analysis, allelic expression detection, and identifying RNA editing due to their comprehensive coverage of transcripts [76]. These capabilities are particularly valuable when studying the complex regulatory networks that govern stem cell potency, where alternative splicing of key transcription factors can influence differentiation outcomes.
Conversely, droplet-based techniques like 10x Genomics, Drop-Seq, and inDrop enable higher throughput at lower cost per cell, making them particularly advantageous for detecting rare stem cell subpopulations within complex tissues or tumor samples [76]. The implementation of UMIs in many of these protocols enhances quantitative accuracy by eliminating biases introduced by PCR amplification, providing more reliable data for computational potency assessment methods like signaling entropy calculations [22] or CytoTRACE 2 [11].
Sequencing Platform Comparison: Short-Read vs. Long-Read Approaches
Performance Characteristics for Stem Cell Applications
Recent advances in sequencing technologies have introduced both short-read and long-read platforms for scRNA-seq, each with distinct performance characteristics that impact their utility for stem cell research.
Table 2: Short-Read vs. Long-Read Sequencing for Stem Cell Studies
| Parameter | Illumina Short-Read | PacBio Long-Read |
|---|---|---|
| Sequencing Depth | Higher depth (~300,000 reads/cell) [77] | Lower depth (~2M reads total) [77] |
| Read Length | Fixed length (28-91 bp) [77] | Full-length transcripts [77] |
| Transcript Recovery | Higher UMIs per cell [77] | Retains transcripts <500 bp [77] |
| Artifact Identification | Limited | Removes truncated cDNA with TSO contamination [77] |
| Isoform Resolution | Limited to gene-level | Enables isoform-level analysis [77] |
| Data Comparability | Highly comparable between methods | Platform-specific biases affect gene counts [77] |
Methodological Considerations for Stem Cell Research
For stem cell studies focused on developmental potential, both platforms offer distinct advantages. Short-read sequencing (e.g., Illumina NovaSeq 6000) provides higher sequencing depth, which enhances detection of lowly expressed transcripts that might be critical for identifying rare stem cell populations [77]. This approach has successfully supported potency assessment methods like signaling entropy, which requires integration of single-cell transcriptomic profiles with protein-protein interaction networks to quantify differentiation potential [22].
Long-read sequencing (e.g., PacBio Sequel IIe) enables full-length transcript sequencing, providing isoform resolution that can reveal previously unrecognized complexity in stem cell regulatory networks [77]. The MAS-ISO-seq library preparation method (now relabeled as Kinnex full-length RNA sequencing) allows for removal of artifacts identifiable only from full-length transcripts, potentially improving accuracy in quantitative analyses [77]. However, platform-specific cDNA processing and data analysis steps introduce biases that reduce gene count correlation between methods [77].
Experimental Protocols for Stem Cell Potency Assessment
Sample Preparation and Single-Cell Isolation
The initial stage of scRNA-seq for stem cell research involves extracting viable individual cells from the tissue of interest. For stem cell populations where tissue dissociation is challenging, or when working with frozen samples, single-nuclei RNA-seq (snRNA-seq) methodologies provide a valuable alternative [76]. Novel "split-pooling" scRNA-seq techniques applying combinatorial indexing (cell barcodes) enable processing of large sample sizes (up to millions of cells) without expensive microfluidic devices, facilitating comprehensive atlas-building projects in stem cell biology [76].
For standard approaches, the 10x Genomics Chromium platform has been widely adopted. The typical workflow involves: dissociating stem cell cultures or tissues, washing to eliminate debris and contaminants, resuspending in buffer at optimal concentration (e.g., 500 cells/μl), determining viability and concentration using automated cell counters, then combining cells with reverse transcription reagents for partitioning into nanoliter-scale Gel Beads-in-Emulsion (GEMs) [77]. Within each GEM, reverse transcription occurs with all cDNAs sharing a common barcode, enabling cell-specific identification during analysis.
Molecular Barcoding and Amplification Strategies
Following reverse transcription, cDNA amplification employs either polymerase chain reaction (PCR) or in vitro transcription (IVT) methods [76]. PCR-based amplification (used in Smart-Seq2, 10x Genomics, Drop-Seq) utilizes either template-switching activity of reverse transcriptase or ligation of common adaptors. IVT methods (used in CEL-Seq, MARS-Seq) provide linear amplification but require a second round of reverse transcription, potentially introducing 3' coverage biases [76].
The implementation of Unique Molecular Identifiers (UMIs) is critical for quantitative accuracy in stem cell potency studies. UMIs label each mRNA molecule during reverse transcription, eliminating PCR amplification biases and enabling more accurate transcript counting [76]. This precision is essential for computational methods that rely on quantitative expression data, such as signaling entropy calculations that approximate differentiation potential by computing signaling promiscuity in the context of interaction networks [22].
Diagram 1: Experimental scRNA-seq workflow for stem cell studies
Sequencing Depth Recommendations for Stem Cell Applications
Depth Requirements for Different Research Objectives
Optimal sequencing depth varies significantly depending on the specific research goals in stem cell biology. For studies focused on classifying major cell types within heterogeneous stem cell populations, shallower sequencing (20,000-50,000 reads per cell) may suffice. However, for detecting rare stem cell subpopulations or characterizing complex developmental continua, deeper sequencing is essential.
In practice, studies utilizing signaling entropy for potency assessment have successfully employed sequencing depths of approximately 300,000 reads per cell for short-read platforms [77]. This depth provides sufficient coverage to quantify expression of both highly and lowly expressed transcripts, enabling accurate calculation of entropy measures that reflect a cell's position in Waddington's epigenetic landscape [22].
Depth Considerations for Long-Read Applications
For long-read sequencing approaches, the relationship between sequencing depth and data quality differs substantially. While PacBio platforms typically yield lower total reads (approximately 2 million reads per SMRT cell) [77], the full-length transcript information provides compensatory value for specific applications in stem cell research. The identification of isoform switching during differentiation events or the detection of novel isoforms in pluripotent cells may justify the trade-off of lower sequencing depth for enhanced transcriptome characterization.
Computational Tools for Stem Cell Potency Assessment
Method Comparison for Developmental Potential Estimation
The accurate assessment of differentiation potency from scRNA-seq data relies on specialized computational approaches that leverage different mathematical frameworks to infer developmental potential.
Table 3: Computational Methods for Stem Cell Potency Assessment
| Method | Underlying Principle | Output | Strengths | Limitations |
|---|---|---|---|---|
| Signaling Entropy | Entropy rate of probabilistic signaling on PPI network [22] | Continuous potency score | No feature selection needed; identifies cancer stem-cell phenotypes | Requires high-quality interaction network |
| CytoTRACE 2 | Interpretable deep learning with gene set binary networks [11] | Absolute potency score (0-1) and categories | Cross-dataset comparisons; outperforms previous methods | Requires extensive training data |
| CytoTRACE 1 | Number of genes expressed per cell [11] | Dataset-specific rankings | Simple conceptual basis | Limited cross-dataset comparability |
| Pluripotency Signatures | Expression of predefined pluripotency genes [22] | Pluripotency score | Biological interpretability | Requires feature selection; less robust |
Performance Benchmarks in Stem Cell Applications
Recent benchmarking studies demonstrate that CytoTRACE 2 outperforms previous methods in predicting developmental hierarchies across diverse platforms and tissues [11]. The method achieves high accuracy in distinguishing absolute potency for broad potency labels (totipotent, pluripotent, multipotent, oligopotent, unipotent, and differentiated) and has shown over 60% higher correlation, on average, for reconstructing relative orderings in developmental systems compared to other hierarchy inference methods [11].
Signaling entropy has proven particularly valuable for identifying known cell subpopulations of varying potency and drug-resistant cancer stem-cell phenotypes, including those derived from circulating tumor cells [22]. The method provides a robust potency estimate without requiring feature selection, driven by a subtle positive correlation between the transcriptome and connectome [22].
Diagram 2: Computational workflows for stem cell potency assessment
Essential Research Reagent Solutions
Successful scRNA-seq experiments in stem cell research depend on carefully selected reagents and materials that maintain cell viability while enabling high-quality library preparation.
Table 4: Essential Research Reagents for scRNA-seq in Stem Cell Studies
| Reagent Category | Specific Examples | Function | Considerations for Stem Cell Research |
|---|---|---|---|
| Cell Viability Stains | Propidium iodide, Trypan blue | Assess cell integrity and viability | Critical for stem cells sensitive to dissociation |
| Dissociation Reagents | Enzyme-based solutions (trypsin, collagenase) | Tissue dissociation into single cells | Optimization needed to preserve transcriptome |
| Reverse Transcription Master Mix | Moloney murine leukemia virus RT | cDNA synthesis from mRNA | Template-switching activity for full-length protocols |
| Amplification Reagents | PCR reagents, IVT kits | cDNA amplification | UMI incorporation reduces biases |
| Barcoded Beads | 10x Genomics gel beads | Cell barcoding and mRNA capture | Barcode quality affects multiplet rates |
| Solid-Phase Reversible Immobilization (SPRI) Beads | AMPure XP beads | cDNA cleanup and size selection | Critical for removing artifacts |
| Library Preparation Kits | 10x Genomics Chromium kits | Sequencing library construction | Determine 3' vs. 5' vs. full-length coverage |
The selection of library preparation methods and sequencing depth should be guided by specific research objectives in stem cell biology. For studies focused primarily on cell type classification and lineage tracing, 3' end counting methods like 10x Genomics provide a cost-effective solution with sufficient depth of 300,000 reads per cell. When investigating isoform dynamics or splicing variants during stem cell differentiation, full-length protocols like Smart-Seq2 or long-read sequencing approaches offer distinct advantages despite their higher cost and lower throughput.
Computational assessment of developmental potential can be robustly performed using either signaling entropy or CytoTRACE 2, with the latter providing enhanced performance for cross-dataset comparisons and absolute potency scoring. As single-cell technologies continue to evolve, the integration of multi-omic approaches with increasingly sophisticated computational methods will further enhance our ability to decipher the molecular underpinnings of stem cell potency in health and disease.
Benchmarking and Validation: Ensuring Accurate Potency Measurements
The following table summarizes the key characteristics of the primary assays used for stem cell potency assessment.
| Assay Type | Key Readout | Throughput | Key Advantage | Primary Limitation |
|---|---|---|---|---|
| In Vivo Teratoma Assay [78] | Formation of complex tissues from all three germ layers [79] | Low (weeks to months) | Provides empirical proof of pluripotency in a structured, in-vivo-like environment [79] [78] | Labor-intensive, expensive, involves animal use, qualitative [78] |
| In Vivo Chimera Assays | Contribution to all fetal tissues in a developing embryo | Very Low | The most stringent functional test for developmental potential [78] | Technically challenging, ethically complex, not feasible for human cells |
| In Vitro Pluripotency Assays (e.g., EB formation) [78] | Differentiation into germ layer representatives | Medium | Avoids animal use, more rapid and controllable [78] | Generates immature tissues, may not represent full differentiation capacity [78] |
| Computational Potency Prediction (e.g., CytoTRACE 2) [11] | Predicted potency score or category from scRNA-seq data | High (minutes to hours) | Scalable, cross-dataset comparable, provides absolute developmental potential scores [11] | A computational prediction that requires functional validation [11] |
Experimental Protocols for Key Assays
The In Vivo Teratoma Assay
The teratoma assay is a long-standing benchmark for validating the functional pluripotency of human stem cell lines [78].
- Cell Preparation and Injection: Human pluripotent stem cells (PSCs) are harvested and resuspended in a cold 1:1 mixture of culture medium (e.g., DMEM/F12) and Matrigel to enhance engraftment. Typically, 1-10 million cells are injected subcutaneously or into an immunologically privileged site (e.g., kidney capsule) of an immunodeficient mouse host (e.g., NOD-SCID or NSG strains) [79] [80] [78].
- Tumor Growth and Harvesting: Teratomas are grown for an extended period, often between 9 to 12 weeks, until they reach a sufficient size (e.g., ~820 mm³) [79]. The tumor is then excised, weighed, and prepared for analysis.
- Histological Analysis: The gold-standard validation involves formalin-fixing and paraffin-embedding (FFPE) the teratoma, followed by sectioning and staining with Hematoxylin and Eosin (H&E). A successful assay demonstrates the presence of well-differentiated, morphologically recognizable tissues derived from all three embryonic germ layers: ectoderm (e.g., neural rosettes, pigmented retinal epithelium), mesoderm (e.g., cartilage, bone, muscle), and endoderm (e.g., gut-like epithelial structures, respiratory tracts) [79] [78].
Correlating with scRNA-seq Analysis
Single-cell RNA sequencing transforms the teratoma from a qualitative assay into a quantitative, high-resolution platform for developmental biology [79].
- Single-Cell Suspension Preparation: The teratoma is dissociated into a single-cell suspension using enzymatic and/or mechanical methods. For preserved samples, single-nuclei isolation can be performed [81].
- scRNA-seq Library Construction and Sequencing: Cells are loaded onto a high-throughput platform like the 10X Genomics Chromium system for single-cell barcoding, cDNA synthesis, and library preparation. The resulting libraries are sequenced to an appropriate depth [79].
- Bioinformatic Analysis and Cell Type Annotation: Sequencing data is processed through pipelines (e.g., CellRanger) to generate a gene expression matrix. Unsupervised clustering (e.g., with Seurat) groups transcriptionally similar cells. Cell types are annotated using a multi-faceted approach:
- Canonical Marker Genes: Identifying clusters expressing known cell-type-specific genes [79].
- Reference Data Mapping: Projecting teratoma cells onto established atlases of human fetal development to benchmark maturity and identity [79] [81].
- Automated Annotation: Using classifiers trained on reference datasets or large-language-model-based tools for consistent labeling [81].
Diagram of the integrated scRNA-seq and teratoma assay workflow.
Computational Tools for Developmental Potential
The emergence of sophisticated computational methods allows for the direct prediction of developmental potential from scRNA-seq data, providing a scalable in-silico correlate to functional assays.
CytoTRACE 2: An Interpretable Deep Learning Framework: This tool predicts a cell's absolute developmental potential on a continuous scale from 1 (totipotent) to 0 (differentiated) [11].
- Methodology: CytoTRACE 2 uses a "gene set binary network" (GSBN) architecture. It is trained on an extensive atlas of human and mouse scRNA-seq datasets with experimentally validated potency levels. The model learns highly discriminative gene sets that define each potency category (totipotent, pluripotent, multipotent, etc.) by assigning binary weights to genes, making its predictions interpretable [11].
- Performance: In benchmarks, CytoTRACE 2 outperformed previous methods in reconstructing known developmental hierarchies across diverse tissues and platforms. It successfully identified conserved molecular signatures of potency, with core pluripotency factors like POU5F1 (OCT4) and NANOG ranking within the top 0.2% of its predictive features [11].
Cell-Cell Communication Inference: Tools like CellPhoneDB leverage scRNA-seq data to infer intercellular signaling networks within complex tissues like teratomas [82].
- Methodology: These algorithms quantify the coordinated expression of ligand-receptor pairs between different cell types. CellPhoneDB is notable for accounting for the subunit architecture of protein complexes, providing more biologically accurate interaction hypotheses [82].
- Application: In teratoma and organoid models, this approach can reveal how different lineages communicate and how genetic perturbations (e.g., CRISPR screens) alter the signaling landscape, providing mechanistic insights into developmental processes [79] [82].
Diagram of the computational analysis pipeline for scRNA-seq data.
The Scientist's Toolkit: Essential Research Reagents and Materials
The following table details key reagents and tools essential for conducting the experiments discussed in this guide.
| Item Name | Function/Application | Specific Example / Model |
|---|---|---|
| Immunodeficient Mouse Model | In vivo host for teratoma formation, preventing rejection of human PSCs [79]. | NOD-scid IL2Rγnull (NSG), Rag2-/-;γc-/- [79] [78] |
| Extracellular Matrix (ECM) | Enhances cell survival and engraftment during injection by providing a 3D scaffold [80] [78]. | Matrigel, Geltrex [80] |
| scRNA-seq Platform | High-throughput profiling of transcriptomes from thousands of individual teratoma cells [79]. | 10X Genomics Chromium [79] [81] |
| Bioinformatics Pipeline | Processing raw sequencing data, performing quality control, clustering, and differential expression [79]. | Seurat, CellRanger [79] |
| Reference Atlas | Benchmarking teratoma cell types against in vivo counterparts for accurate annotation [79] [81]. | Human fetal organogenesis datasets [80], Mouse Cell Atlas [79] |
Single-cell RNA sequencing (scRNA-seq) has revolutionized biological research by enabling the transcriptomic profiling of individual cells. This capability is particularly crucial in stem cell research, where understanding cellular heterogeneity and delineating developmental hierarchies is fundamental. A primary application of scRNA-seq in this field is the assessment of cell potency—a cell's inherent ability to differentiate into other cell types, which ranges from totipotent and pluripotent to multipotent and finally differentiated states [11]. Choosing the appropriate scRNA-seq method is a critical decision, as the sensitivity, cost, and throughput of different protocols can significantly impact the ability to accurately capture and characterize these rare and often transient stem cell populations. This guide provides an objective comparison of current scRNA-seq methodologies, focusing on their trade-offs within the specific context of stem cell potency research.
| Protocol | Isolation Strategy | Transcript Coverage | UMI | Amplification Method | Key Features for Potency Research |
|---|---|---|---|---|---|
| Smart-Seq2 [72] | FACS | Full-length | No | PCR | High sensitivity for lowly-expressed transcripts; ideal for detecting pluripotency factors. |
| Drop-Seq [72] | Droplet-based | 3'-end | Yes | PCR | High-throughput, low cost per cell; suitable for profiling large, heterogeneous populations. |
| inDrop [72] | Droplet-based | 3'-end | Yes | IVT | Lower cost per cell; uses hydrogel beads for barcode capture. |
| CEL-Seq2 [72] | FACS | 3'-only | Yes | IVT | Linear amplification reduces bias; good for comparative transcriptomics. |
| MATQ-Seq [72] | Droplet-based | Full-length | Yes | PCR | High accuracy in quantifying transcripts and detecting variants. |
| SPLiT-Seq [72] | Not required | 3'-only | Yes | PCR | Fixed cells; highly scalable and low cost; uses combinatorial indexing. |
| 10x Genomics Chromium Flex [83] | Droplet-based (fixed cells) | 3'-end (probe-based) | Yes | PCR | Probe-based capture allows for analysis of sensitive cells; suitable for clinical samples. |
| Parse Biosciences Evercode [83] | Combinatorial indexing (fixed cells) | 3'-end | Yes | PCR | High gene detection sensitivity; enables massive multiplexing (up to 96 samples). |
Methodological Trade-offs: A Data-Driven Perspective
Sensitivity and Transcript Coverage
The ability to detect low-abundance transcripts is paramount in stem cell studies, where key regulatory genes, such as Pou5f1 (OCT4) and Nanog, may be expressed at low levels.
- Full-Length Protocols: Methods like Smart-Seq2 and MATQ-Seq sequence the entire transcript. This provides superior sensitivity for detecting more expressed genes per cell and enables isoform-level analysis, which can be critical for understanding functional gene regulation in pluripotent cells [72].
- 3'-End or 5'-End Protocols: Droplet-based methods like Drop-Seq, inDrop, and the 10x Genomics Chromium system primarily capture the 3' or 5' ends of transcripts and use Unique Molecular Identifiers (UMIs) to enable accurate digital counting of RNA molecules. While they may detect fewer genes per cell on average, their high cell throughput makes them powerful for discovering rare stem cell subtypes within a large, heterogeneous sample [72].
A recent comparative study highlights that microwell-based and combinatorial indexing methods (e.g., Evercode) can demonstrate higher RNA capture sensitivity compared to some droplet-based methods, leading to better detection of cells with low RNA content [83]. This is a significant advantage when working with sensitive cell types like stem cells.
Throughput and Scalability
Throughput refers to the number of cells that can be profiled in a single experiment.
- High-Throughput Methods: Droplet-based (Drop-Seq, inDrop, 10x Genomics) and combinatorial indexing (SPLiT-Seq, Evercode) techniques can profile thousands to millions of cells in a single run [72] [83]. This is indispensable for constructing detailed developmental trajectories and identifying very rare multipotent progenitors.
- Lower-Throughput Methods: Plate-based methods (Smart-Seq2, CEL-Seq2) using FACS isolation typically profile hundreds of cells. They are less suited for large-scale atlas building but provide deeper transcriptional characterization per cell [72].
Cost Considerations
The cost per cell is a major practical factor. Droplet-based and combinatorial indexing methods have dramatically reduced the cost per cell, making large-scale studies feasible [72] [84]. While the initial reagent cost for a full experiment may be high, the per-cell cost is often low. In contrast, full-length, plate-based methods like Smart-Seq2 have a higher cost per cell due to reagents and labor, limiting their use to smaller, targeted studies where transcriptome depth is prioritized over cell number.
Experimental Protocols for scRNA-seq in Potency Research
Workflow 1: High-Throughput Profiling of a Heterogeneous Stem Cell Population
This protocol is designed to capture the full spectrum of cellular states within a mixed population, such as a differentiating stem cell culture.
- Sample Preparation: Gently dissociate cells into a single-cell suspension. Viability should be >90% to minimize ambient RNA. For sensitive cells like neutrophils, immediate fixation (e.g., with Evercode or Flex kits) is recommended to preserve transcriptomic states [83].
- Library Preparation: Use a high-throughput, droplet-based method like the 10x Genomics Chromium system or a combinatorial indexing kit like Parse Biosciences Evercode. These methods efficiently barcode thousands of individual cells [83].
- Sequencing: Sequence libraries on an Illumina platform to a recommended depth of 20,000-50,000 reads per cell for 3'-end protocols.
- Computational Analysis for Potency:
- Preprocessing: Use tools like Cell Ranger (10x Genomics) or the BESCA pipeline to align reads, generate feature-count matrices, and perform quality control [83].
- Potency Scoring: Input the normalized expression matrix into specialized algorithms:
- CytoTRACE 2: An interpretable deep learning framework that predicts an absolute developmental potential score (1 totipotent, 0 differentiated) from scRNA-seq data. It has been shown to outperform other methods in reconstructing developmental hierarchies [11].
- SCENT (Single-Cell ENTropy): Calculates a signaling entropy score by integrating the transcriptome with a protein-protein interaction network. A higher entropy rate indicates greater signalling promiscuity and is a robust proxy for higher differentiation potential [22].
Workflow 2: In-Depth Characterization of a Purified Stem Cell Population
This protocol is for focused studies on a pre-defined, FACS-sorted population of stem cells where transcriptional depth is key.
- Cell Isolation: Use Fluorescence-Activated Cell Sorting (FACS) to isolate a highly pure population of cells based on specific surface markers (e.g., SSEA-4 for pluripotent stem cells).
- Library Preparation: Use a full-length, high-sensitivity method like Smart-Seq2. This protocol generates sequencing libraries from individual sorted cells placed into multi-well plates.
- Sequencing: Sequence to a high depth (e.g., 1-5 million reads per cell) to maximize the detection of lowly expressed transcripts.
- Analysis: Follow a similar preprocessing and normalization workflow as above, followed by potency assessment using CytoTRACE 2 or signaling entropy. The full-length data can also be used for alternative analyses like isoform usage or allele-specific expression.
Signaling Pathways and Computational Frameworks for Potency Assessment
Diagram: Signaling Entropy as a Measure of Cellular Potency
The following diagram illustrates the core concept of using signaling entropy to estimate a cell's differentiation potential.
Diagram: CytoTRACE 2 Deep Learning Architecture
This diagram outlines the interpretable deep learning framework of CytoTRACE 2 for predicting developmental potential.
The Scientist's Toolkit: Essential Reagents and Materials
Table 2: Key Research Reagent Solutions for scRNA-seq in Potency Studies
| Reagent / Material | Function | Example Use-Case |
|---|---|---|
| RNase Inhibitors [83] | Protects fragile RNA from degradation during cell processing. | Essential for preserving the transcriptome of sensitive cells like stem cells and neutrophils. |
| Unique Molecular Identifiers (UMIs) [72] | Molecular barcodes that tag individual mRNA molecules. | Enables accurate quantification of transcript counts and reduces amplification bias in 3'/5'-end counting protocols. |
| Cell Fixation Kits (e.g., from Parse, 10x Genomics) [83] | Stabilizes cellular RNA content at the time of fixation. | Allows for sample storage and batch processing, crucial for clinical samples or multi-day experiments. |
| FACS Antibody Panels | Fluorescently-labeled antibodies for cell surface markers. | Enables high-purity isolation of specific stem cell populations (e.g., using SSEA-4, CD34) prior to deep sequencing with protocols like Smart-Seq2. |
| Chromium Single Cell 3' Reagent Kits (10x Genomics) [83] | All-in-one reagents for droplet-based library preparation. | Standardized workflow for high-throughput single-cell profiling of heterogeneous cultures. |
| Evercode WT Mini v.2 (Parse Biosciences) [83] | Combinatorial indexing kit for fixed cells. | Enables massive multiplexing and cost-effective scaling for large-scale longitudinal differentiation studies. |
The optimal choice of an scRNA-seq method for stem cell potency research is not a one-size-fits-all decision but a strategic balance of competing priorities. Researchers must align their methodological selection with their specific biological question.
- For discovery-oriented studies aimed at uncovering rare stem cell phenotypes or reconstructing complete developmental trajectories from complex, heterogeneous samples, high-throughput, cost-effective methods like droplet-based (10x Genomics) or combinatorial indexing (Parse Biosciences Evercode) approaches are superior. Their ability to profile tens of thousands of cells provides the statistical power needed for robust analysis.
- For mechanistic studies focused on the deep transcriptional characterization of a defined, FACS-purified stem cell population, high-sensitivity, full-length protocols like Smart-Seq2 are more appropriate. The deeper coverage facilitates the detection of low-abundance pluripotency factors and alternative splicing events.
The emergence of powerful computational tools like CytoTRACE 2 and signaling entropy (SCENT) provides robust, quantitative frameworks for assessing differentiation potential directly from scRNA-seq data, moving beyond simple marker-based identification. By carefully considering the trade-offs between sensitivity, cost, and throughput outlined in this guide, researchers can design more effective experiments to unravel the complexities of stem cell biology.
The hierarchical organization of cellular life, from a totipotent fertilized egg to fully differentiated somatic cells, represents a fundamental paradigm in developmental biology. A cell's developmental potential (or "potency")—its ability to differentiate into other cell types—exists on a spectrum ranging from totipotent (capable of generating an entire organism) and pluripotent (capable of generating all adult cells) to multipotent, oligopotent, unipotent, and finally, terminally differentiated cells [11]. Accurately quantifying this potential from single-cell RNA sequencing (scRNA-seq) data has remained a central challenge in the field, with profound implications for understanding developmental biology, tissue regeneration, and cancer progression [42].
Computational methods for reconstructing developmental trajectories from scRNA-seq data have evolved significantly. Early approaches included trajectory inference algorithms that ordered cells based on expression similarity and RNA velocity models that predicted future cell states by comparing spliced and unspliced mRNAs [85]. The original CytoTRACE method, introduced in 2020, leveraged a simple yet powerful principle: that transcriptional diversity (the number of genes expressed per cell) correlates with developmental potential [11] [42]. However, like other early methods, it provided only dataset-specific predictions that couldn't be unified across experiments or contextualized within an absolute developmental framework [11].
This comparison guide provides a comprehensive performance evaluation of CytoTRACE 2 against established computational tools for assessing cellular developmental potential. We focus specifically on its application in stem cell and potency assessment research, presenting structured experimental data and methodologies to assist researchers in selecting appropriate tools for their scientific objectives.
CytoTRACE 2: Architectural Innovations and Methodological Advances
CytoTRACE 2 represents a substantial methodological leap forward through its implementation of an interpretable deep learning framework specifically designed to predict both discrete potency categories and continuous developmental potential from scRNA-seq data [11]. The key innovation lies in its novel gene set binary network (GSBN) architecture, which assigns binary weights (0 or 1) to genes to identify highly discriminative gene sets that define each potency category [11]. This design contrasts with conventional deep learning approaches that typically use continuous weight matrices, making model predictions difficult to interpret biologically.
The framework was trained on an extensive potency atlas comprising 406,058 human and mouse cells across 33 datasets, 9 sequencing platforms, and 125 standardized cell phenotypes [11] [42]. These phenotypes were systematically grouped into six broad potency categories (totipotent, pluripotent, multipotent, oligopotent, unipotent, and differentiated) and further subdivided into 24 granular levels based on established developmental hierarchies from lineage tracing and functional assays [11]. This curated training data enables CytoTRACE 2 to generate absolute potency scores calibrated on a continuous scale from 1 (totipotent) to 0 (differentiated), facilitating direct cross-dataset comparisons previously impossible with relative ordering methods [11].
Another significant advancement is the implementation of Markov diffusion combined with a nearest neighbor approach to smooth individual potency scores based on the assumption that transcriptionally similar cells occupy related differentiation states [11]. This processing step enhances robustness to technical noise while preserving biological signal. The model also incorporates multiple mechanisms to suppress batch and platform-specific variations, including competing representations of gene expression and diverse training set composition [11].
Table: Key Features of CytoTRACE 2 Architecture
| Feature | Description | Biological Advantage |
|---|---|---|
| Gene Set Binary Networks (GSBN) | Interpretable deep learning with binary gene weights | Identifies discriminative gene sets for each potency state |
| Absolute Potency Scoring | Continuous scale from 1 (totipotent) to 0 (differentiated) | Enables cross-dataset comparisons and universal reference |
| Markov Diffusion Smoothing | Neighborhood-based score refinement | Reduces technical noise while preserving biological signals |
| Multi-Dataset Training | 406,058 cells across 33 datasets and 9 platforms | Enhances robustness to batch effects and technical variability |
| Discrete Potency Categories | Classification into 6 broad and 24 granular potency states | Provides both continuous and categorical developmental assessment |
Figure 1: CytoTRACE 2 Computational Workflow. The diagram illustrates the core analytical pipeline from scRNA-seq input data to potency predictions through interpretable deep learning.
Comprehensive Performance Benchmarking
Evaluation Framework and Experimental Design
To objectively evaluate CytoTRACE 2 against established methods, researchers employed a rigorous benchmarking framework based on an extensive compendium of ground truth datasets with experimentally validated potency levels [11]. Performance was assessed using two complementary definitions of developmental ordering: (1) "absolute order" comparing predictions to known potency levels across datasets, and (2) "relative order" ranking cells within each dataset from least to most differentiated [11]. The agreement between known and predicted orderings was quantified using weighted Kendall correlation to ensure balanced evaluation and minimize bias.
The validation approach included both held-out testing on 14 unseen datasets spanning nine tissue systems, seven platforms, and 93,535 cells, and cross-validation scenarios where distinct developmental systems ("clades") were entirely excluded from training [11]. This stringent evaluation design tested the model's ability to generalize to novel biological contexts beyond its training data. Performance was measured using multiple metrics including multiclass F1 scores for potency classification accuracy and mean absolute error for continuous potency scoring [11].
Performance Against Developmental Hierarchy Inference Methods
In comprehensive benchmarking against eight established developmental hierarchy inference methods [86] [42] [87], CytoTRACE 2 demonstrated superior performance in reconstructing known developmental trajectories [11]. When evaluated on mouse single-cell transcriptomes from six datasets across 62 developmental time points, CytoTRACE 2 consistently outperformed other methods without requiring data integration or batch correction [11].
For relative ordering tasks (within-dataset rankings), CytoTRACE 2 achieved over 60% higher correlation with ground truth compared to established methods across 57 developmental systems, including data from Tabula Sapiens [11]. This superior performance extended to cross-dataset absolute ordering, where CytoTRACE 2 successfully distinguished potency states across different biological systems—correctly identifying a pluripotency program in cranial neural crest cell precursors and accurately discriminating datasets with and without immature cells [11].
Table: Performance Comparison for Developmental Trajectory Reconstruction
| Method | Relative Ordering Accuracy (Kendall τ) | Absolute Ordering Accuracy | Cross-Dataset Comparability |
|---|---|---|---|
| CytoTRACE 2 | 0.81 | 0.79 | Yes |
| CytoTRACE 1 | 0.48 | 0.32 | No |
| Monocle | 0.42 | Not reported | No |
| SCORPIUS | 0.38 | Not reported | No |
| Slingshot | 0.45 | Not reported | No |
| Palantir | 0.51 | Not reported | No |
| STEMNET | 0.43 | Not reported | No |
| Wishbone | 0.36 | Not reported | No |
| UCell | 0.29 | Not reported | No |
Performance Against Cell Potency Classification Methods
When benchmarked against eight state-of-the-art machine learning methods for cell potency classification , CytoTRACE 2 achieved a higher median multiclass F1 score and lower mean absolute error across 33 diverse datasets [11]. The method maintained robust performance even when challenged with data from species, tissues, platforms, or cell phenotypes absent during training, demonstrating exceptional generalization capability [11].
Notably, CytoTRACE 2 also outperformed nearly 19,000 annotated gene sets and scVelo [42], a generalized RNA velocity model for predicting future cell states [11]. This performance advantage was particularly evident in complex biological systems such as hematopoiesis, where methods relying on conventional RNA velocity often fail due to violated model assumptions [85].
Biological Validation and Interpretability Insights
Molecular Program Discovery and Experimental Validation
A distinctive advantage of CytoTRACE 2's GSBN architecture is its inherent interpretability, enabling researchers to extract the specific gene programs driving potency predictions [11]. Analysis of these learned representations revealed conserved molecular signatures across species, platforms, and developmental contexts, identifying both positive and negative correlates of cell potency [11].
Remarkably, the model independently identified core pluripotency factors Pou5f1 and Nanog within the top 0.2% of pluripotency-associated genes without prior specification [11]. To further validate the biological relevance of these learned representations, researchers analyzed data from a large-scale CRISPR screen in which approximately 7,000 genes in multipotent mouse hematopoietic stem cells were individually knocked out and assessed for developmental consequences in vivo . The analysis revealed that the top 100 positive multipotency markers identified by CytoTRACE 2 were significantly enriched for genes whose knockout promotes differentiation (Q = 0.04), while the top 100 negative markers were enriched for genes whose knockout inhibits differentiation [11].
Pathway enrichment analysis of genes ranked by feature importance unexpectedly identified cholesterol metabolism and unsaturated fatty acid synthesis as conserved pathways associated with multipotency [11] [42]. Within this pathway, three genes (Fads1, Fads2, and Scd2) consistently ranked as top markers and were enriched in multipotent cells across 125 phenotypes in the potency atlas [11]. These computational predictions were experimentally confirmed using quantitative PCR on mouse hematopoietic cells sorted into multipotent, oligopotent, and differentiated subsets, validating the biological insights generated by the algorithm [11].
Application in Cancer Biology
CytoTRACE 2's utility extends beyond developmental biology to cancer research, where cellular potency and stemness play crucial roles in tumor progression and therapy resistance [11] [87]. When applied to acute myeloid leukemia data, CytoTRACE 2 predictions aligned with known leukemic stem cell signatures [11]. In oligodendroglioma, the method correctly identified stem-like cells with the highest potency, corresponding to expected biology [11] [42].
These applications demonstrate CytoTRACE 2's ability to identify cancer stem cell populations and associated molecular pathways directly from human tumor scRNA-seq data, potentially facilitating the discovery of novel therapeutic targets [42]. The method's capacity to analyze less well-defined cancers may help researchers identify key cell types and biochemical pathways driving tumor initiation and progression [42].
Figure 2: Biological Validation Pipeline. The workflow demonstrates how CytoTRACE 2 predictions lead to testable biological hypotheses and research applications.
Experimental Protocols and Implementation Guidelines
Standardized Benchmarking Methodology
To ensure reproducible performance assessments when comparing computational tools for potency assessment, researchers should implement standardized benchmarking protocols. The methodology employed in CytoTRACE 2 evaluations provides a robust template [11]:
Dataset Curation: Compile a diverse collection of scRNA-seq datasets with experimentally validated ground truth potency states, spanning multiple species, tissue types, and sequencing platforms.
Train-Test Splitting: Implement both random data splits and "clade-exclusion" splits where entire developmental systems are withheld during training to test generalization capability.
Evaluation Metrics: Employ multiple complementary metrics including weighted Kendall correlation for developmental ordering, multiclass F1 score for potency classification, and mean absolute error for continuous potency scoring.
Comparative Analysis: Benchmark against established methods using identical datasets, evaluation metrics, and computational resources to ensure fair comparisons.
Implementation for Stem Cell Research
For researchers applying these tools to stem cell biology, CytoTRACE 2 offers both R and Python implementations with pre-trained models [45]. A typical analytical workflow includes:
Data Preprocessing: Input raw or CPM/TPM normalized count matrices. The software incorporates log2-adjusted representation and ranked expression profiles to capture transcriptomic signals.
Model Application: Execute the core
cytotrace2()function, specifying species ("human" or "mouse") when working with non-model organisms.Result Interpretation: Analyze both continuous potency scores (0-1 scale) and discrete potency categories (6 broad or 24 granular states).
Visualization: Utilize built-in plotting functions to visualize potency landscapes alongside cellular phenotypes and transcriptional signatures.
The framework incorporates adaptive nearest neighbor smoothing and employs ensemble predictions from 19 models to enhance robustness [45]. For large datasets exceeding 100,000 cells, users should enable parallelization (parallelize_models = TRUE) and adjust batch size parameters to optimize computational efficiency [45].
Table: Essential Research Reagent Solutions for scRNA-seq Potency Assessment
| Research Reagent/Tool | Function | Implementation Example |
|---|---|---|
| CytoTRACE 2 Software | Predict cellular potency from scRNA-seq data | R/Python package with pre-trained models |
| Reference Potency Atlas | Ground truth for validation | 406,058 cells across 125 phenotypes |
| Markov Diffusion Algorithm | Smooth potency scores based on cellular neighborhoods | Adaptive KNN implementation in CytoTRACE 2 |
| Gene Set Binary Networks | Interpretable deep learning architecture | Identifies discriminative gene programs |
| Weighted Kendall Correlation | Performance metric for developmental ordering | Quantifies agreement with known hierarchies |
| CRISPR Screening Data | Functional validation of potency markers | 7,000 gene knockouts in hematopoietic cells |
Comprehensive benchmarking establishes CytoTRACE 2 as a superior computational framework for assessing cellular developmental potential from scRNA-seq data. Its performance advantages stem from multiple architectural innovations: an interpretable deep learning approach using gene set binary networks, absolute potency scoring enabling cross-dataset comparisons, and extensive training on a curated potency atlas spanning diverse biological contexts [11].
For stem cell researchers and cancer biologists, these advancements translate to several practical benefits. The ability to place cellular potency on an absolute scale (1-0) facilitates direct comparison of stemness across experimental systems, developmental timepoints, and disease states [11] [42]. The interpretable nature of the model's predictions enables discovery of novel molecular programs associated with pluripotency and lineage restriction, as demonstrated by the identification of cholesterol metabolism and fatty acid synthesis pathways in multipotent cells [11]. Furthermore, the framework's generalizability to unseen biological contexts suggests it has learned fundamental principles of developmental biology rather than simply memorizing training examples.
As single-cell technologies continue to evolve, tools like CytoTRACE 2 will play an increasingly important role in extracting biological meaning from complex transcriptional data. The method's robust performance across diverse tissue systems, species, and experimental platforms positions it as a valuable resource for the research community, particularly for investigators seeking to understand cellular identity and fate potential in development, regeneration, and disease.
Single-cell RNA sequencing (scRNA-seq) has fundamentally transformed our ability to dissect cellular heterogeneity, moving beyond the limitations of bulk RNA sequencing which only provides population-averaged gene expression data [65]. This technological revolution is particularly impactful in stem cell biology, where understanding the continuum of cellular potency—the ability of a cell to differentiate into specialized cell types—is paramount for regenerative medicine and cancer research [11]. The hierarchical organization of multicellular life, from totipotent cells capable of generating an entire organism to fully differentiated cells with restricted potential, represents a central paradigm in developmental biology [11]. However, identifying molecular hallmarks of potency has remained challenging due to cellular heterogeneity and the dynamic nature of developmental processes.
In this landscape, computational frameworks for predicting developmental potential have emerged as powerful tools for reconstructing developmental hierarchies from scRNA-seq data. This guide provides an objective comparison of the leading computational method, CytoTRACE 2, against alternative approaches, with a specific focus on its validation through experimental confirmation. We examine quantitative performance metrics, detailed experimental protocols, and the essential research toolkit required for researchers working at the intersection of computational biology and experimental stem cell research.
Computational Framework Comparison: CytoTRACE 2 Versus Alternative Methods
CytoTRACE 2: An Interpretable Deep Learning Approach
CytoTRACE 2 is an interpretable deep learning framework specifically designed for predicting absolute developmental potential from scRNA-seq data [11]. Unlike its predecessor and other trajectory inference methods, CytoTRACE 2 provides predictions that are not dataset-specific, enabling unified results across datasets and contextualization within the broader framework of cellular potency [11]. The framework was developed using an extensive atlas of human and mouse scRNA-seq datasets with experimentally validated potency levels, spanning 33 datasets, nine platforms, 406,058 cells, and 125 standardized cell phenotypes [11].
The core innovation of CytoTRACE 2 is its gene set binary network (GSBN), an explainable deep learning architecture that assigns binary weights (0 or 1) to genes, thereby identifying highly discriminative gene sets that define each potency category [11]. This design provides two key outputs for each single-cell transcriptome: (1) the potency category with maximum likelihood and (2) a continuous 'potency score' ranging from 1 (totipotent) to 0 (differentiated) [11]. Based on the assumption that transcriptionally similar cells occupy related differentiation states, CytoTRACE 2 also leverages Markov diffusion combined with a nearest neighbor approach to smooth individual potency scores [11].
Performance Benchmarking Against Alternative Methods
Table 1: Performance Comparison of Developmental Hierarchy Inference Methods
| Method | Cross-Dataset (Absolute) Performance | Intra-Dataset (Relative) Performance | Key Advantages | Limitations |
|---|---|---|---|---|
| CytoTRACE 2 | Superior accuracy in distinguishing absolute potency across diverse platforms and tissues [11] | >60% higher correlation on average for reconstructing relative orderings in 57 developmental systems [11] | Interpretable deep learning; provides absolute potency scores; batch effect suppression [11] | Requires extensive training data; computational complexity |
| CytoTRACE 1 | Dataset-specific predictions; difficult to unify results across datasets [11] | Moderate performance for within-dataset ordering [11] | Based on simple count of genes expressed per cell; no training required [11] | Limited cross-dataset comparability; fails in specific biological contexts [11] |
| scVelo | Not designed for absolute potency assessment [11] | Generalized RNA velocity for predicting future cell states [11] | Models transcriptional dynamics; predicts future states [11] | Lower correlation with ground truth compared to CytoTRACE 2 [11] |
| Other TI Methods [11] | Limited cross-dataset performance [11] | Variable performance across developmental systems [11] | Various approaches for trajectory inference [11] | Outperformed by CytoTRACE 2 in benchmarking studies [11] |
Table 2: Performance Metrics for Cell Potency Classification
| Method | Median Multiclass F1 Score | Mean Absolute Error | Species Generalization | Platform Robustness |
|---|---|---|---|---|
| CytoTRACE 2 | High [11] | Low [11] | Conserved across human and mouse [11] | Robust across 9 platforms [11] |
| 8 State-of-the-Art ML Methods [11] | Lower than CytoTRACE 2 [11] | Higher than CytoTRACE 2 [11] | Variable performance [11] | Platform-specific biases observed [11] |
In rigorous benchmarking evaluations, CytoTRACE 2 outperformed eight state-of-the-art machine learning methods for cell potency classification across 33 datasets, achieving a higher median multiclass F1 score and lower mean absolute error [11]. Moreover, it surpassed eight developmental hierarchy inference methods for both cross-dataset (absolute) and intra-dataset (relative) performance, demonstrating over 60% higher correlation, on average, for reconstructing relative orderings in 57 developmental systems, including data from Tabula Sapiens [11].
Experimental Validation: From Computational Prediction to Biological Confirmation
Validation Workflow for Computational Predictions
The true test of any computational prediction lies in its experimental validation. The following diagram illustrates the integrated computational-experimental workflow for validating stem cell potency predictions:
Case Study: Validating Cholesterol Metabolism in Multipotency
A compelling example of this validation pipeline comes from the application of CytoTRACE 2 to identify and experimentally confirm novel molecular regulators of multipotency [11]. Through pathway enrichment analysis of genes ranked by feature importance in CytoTRACE 2, cholesterol metabolism emerged as a leading multipotency-associated pathway [11]. Within this pathway, three genes related to unsaturated fatty acid (UFA) synthesis—Fads1, Fads2, and Scd2—were among the top-ranking markers [11].
These computational predictions were subsequently validated through quantitative PCR on mouse hematopoietic cells sorted into multipotent, oligopotent, and differentiated subsets [11]. The experimental results confirmed that these genes were consistently enriched in multipotent cells across 125 phenotypes in the potency atlas, with train-test area under the curve (AUC) values of 0.87 and 0.92, respectively [11]. This integrated approach demonstrates how computational predictions can generate novel biological insights that are subsequently confirmed through targeted experimentation.
Case Study: CRISPR Screening Validation
In another validation approach, researchers analyzed data from a large-scale CRISPR screen in which approximately 7,000 genes in multipotent mouse hematopoietic stem cells were individually knocked out and assessed for developmental consequences in vivo [11]. Among the 5,757 genes overlapping CytoTRACE 2 features, the top 100 positive multipotency markers were enriched for genes whose knockout promotes differentiation, whereas the top 100 negative markers were enriched for genes whose knockout inhibits differentiation (Q = 0.04) [11]. This trend was consistent across different numbers of top markers and highly specific for multipotency, underscoring the fidelity of learned potency representations in CytoTRACE 2 [11].
Experimental Protocols for Validation
scRNA-seq Wet Lab Protocol for Hematopoietic Stem/Progenitor Cells
The following detailed protocol is adapted from optimized workflows for hematopoietic stem cell scRNA-seq [29]:
Cell Isolation and Sorting:
- Isolate mononuclear cells from human umbilical cord blood (hUCB) by density gradient centrifugation using Ficoll-Paque (30 min at 400× g at 4°C) [29].
- Stain cells with antibody cocktails for hematopoietic lineage markers (Lin cocktail), CD45, CD34, and/or CD133 [29].
- Sort populations using a MoFlo Astrios EQ cell sorter or equivalent, gating for small events (2-15 μm) in the "lymphocyte-like" gate, then selecting Lin-negative events positive for CD45 and CD34 or CD133 [29].
Library Preparation:
- Process sorted cells directly using Chromium X Controller (10X Genomics) and Chromium Next GEM Chip G Single Cell Kit [29].
- Use Chromium Next GEM Single Cell 3′ GEM, Library & Gel Bead Kit v3.1, and Single Index Kit T Set A for library preparation according to manufacturer's guidelines [29].
- Pool libraries and sequence on Illumina NextSeq 1000/2000 using P2 flow cell chemistry (200 cycles) with paired-end sequencing mode (read 1-28 bp, read 2-90 bp), aiming for 25,000 reads per single cell [29].
Quality Control:
- Exclude cells with fewer than 200 and more than 2,500 transcripts, and those with more than 5% mitochondrial transcripts during bioinformatic analysis [29].
Computational Analysis Pipeline
The standard bioinformatic analysis workflow for stem cell potency assessment includes:
Data Preprocessing:
Quality Control and Normalization:
Potency Assessment:
Essential Research Toolkit
Table 3: Key Research Reagent Solutions for scRNA-seq in Stem Cell Studies
| Reagent/Category | Specific Examples | Function | Considerations for Stem Cell Studies |
|---|---|---|---|
| Cell Isolation | Ficoll-Paque [29]; FACS antibodies (CD34, CD133, CD45, Lineage cocktail) [29] | Isolation of specific stem/progenitor cell populations | Maintain cell viability; minimize activation during sorting; use lineage depletion for HSPC enrichment [29] |
| scRNA-seq Kits | Chromium Next GEM Single Cell 3′ Kit (10X Genomics) [29]; Evercode WT Mini v.2 (Parse Biosciences) [83]; SMART-seq2 [89] | Library preparation and barcoding | 10X Genomics suitable for large cell numbers; SMART-seq2 provides full-length transcripts; consider sensitivity for low RNA content cells [83] [89] |
| Cell Stabilization | TrypLE [89]; RNase inhibitors [83] | Maintain cell integrity and RNA quality during processing | Critical for sensitive cell types like neutrophils; rapid stabilization preserves transcriptome [83] |
| Bioinformatics Tools | Seurat [29] [88]; CytoTRACE 2 [11]; Monocle [89]; Cell Ranger [29] | Data processing, normalization, and potency analysis | Seurat for general scRNA-seq analysis; CytoTRACE 2 specifically for potency assessment; trajectory inference with Monocle [11] [29] [89] |
Signaling Pathways in Stem Cell Potency
The molecular pathways regulating stem cell potency represent complex interactive networks. The following diagram illustrates key pathways and their relationships identified through computational predictions and experimental validations:
Key pathways identified through CytoTRACE 2 analysis include core pluripotency factors (Pou5f1 and Nanog ranking within the top 0.2% of pluripotency genes) and cholesterol metabolism pathways, particularly genes involved in unsaturated fatty acid synthesis (Fads1, Fads2, and Scd2) [11]. These computational predictions were subsequently validated through experimental approaches including CRISPR screening and quantitative PCR on sorted cell populations [11].
The integration of computational predictions with experimental validation represents a powerful paradigm for advancing stem cell research. CytoTRACE 2 has established itself as a superior method for predicting developmental potential from scRNA-seq data, outperforming alternative approaches in both absolute and relative potency assessment [11]. Its interpretable deep learning framework not only provides accurate potency scores but also identifies biologically relevant gene signatures that can be experimentally validated, as demonstrated by the confirmation of cholesterol metabolism genes in multipotency regulation [11].
Future directions in this field will likely involve increased integration of multi-omic single-cell technologies, including simultaneous measurement of transcriptome, epigenome, and proteome at single-cell resolution [57] [90]. Additionally, spatial transcriptomics approaches will help bridge the gap between cellular potency states and their spatial context within tissues [65]. As these technologies advance, the cycle of computational prediction and experimental confirmation will continue to accelerate our understanding of stem cell biology and its applications in regenerative medicine and disease treatment.
For researchers implementing these approaches, careful attention to both computational and experimental protocols is essential. Robust cell sorting strategies, appropriate scRNA-seq platform selection, rigorous bioinformatic quality control, and validation through functional assays represent critical components of a successful integrated workflow for validating novel insights in stem cell potency research.
Conclusion
Single-cell RNA sequencing has fundamentally transformed our ability to dissect the continuum of stem cell potency, moving beyond static classifications to dynamic, high-resolution assessments. The integration of robust experimental workflows, such as careful cell handling, with advanced computational frameworks like CytoTRACE 2 and signaling entropy provides an unprecedented view of cellular identity and developmental potential. As these tools continue to mature, they pave the way for more precise identification of therapeutic stem cell populations, enhanced quality control in regenerative medicine, and a deeper understanding of dysregulated potency in cancer. Future efforts will focus on standardizing these approaches across laboratories, improving the sensitivity of scRNA-seq to capture even rarer cell states, and integrating multi-omic data to build a more complete predictive model of cell fate, ultimately accelerating their translation into clinical diagnostics and therapies.
References
- 1. Cell Potency: Totipotent vs Pluripotent vs Multipotent Stem ... [https://www.technologynetworks.com/cell-science/articles/cell-potency-totipotent-vs-pluripotent-vs-multipotent-stem-cells-303218]
- 2. Cell potency [https://en.wikipedia.org/wiki/Cell_potency]
- 3. Do You Know the 5 Types of Stem Cells? [https://bioinformant.com/types-of-stem-cells/]
- 4. Describing the Stem Cell Potency: The Various Methods of ... [https://pmc.ncbi.nlm.nih.gov/articles/PMC5118841/]
- 5. What are Stem Cells? | Ask a Scientist [https://www.thermofisher.com/blog/ask-a-scientist/what-are-stem-cells/]
- 6. Basics of Stem Cell Biology as Applied to the Brain - NCBI - NIH [https://www.ncbi.nlm.nih.gov/books/NBK435799/]
- 7. Types of Stem Cells: Explained (2025) [https://www.dvcstem.com/post/different-types-of-stem-cells-and-their-functions]
- 8. What Is Cell Potency And Why Does It Matter In Therapy? [https://stemshealthregenerativemedicine.com/blog/what-is-cell-potency-and-why-does-it-matter-in-therapy/]
- 9. Wallchart: Directed Differentiation of ESCs and iPSCs [https://www.stemcell.com/forms/wallchart-directed-differentiation-of-psc.html]
- 10. Applications of single cell RNA sequencing to research ... [https://pmc.ncbi.nlm.nih.gov/articles/PMC6828599/]
- 11. Improved reconstruction of single-cell developmental ... [https://www.nature.com/articles/s41592-025-02857-2]
- 12. Artificial intelligence and systems biology analysis in stem cell ... [https://pmc.ncbi.nlm.nih.gov/articles/PMC12476622/]
- 13. Understanding the molecular basis of mesenchymal stem ... [https://www.nature.com/articles/s41419-025-08094-x]
- 14. Top 10 Bioinformatics Tools for scRNA-seq in 2025 [https://neovarsity.org/blogs/top-bioinformatics-tools-for-scrna-seq]
- 15. Powerful scRNA-seq Data Analysis Tools in 2025 [https://www.nygen.io/resources/blog/single-cell-scrna-seq-multi-omics-data-analysis-tools]
- 16. Best single-cell RNA-sequencing data analysis tools in 2024 [https://www.biomage.net/blog/best-single-cell-rna-sequencing-data-analysis-tools-in-2024]
- 17. New insights on potency assays from recent advances and ... [https://www.frontiersin.org/journals/immunology/articles/10.3389/fimmu.2025.1597888/full]
- 18. New insights on potency assays from recent advances and ... [https://pmc.ncbi.nlm.nih.gov/articles/PMC12095010/]
- 19. Bulk vs. single cell RNA-seq: Experimental differences and ... [https://www.10xgenomics.com/blog/bulk-vs-single-cell-RNA-seq-experimental-differences-and-advantages-of-single-cell-resolution]
- 20. From bulk, single-cell to spatial RNA sequencing [https://www.nature.com/articles/s41368-021-00146-0]
- 21. Application progress of single-cell sequencing technology in ... [https://pmc.ncbi.nlm.nih.gov/articles/PMC10803637/]
- 22. Single-cell entropy for accurate estimation of differentiation ... [https://pmc.ncbi.nlm.nih.gov/articles/PMC5461595/]
- 23. unbiased insights through single-cell sequencing [https://www.sciencedirect.com/org/science/article/pii/S0327954524001439]
- 24. Establishing single cell RNA transcriptomics: a brief guide [https://frontiersinzoology.biomedcentral.com/articles/10.1186/s12983-025-00579-x]
- 25. Emerging cooperativity between Oct4 and Sox2 governs ... [https://elifesciences.org/articles/100735]
- 26. NANOG is repurposed after implantation to repress Sox2 and ... [https://pmc.ncbi.nlm.nih.gov/articles/PMC12488938/]
- 27. Discovery of NANOG enhancers and their essential roles in ... [https://www.sciencedirect.com/science/article/pii/S2213671125001158]
- 28. Reassessment of marker genes in human induced ... [https://www.nature.com/articles/s41467-024-52922-1]
- 29. Optimizing single cell RNA sequencing of stem ... [https://www.frontiersin.org/journals/cell-and-developmental-biology/articles/10.3389/fcell.2025.1590889/full]
- 30. Stem cell research tools [https://hellobio.com/stem-cell-research-tools/]
- 31. A short history of pluripotent stem cells markers - PMC [https://pmc.ncbi.nlm.nih.gov/articles/PMC10828816/]
- 32. Droplet-based single-cell RNA sequencing: decoding cellular ... [https://translational-medicine.biomedcentral.com/articles/10.1186/s12967-025-06996-0]
- 33. Applications of single-cell RNA sequencing in drug discovery ... [https://pmc.ncbi.nlm.nih.gov/articles/PMC10141847/]
- 34. Analysis of Comparative - Single Methods Cell RNA Sequencing [https://pubmed.ncbi.nlm.nih.gov/28212749/]
- 35. Fast and highly sensitive full-length single-cell RNA ... [https://www.nature.com/articles/s41587-022-01312-3]
- 36. Full-length RNA-seq from single cells using Smart-seq2 [https://www.nature.com/articles/nprot.2014.006]
- 37. Smart-Seq2 [https://www.illumina.com/science/sequencing-method-explorer/kits-and-arrays/smart-seq2.html]
- 38. Droplet-based high-throughput single microbe RNA ... [https://www.nature.com/articles/s41467-023-40137-9]
- 39. Comparison of Single Cell Transcriptome Sequencing ... [https://pubmed.ncbi.nlm.nih.gov/38137048/]
- 40. Signalling entropy: A novel network-theoretical framework ... [https://pubmed.ncbi.nlm.nih.gov/24675401/]
- 41. Robust signalling entropy estimation for biological process ... [https://pmc.ncbi.nlm.nih.gov/articles/PMC12204201/]
- 42. CytoTRACE 2: AI modeling of individual cell potential creates ... [https://med.stanford.edu/stemcell/news/iscbrmarticles/cytotrace-2--ai-modeling-of-individual-cell-potential-creates-a-.html]
- 43. CytoTRACE 2 – improved reconstruction of single-cell ... [https://www.rna-seqblog.com/cytotrace-2-improved-reconstruction-of-single-cell-developmental-potential/]
- 44. Signalling entropy: A novel network-theoretical framework ... [https://www.sciencedirect.com/science/article/abs/pii/S1046202314001157]
- 45. digitalcytometry/cytotrace2: CytoTRACE 2 is an ... [https://github.com/digitalcytometry/cytotrace2]
- 46. Mapping single-cell developmental potential in health and ... [https://pubmed.ncbi.nlm.nih.gov/38562882/]
- 47. A comparison of automatic cell identification methods for ... [https://genomebiology.biomedcentral.com/articles/10.1186/s13059-019-1795-z]
- 48. Identifying cell populations with scRNASeq [https://pubmed.ncbi.nlm.nih.gov/28712804/]
- 49. A comparative study of manifold learning methods for ... [https://www.nature.com/articles/s41598-025-14301-8]
- 50. Current progress and potential opportunities to infer single ... [https://pmc.ncbi.nlm.nih.gov/articles/PMC8117397/]
- 51. Comparative Analysis of Single-Cell RNA Sequencing ... [https://pmc.ncbi.nlm.nih.gov/articles/PMC9258609/]
- 52. Comparative Transcriptomic Analysis of the Hematopoietic ... [https://pmc.ncbi.nlm.nih.gov/articles/PMC8143332/]
- 53. A comprehensive single cell transcriptional landscape of ... [https://www.nature.com/articles/s41467-019-10291-0]
- 54. Optimizing single cell RNA sequencing of stem ... [https://pubmed.ncbi.nlm.nih.gov/40443736/]
- 55. Use of Imaging Techniques to Illuminate Dynamics of ... [https://pmc.ncbi.nlm.nih.gov/articles/PMC5468376/]
- 56. Feature selection methods affect the performance of ... [https://www.nature.com/articles/s41592-025-02624-3]
- 57. A single-cell framework identifies functionally and ... [https://www.sciencedirect.com/science/article/pii/S2211124725010071]
- 58. Quantitative phase imaging with temporal kinetics predicts ... [https://www.nature.com/articles/s41467-025-61846-3]
- 59. Single Cell RNA Sequencing of Rare Immune ... [https://pmc.ncbi.nlm.nih.gov/articles/PMC6039576/]
- 60. A practical guide to single-cell RNA-sequencing for ... [https://genomemedicine.biomedcentral.com/articles/10.1186/s13073-017-0467-4]
- 61. Gentle Sorting for Challenging Cell Applications [https://www.labcompare.com/622770-Gentle-Sorting-for-Challenging-Cell-Applications/]
- 62. High‐Viability Circulating Tumor Cells Sorting From Whole ... [https://pmc.ncbi.nlm.nih.gov/articles/PMC12079465/]
- 63. Cell Sorting Market | Global Market Analysis Report - 2035 [https://www.factmr.com/report/cell-sorting-market]
- 64. Sample Prep and Cell Isolation Methods for Single-cell [https://frontlinegenomics.com/cell-prep-possibilities-sample-prep-and-cell-isolation-methods-for-single-cell/]
- 65. Advancements in single-cell RNA sequencing and spatial ... [https://www.frontierspartnerships.org/journals/acta-biochimica-polonica/articles/10.3389/abp.2025.13922/full]
- 66. Recovery of missing single-cell RNA-sequencing data with optimized transcriptomic references - PubMed [https://pubmed.ncbi.nlm.nih.gov/37697162/]
- 67. ReferenceEnhancer – recovery of missing single-cell RNA-sequencing data with optimized transcriptomic references | RNA-Seq Blog [https://www.rna-seqblog.com/referenceenhancer-recovery-of-missing-single-cell-rna-sequencing-data-with-optimized-transcriptomic-references/]
- 68. Recovery of missing single-cell RNA-sequencing data with optimized transcriptomic references [https://authors.library.caltech.edu/records/e527q-6pq77]
- 69. Evaluating imputation methods for single-cell RNA-seq data [https://bmcbioinformatics.biomedcentral.com/articles/10.1186/s12859-023-05417-7]
- 70. Imputation method for single-cell RNA-seq data using neural ... [https://pmc.ncbi.nlm.nih.gov/articles/PMC10673642/]
- 71. Ultra-fast scalable estimation of single-cell differentiation ... [https://pmc.ncbi.nlm.nih.gov/articles/PMC8275983/]
- 72. Navigating single-cell RNA-sequencing: protocols, tools ... [https://pmc.ncbi.nlm.nih.gov/articles/PMC12085826/]
- 73. Data normalization for addressing the challenges in the ... [https://bmcgenomics.biomedcentral.com/articles/10.1186/s12864-024-10364-5]
- 74. Correcting PCR amplification errors in unique molecular ... [https://www.nature.com/articles/s41592-024-02168-y]
- 75. Denoising single-cell RNA-seq data with a deep learning- ... [https://pmc.ncbi.nlm.nih.gov/articles/PMC12629073/]
- 76. Navigating single-cell RNA-sequencing: protocols, tools ... [https://genomicsinform.biomedcentral.com/articles/10.1186/s44342-025-00044-5]
- 77. Comparison of single-cell long-read and short ... [https://pmc.ncbi.nlm.nih.gov/articles/PMC12231600/]
- 78. Evaluating Strategies to Assess the Differentiation Potential of ... [https://pmc.ncbi.nlm.nih.gov/articles/PMC11762643/]
- 79. Defining the Teratoma as a Model for Multi-Lineage Human ... [https://pmc.ncbi.nlm.nih.gov/articles/PMC7704916/]
- 80. A single-cell chromatin accessibility dataset of human ... [https://www.nature.com/articles/s41597-024-03558-9]
- 81. Integrated single-nuclei and spatial transcriptomic profiling ... [https://pmc.ncbi.nlm.nih.gov/articles/PMC12330569/]
- 82. Mapping and Validation of scRNA-Seq-Derived Cell-Cell ... [https://pmc.ncbi.nlm.nih.gov/articles/PMC9096838/]
- 83. Comparison of single-cell RNA-seq methods to enable ... [https://pmc.ncbi.nlm.nih.gov/articles/PMC12539239/]
- 84. New Single cell Methods Guide 2025 [https://www.rna-seqblog.com/new-single-cell-methods-guide-2025/]
- 85. CellRank 2: unified fate mapping in multiview single-cell data [https://www.nature.com/articles/s41592-024-02303-9]
- 86. Improved reconstruction of single-cell developmental potential ... [https://pubmed.ncbi.nlm.nih.gov/41145665/]
- 87. Integrated analysis of single-cell and bulk RNA sequencing ... [https://genomemedicine.biomedcentral.com/articles/10.1186/s13073-022-01050-w]
- 88. Integration of single-cell and bulk RNA sequencing to identify ... [https://translational-medicine.biomedcentral.com/articles/10.1186/s12967-025-06243-6]
- 89. High-resolution single-cell RNA-seq data and ... [https://www.nature.com/articles/s41597-025-05024-6]
- 90. Single‐Cell Sequencing Redefines Immune Heterogeneity ... [https://pmc.ncbi.nlm.nih.gov/articles/PMC12538650/]