Manual vs. Automated Cell Counting in GMP: A Comprehensive Guide to Accuracy, Compliance, and Workflow Efficiency
This article provides a detailed comparison of manual and automated cell counting methods within the framework of Good Manufacturing Practice (GMP).
Manual vs. Automated Cell Counting in GMP: A Comprehensive Guide to Accuracy, Compliance, and Workflow Efficiency
Abstract
This article provides a detailed comparison of manual and automated cell counting methods within the framework of Good Manufacturing Practice (GMP). Tailored for researchers, scientists, and drug development professionals, it explores the foundational principles of cell counting, examines the application of various methodologies in GMP workflows, offers troubleshooting and optimization strategies for common challenges, and outlines rigorous validation approaches. The content synthesizes current standards and research to guide the selection and implementation of cell counting methods that ensure data integrity, product quality, and regulatory compliance in the production of advanced therapy medicinal products (ATMPs) and other cell-based therapeutics.
Cell Counting Fundamentals: Why Accuracy is Non-Negotiable in GMP
The Critical Role of Cell Counting in Cell Therapy Product Potency and Dosing
In the development and manufacturing of Cell Therapy Products (CTPs), cell counting is far more than a simple quantification step; it is a fundamental measurement that is critical to assessing product potency, quality, and efficacy [1]. Unlike conventional drugs, CTPs are living entities, and their therapeutic effect is intrinsically linked to the number of viable and functional cells administered to a patient [1]. Consequently, accurate cell counting is indispensable throughout the entire lifecycle of a CTP, from in-process monitoring during manufacturing to the determination of the final dose for patient treatment [2].
The critical importance of cell counting is reflected in its regulatory status. A 2025 analysis of US FDA-approved CTPs revealed that measurements of cell viability and count are the most commonly used category of potency tests, employed by 61% (19 out of 31) of the approved products [3]. With an average of 3.4 potency tests per product, the cell count often serves as a foundational release test, ensuring that each product batch contains a therapeutically relevant number of cells [3]. This places immense responsibility on researchers and manufacturers to select and validate a cell counting method that is not only fit-for-purpose but also compliant with current Good Manufacturing Practice (cGMP) standards [4] [5].
A Comparative Analysis of Cell Counting Methods
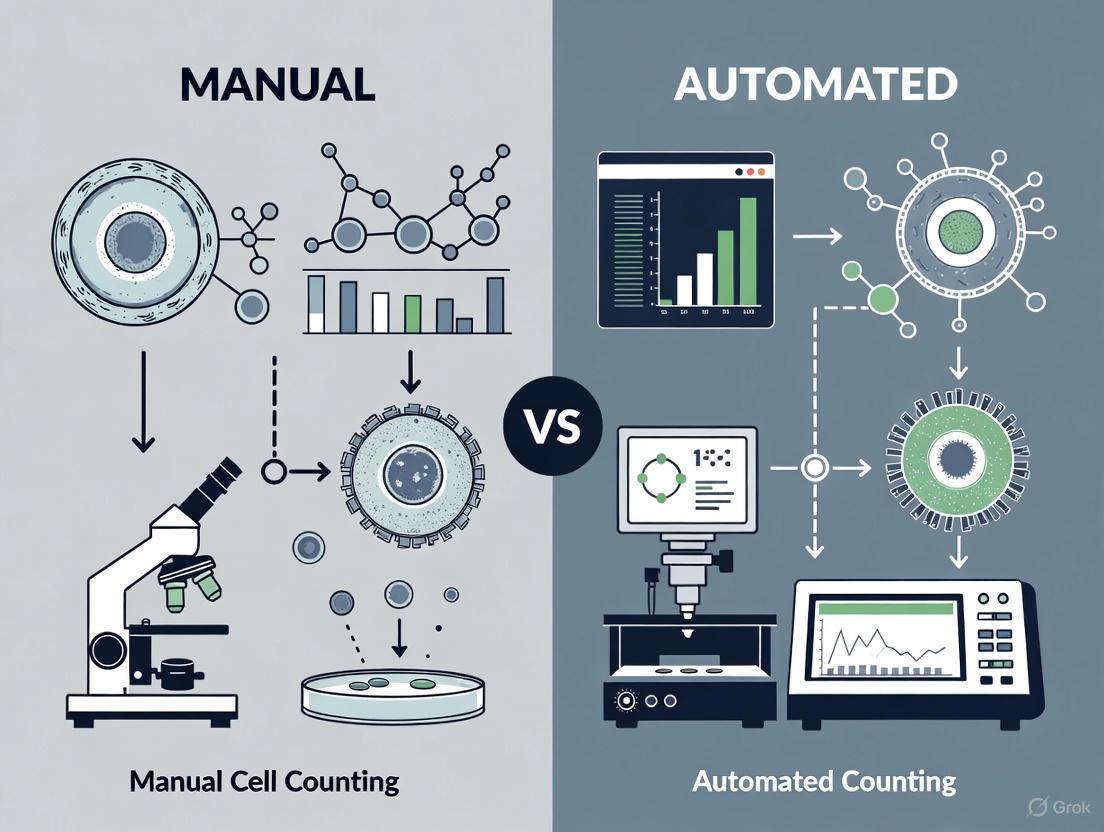
The two primary approaches to cell counting in GMP environments are manual counting (using a hemocytometer) and various types of automated counting. The choice between them has significant implications for data quality, operational efficiency, and regulatory compliance.
Manual Cell Counting with a Hemocytometer
The hemocytometer is a traditional, glass slide with etched grids that form counting chambers, allowing for manual cell enumeration under a microscope. It is often considered a reference method and is described in the European Pharmacopoeia [5] [6].
- Advantages: The method is low-cost, suitable for various cell types, and allows for direct visualization of the sample [1] [7].
- Disadvantages: It is highly time-consuming and susceptible to human error and subjectivity [1] [4] [7]. Variations in how individual operators define a cell or interpret stain intensity can lead to significant inter-operator variability [7]. Furthermore, statistical limitations arise from typically low cell counts (~100 cells), leading to a high inherent coefficient of variation [7].
Automated Cell Counting Methods
Automated systems offer a faster, more efficient alternative. The main technologies include image-based cytometers, flow cytometers, and impedance-based counters [1] [6].
- Advantages: Automated methods provide high speed, throughput, and precision [1] [4] [6]. They minimize human bias and can count thousands of cells in seconds, generating statistically more robust data [7] [6]. Many systems come with compliance-ready software that adheres to 21 CFR Part 11, a key requirement for cGMP [5] [6].
- Disadvantages: The initial instrument cost and ongoing expenses for consumables can be high [6]. Operators require specific training, and some systems may need regular calibration and maintenance, posing a risk of operational downtime [6]. The algorithms, while generally robust, may sometimes struggle with certain cell types, such as highly aggregated samples [6].
Table 1: Comparison of Common Cell Counting Methods in Biotechnology
| Method | Description | Key Advantages | Key Disadvantages |
|---|---|---|---|
| Hemocytometer [1] [7] | Manual counting using a specialized chamber under a microscope. | Low cost; direct visualization; suitable for various cells. | Time-consuming; high operator dependency; low statistical power. |
| Automated Image Analysis [1] [7] | Uses optical imaging and software algorithms to count and classify cells. | High speed, precision, and throughput; reduced human bias. | Relatively high cost; can be influenced by sample type/condition. |
| Flow Cytometer [1] | Cells in suspension are hydrodynamically focused and analyzed by lasers for multiple parameters. | Multi-parameter analysis (size, granularity, fluorescence); high sensitivity. | High cost; complex operation; requires technical expertise. |
| Impedance Cell Counter [1] | Detects changes in electrical resistance as cells pass through a small aperture. | High speed and precision; easy-to-use. | Unable to differentiate between live and dead cells; relatively high cost. |
Experimental Validation: Manual vs. Automated Counting in GMP
For a method to be implemented in a cGMP environment, it must undergo a formal validation process to demonstrate it is fit for its intended purpose. Validation follows ICH Q2(R1) guidelines, assessing parameters such as accuracy, precision, and linearity [4] [5].
Validation of an Automated Method for hiPSC Manufacturing
A key 2022 study directly compared the manual Bürker hemocytometer against the fluorescence imaging-based NucleoCounter NC-100 system for counting human induced pluripotent stem cells (hiPSCs), which are critical for advanced tissue replacement therapies [4] [8].
- Experimental Protocol: The validation strategy focused on several key performance parameters [4]:
- Accuracy: The closeness of agreement between the test value and a reference value.
- Precision: The closeness of agreement between a series of measurements, including intra-operator and inter-operator reproducibility.
- Linearity and Range: The ability of the method to produce results directly proportional to the cell concentration within a given range.
- Results and Data: The study found that the automated NucleoCounter system demonstrated higher precision than the manual method across all reproducibility tests [4]. It also showed excellent linearity and could be effectively used for the cGMP manufacturing of hiPSCs, offering a faster and more reliable solution for large-scale cell expansion [4] [8].
Validation of a Disposable Device in a GMP Setting
Another study validated the disposable Fast Read 102 slide against the Bürker chamber for counting mononuclear cells (MNCs) and mesenchymal stem cells (MSCs) [5].
- Experimental Protocol: The researchers first evaluated the accuracy of the Fast Read 102 against the reference Bürker chamber. Once accuracy was established, they proceeded to test the precision and linearity of the disposable device alone [5].
- Results and Data: All validation tests met the pre-established acceptance criteria, with coefficients of variation for precision under 10% for total cells and under 5% for viable cells [5]. The study concluded that the disposable device was accurate, precise, and ensured linearity, making it a suitable quality control method for a batch release test. It also offered practical advantages in a cleanroom environment by being single-use, thus avoiding the need to clean and sterilize glass chambers [5].
Table 2: Summary of Key Experimental Validation Findings
| Study & Cell Type | Compared Methods | Key Validation Outcome | Implication for GMP |
|---|---|---|---|
| hiPSCs [4] [8] | Bürker Hemocytometer vs. NucleoCounter NC-100 | Automated method showed superior precision (intra-/inter-operator reproducibility) and linearity. | Enables faster, more reliable counting for large-scale cGMP manufacturing. |
| MNCs & MSCs [5] | Bürker Hemocytometer vs. Fast Read 102 | Disposable device demonstrated accuracy, precision (CV <10%), and linearity. | Provides a valid, disposable counting option that simplifies cleanroom operations. |
The following workflow diagram illustrates the typical experimental and decision-making process for validating and selecting a cell counting method in a GMP context.
The Scientist's Toolkit: Essential Reagents and Materials
The selection of appropriate reagents and materials is critical for obtaining accurate and reproducible cell counts.
Table 3: Key Research Reagent Solutions for Cell Counting
| Item | Function/Description | Example Use Case |
|---|---|---|
| Bürker Chamber [5] | A non-disposable glass hemocytometer with a specific ruling pattern, used as a reference method. | Manual cell counting according to European Pharmacopoeia. |
| Disposable Counting Slides (e.g., Fast Read 102 [5]) | Pre-designed, single-use plastic slides with integrated chambers. | Avoids cleaning and cross-contamination in GMP cleanrooms. |
| Vital Dyes (e.g., Trypan Blue [7]) | A dye excluded by intact membranes, staining only dead cells blue. Used for viability assessment. | Distinguishing live/dead cells in manual hemocytometer counts. |
| Fluorescent Stains (e.g., Acridine Orange (AO)/DAPI [7]) | AO stains all nucleated cells (total count), while DAPI stains cells with compromised membranes (dead count). | Used in automated systems like the NucleoCounter for superior viability precision. |
| Density Gradient Media (e.g., Ficoll-Paque [9]) | A solution used to isolate specific cell populations, like mononuclear cells (MNCs), from heterogeneous mixtures. | Preparing samples for counting of specific cell types like MSCs. |
The transition from manual to automated cell counting represents a significant advancement in the robust and standardized manufacturing of CTPs. While the hemocytometer remains a valuable reference tool, its limitations in precision, operator dependence, and throughput make it less suitable for the scalable and reproducible demands of cGMP production [4] [7] [6]. Automated methods, particularly those based on fluorescence imaging, have been rigorously validated to offer higher precision, efficiency, and better integration with quality control systems, thereby directly supporting the critical role of cell counting in ensuring CTP potency and accurate dosing [4] [8].
Future efforts will continue to focus on standardizing cell counting measurements across the industry. Organizations like the National Institute of Standards and Technology (NIST) are actively developing guidance, such as the ISO 20391 series, and tools like COMET (Counting Method Evaluation Tool) to help laboratories quantify and improve their cell counting performance [2]. As the field of cell therapy evolves with increasingly complex products, the adoption of precise, validated, and automated counting methods will be non-negotiable for delivering safe and effective therapies to patients.
In the regulated environment of Good Manufacturing Practice (GMP), cell counting transitions from a routine lab task to a critical analytical procedure. For advanced therapy medicinal products (ATMPs) like cell therapies, the cell count constitutes a potency test, directly informing the therapeutic dose administered to patients [10]. The validation of cell counting methods according to international standards, such as the ICH Q2(R1) guideline, is therefore not optional but a mandatory requirement for product release [10] [8] [11]. This guide provides an objective comparison of manual and automated cell counting methods, focusing on their performance against the key GMP metrics of accuracy, precision, and viability.
GMP Requirements for Cell Counting Validation
Regulatory guidelines for ATMP production require a carefully designed and validated manufacturing process, where each step must be demonstrated to ensure product safety and efficacy [10]. For the analytical procedure of cell counting, this means establishing a validation master plan that typically assesses the following parameters as per ICH Q2(R1) [10] [11]:
- Accuracy: Expresses the closeness of agreement between a value accepted as a reference and the value found. In practice, this is often tested by comparing a new method against a pharmacopeia reference method, like the Bürker hemocytometer [10] [4].
- Precision: Expresses the closeness of agreement between a series of measurements from multiple sampling of the same homogeneous sample. This includes repeatability (intra-assay precision) and intermediate precision (inter-operator reproducibility) [10].
- Linearity and Range: The ability to obtain results directly proportional to the analyte concentration (cell concentration) within a given range, and the interval over which this linearity is maintained [10].
- Specificity: The ability to assess the analyte unequivocally in the presence of components such as impurities or matrix components (e.g., cell debris or magnetic beads) [11] [12].
Comparative Analysis: Manual vs. Automated Cell Counting
The following analysis compares the traditional manual hemocytometer with modern automated cell counters, focusing on performance data relevant to a GMP setting.
Performance Metrics Comparison
Table 1: Key Performance Metrics for Cell Counting Methods in GMP
| Metric | Manual Hemocytometer | Automated Image-Based Cytometers |
|---|---|---|
| Typical Intra-Assay Precision (CV) | Often >10-15% [7] | Consistently <5-10% [10] [8] |
| Inter-Operator Precision | High variability, significant user-dependent bias [7] [13] | High reproducibility, minimal operator-induced variation [8] [11] |
| Accuracy | Considered a reference method in pharmacopeia (e.g., European Pharmacopoeia) [8] [4] | Demonstrated accuracy comparable or superior to manual methods in validation studies [8] [11] |
| Viability Determination | Based on Trypan Blue exclusion; known to underestimate viability, dye is toxic [10] [7] | Uses fluorescent dyes (e.g., Acridine Orange/DAPI, PI); more precise dead cell discrimination [7] [11] |
| Sample Throughput | Low, laborious, and time-consuming [8] [13] | High, rapid results, suitable for monitoring large-scale expansion [8] [14] |
| Data Integrity & Compliance | Manual recording, prone to transcription errors; limited traceability [13] | Automated data capture; systems available with 21 CFR Part 11 compliant software for secure data and audit trails [10] [14] |
Analysis of Experimental Data
Validation studies conducted under a GMP framework provide concrete data supporting the performance claims for automated systems.
- Precision and Reproducibility: A study validating the NucleoCounter NC-100 for human induced pluripotent stem cells (hiPSCs) reported that the automated method demonstrated higher precision than the manual Bürker hemocytometer [8] [4]. Similarly, validation of the disposable Fast Read 102 slide showed that the precision reached by each operator had a coefficient of variation (CV) of less than 10% for total cells and under 5% for viable cells, meeting strict pre-established acceptance criteria [10].
- Linearity and Range: In the same study with the Fast Read 102, the best range of dilution to obtain a linear response was found to be between 1:8 and 1:128 [10]. Automated systems often have a broad dynamic range, with some like the LUNA-FX7 offering a detection range of 1×10⁴ to 5×10⁷ cells/mL, eliminating the need for many dilutions or concentration steps [14].
- Viability Assessment: A key advantage of fluorescence-based automated counters is the move away from Trypan Blue. Research indicates that fluorescent nuclear staining (e.g., Propidium Iodide or DAPI) improves the detection and measurement of viable cells compared to Trypan Blue, which is known to be toxic and can underestimate viability [7] [11].
Essential Experimental Protocols for Method Validation
For a method to be adopted in a GMP environment, it must undergo a rigorous validation protocol. The following outlines common experimental designs derived from the cited research.
Protocol 1: Validation of an Automated Cell Counter Against a Compendial Reference Method
This protocol is adapted from studies validating automated systems for hiPSCs and mononuclear cells [10] [8] [11].
1. Objective: To validate the accuracy, precision, and linearity of an automated cell counting method (e.g., NucleoCounter NC-100) against the manual Bürker hemocytometer as described in the European Pharmacopoeia.
2. Materials and Reagents:
- Cell suspension (e.g., hiPSCs, MNCs)
- Reference method: Bürker chamber and Trypan Blue solution
- Automated cell counter and its associated consumables (e.g., Via2-Cassette with Acridine Orange/DAPI)
- Appropriate diluent (e.g., PBS)
- Pipettes and calibrated instruments
3. Experimental Workflow: The following diagram illustrates the key stages of this validation protocol.
4. Procedure:
- Sample Preparation: Prepare a homogeneous suspension of the target cell type. Determine the approximate concentration to inform dilution series.
- Dilution Series: Create a series of dilutions (e.g., 1:1, 1:2, 1:3, 1:4, 1:5) to assess linearity and range [12]. The concentrations should span the expected operational range.
- Data Collection: For each dilution level, multiple replicates (n≥3) are analyzed by two or more operators. Each replicate is counted multiple times with both the reference and the automated method.
- Statistical Analysis: Calculate the mean, standard deviation, and coefficient of variation (CV%) for precision. Assess accuracy by comparing the average results from the automated method to the reference method. Perform regression analysis on dilution series data to confirm linearity.
Protocol 2: ISO 20391-2 Guided Suitability Assessment for Complex Workflows
This protocol uses a standardized approach to evaluate which counting method is best suited for specific stages of a cell processing workflow, particularly when samples contain impurities like magnetic beads [12].
1. Objective: To identify the most suitable cell counting method for specific cell types and processing stages (e.g., T-cells with attached magnetic beads) using a systematic, standard-guided approach.
2. Key Considerations:
- Sample Characteristics: Identify potential interferents (e.g., beads, debris, red blood cells).
- Parameter of Interest: Define if the primary need is viability, total count, or both.
- Process Stage: A method suitable for clean culture may fail post-isolation.
3. Experimental Workflow: The ISO 20391-2 standard provides guidance for a systematic evaluation, which can be visualized as a decision and evaluation flowchart.
4. Procedure:
- Sample Preparation: Obtain cells at different processing stages (e.g., post-thaw leukopak, post-Ficoll PBMCs, post-selection T-cells with beads).
- Experimental Design: For each sample type, generate a dilution series with multiple replicates. Assign random IDs to sample tubes to prevent analyst bias.
- Method Evaluation: Count all samples using the candidate methods (e.g., flow cytometry, image cytometry, impedance).
- Suitability Scoring: Evaluate methods based on predefined criteria such as precision (CV%), suitability in the presence of beads, and relative cost per sample, as illustrated in foundational studies [12].
The Scientist's Toolkit: Key Reagents and Materials
The selection of appropriate reagents and materials is critical for obtaining valid and reliable cell counting data in a GMP-compliant laboratory.
Table 2: Essential Research Reagent Solutions for Cell Counting
| Item | Function in Cell Counting | GMP/Validation Considerations |
|---|---|---|
| Bürker Chamber | A glass hemocytometer with a calibrated grid; a compendial reference method for manual counting [10]. | Requires meticulous cleaning and validation; not disposable. |
| Trypan Blue Solution | A vital dye used to stain dead cells with compromised membranes in manual counts [10]. | Known to be toxic to cells and can underestimate viability; requires careful control of incubation time [7]. |
| Via2-Cassette (for NucleoCounter) | A disposable cassette pre-loaded with Acridine Orange (total cells) and DAPI (dead cells) [7]. | Eliminates pipetting errors; provides a pre-calibrated volume for high reproducibility. |
| Propidium Iodide (PI) | A fluorescent DNA-binding dye that stains dead cells; used in various automated systems [11]. | Offers improved dead cell discrimination compared to Trypan Blue [11]. |
| Lysis Buffer (e.g., Tuerk Solution) | A solution used to lyse red blood cells in samples like whole blood or leukopaks prior to counting nucleated cells [10]. | Must be accounted for in the overall waste disposal plan. |
The transition from manual hemocytometers to automated, fluorescence-based cell counters represents a significant advancement in meeting the rigorous demands of GMP manufacturing for ATMPs. Quantitative validation data consistently shows that automated systems offer superior precision, reproducibility, and reliability while facilitating compliance with data integrity regulations [8] [11] [14]. While the manual method retains its status as a pharmacopeial reference, its inherent subjectivity and high operational variability make it less suitable for controlling critical process parameters in the production of transformative therapies like hiPSCs and CAR-T cells. For researchers and scientists, the strategic implementation of a validated automated cell counting method is not merely an operational improvement but a critical investment in ensuring the quality, safety, and efficacy of next-generation medicinal products.
In the development and manufacturing of cell-based therapies, accurate cell counting is a foundational analytical procedure that directly impacts product safety, efficacy, and regulatory compliance. The transition from manual to automated cell counting methods represents a significant evolution in quality control practices within Good Manufacturing Practice (GMP) environments. Manual cell counting using a hemocytometer has long been the standard method in many laboratories, but this approach faces substantial challenges when applied to complex biological samples characterized by significant cell heterogeneity, debris, and sample variability [7] [1]. These challenges are particularly pronounced in Advanced Therapy Medicinal Products (ATMPs), where cell counting measurements are used to evaluate cell viability and concentration to assess the quality and quantity of cells for critical processes including dosing decisions [15] [16].
The inherent vulnerabilities of manual counting—including human perception variability, pipetting errors, and limited statistical power—become exponentially problematic when analyzing samples with mixed cell populations, cellular debris, or atypical morphological characteristics [7] [1]. Automated cell counting systems using image cytometry or flow-based technologies offer potential solutions to these challenges by standardizing the counting process, reducing subjective interpretation, and enabling analysis of larger cell numbers for statistical significance [7] [15]. This comparison guide examines the performance of manual versus automated cell counting methods when confronted with the analytical challenges posed by complex cell samples in GMP-compliant research and manufacturing environments.
Fundamental Challenges in Cell Counting
Cell counting in therapy products faces multiple intertwined challenges that impact result accuracy. The presence of cellular debris, often from cryopreservation or sample processing, can obscure accurate cell identification and lead to overestimation or underestimation of counts [1]. Sample composition varies significantly, containing diverse cell populations, potential contaminants, and different suspension media, all affecting count integrity [1]. Distinguishing living from dead cells presents particular difficulty because cellular vitality exists on a spectrum, and distinctions are inherently user-defined when assessing membrane integrity, metabolic activity, or proliferative capacity [1].
Different cell types exhibit distinct characteristics in size, shape, density, and aggregation tendency. For instance, mesenchymal stem cells (MSCs) typically show greater size heterogeneity than T cells, while human-induced pluripotent stem cells (hiPSCs) tend to form dense, clumpy structures requiring different counting approaches [1]. The choice of suspension medium introduces another variable, with substances like dimethyl sulfoxide (DMSO) complicating fluorescence detection and potentially reducing observable cell quantities [1].
Method-Specific Vulnerabilities
Manual counting using hemocytometers suffers from several inherent limitations when processing complex samples. Human perception of what defines a cell varies significantly between operators, particularly when distinguishing cells from debris or determining viability based on stain intensity [7]. Volume, dilution, and pipetting errors during sample preparation introduce additional variability, as the space between the counting chamber and cover glass might increase when filled with liquid, causing volume underestimation and concentration overestimation [7]. Statistical limitations represent another concern, as manual counting typically analyzes only ~100 cells, resulting in a minimum 10% standard variation due to Poisson distribution limitations alone [7].
Automated counting systems face different challenges despite reducing human intervention. Instruments using impedance technology cannot differentiate between live and dead cells [1]. Image-based analyzers can be confounded by sample-specific issues such as the presence of magnetic beads used in cell isolation procedures, which can skew automated algorithms [15]. The presence of cellular aggregates or clumps presents difficulties for both image analysis and flow-based systems, potentially leading to undercounting or misclassification [1].
Table 1: Key Challenges in Cell Counting of Complex Samples
| Challenge Category | Specific Issue | Impact on Counting Accuracy |
|---|---|---|
| Sample Composition | Cellular debris from processing | Obscures cell identification; causes overestimation or underestimation |
| Mixed cell populations (e.g., PBMCs) | Viability differences between subpopulations; no universal method | |
| Suspension media (DMSO, salts) | Affects staining intensity and cell detection | |
| Cell Characteristics | Size heterogeneity (e.g., MSCs) | Challenges standardized detection parameters |
| Aggregation tendency (e.g., hiPSCs) | Leads to undercounting of actual cell numbers | |
| Presence of attachment beads | Interferes with automated algorithm detection | |
| Method Limitations | Human perception variability (manual) | Inconsistent cell/debris discrimination between operators |
| Small counting volume (manual) | High statistical variation due to limited events counted | |
| Algorithm sensitivity (automated) | Difficulties with non-standard morphologies or contaminants |
Performance Comparison: Manual vs. Automated Methods
Precision and Reproducibility
Multiple studies demonstrate significant advantages of automated counting systems in measurement precision, particularly for complex samples. In synovial fluid analysis, automated counters showed markedly lower coefficients of variation (3.4% and 2.9% for medium and high cellularity) compared to manual counting (14% and 10.7% respectively) [17]. Automated systems also demonstrated significantly lower interobserver variation compared to manual methods, highlighting their superiority for maintaining consistency across multiple operators - a critical requirement in GMP environments [17].
The precision advantage of automated systems becomes particularly evident when analyzing samples with inherent heterogeneity. A comparative evaluation of counting methods for primary cells at different processing stages in a cell therapy workflow found that automated image-based cytometers could maintain consistent performance across samples with varying compositions, while manual counting showed greater variability between operators [15]. This reproducibility is essential for ensuring comparability of results throughout development and manufacturing processes.
Accuracy in Viability Determination
Viability assessment presents particular challenges for both manual and automated methods, with significant implications for therapy product quality. Manual counting typically utilizes trypan blue exclusion, which is known to underestimate viability as the stain is toxic to cells and eventually stains all cells if not analyzed within 5-30 minutes [7]. The intensity of trypan blue staining can vary between samples, making consistent discrimination between viable and non-viable cells difficult, especially for different cell types [7].
Advanced automated systems address these limitations through improved staining methodologies. The NucleoCounter system, for example, uses acridine orange for total cell count and DAPI as a membrane-impermeable DNA-binding dye to define dead cells, increasing precision of viability determinations [7]. This approach provides more definitive fluorescent signals compared to the subtle color intensity variations that must be interpreted in trypan blue staining, leading to more consistent viability assessments across different cell types and sample conditions [1].
Handling of Specialized Sample Types
The performance gap between manual and automated methods widens when analyzing particularly challenging samples. For adipose-derived stromal vascular fraction (SVF) cells, automated counting with the Nucleocounter NC-100 provided consistent results across 302 patient samples processed under GMP rules, enabling standardization despite biological variability [18]. Similarly, in samples containing magnetic beads from cell isolation procedures, automated counting algorithms can be specifically optimized to account for bead presence, while manual counters struggle with consistent discrimination between beads and cells [15].
Samples with extensive debris, such as those derived from tumor digests or dissociated tissues, present particular difficulties for manual counting due to the subjective nature of debris exclusion. Automated systems can implement standardized size and fluorescence thresholds to consistently exclude debris particles, improving count accuracy for these challenging preparations [7] [1].
Table 2: Quantitative Performance Comparison Between Counting Methods
| Performance Metric | Manual Counting | Automated Image Cytometry | Flow Cytometry |
|---|---|---|---|
| Typical CV for Concentrated Samples | 10.7-14% [17] | 2.9-3.4% [17] | 2-5% [1] |
| Viability Determination Method | Trypan blue exclusion | AO/DAPI fluorescence | PI/7-AAD fluorescence |
| Limits of Detection | ~5×10^5 cells/mL [7] | ~1×10^4 cells/mL [1] | ~1×10^3 cells/mL [1] |
| Sample Throughput Time | 5-10 minutes/sample [7] | 1-2 minutes/sample [7] | 3-5 minutes/sample [1] |
| Debris Exclusion Capability | Subjective interpretation | Size/florescence thresholds [7] | Scatter/fluorescence gating [1] |
| Statistical Power (Cell Numbers) | Typically ~100 cells [7] | Thousands of cells [7] | Tens of thousands of cells [1] |
Experimental Approaches for Method Evaluation
Standardized Protocol for Method Comparison
The International Organization for Standardization (ISO) has developed standards specifically for evaluating cell counting methods. ISO 20391-2:2019 provides guidance on experimental design and statistical analysis to quantify counting method performance [15] [16]. The standard recommends a dilution series experimental design incorporating multiple dilution levels with replication to assess method performance across the measurable concentration range [16].
A typical evaluation protocol involves creating a dilution series containing at least five dilutions (e.g., 1:1, 1:2, 1:3, 1:4, 1:5) of the cell solution, with three sample tubes generated for each dilution level [15]. Samples should be randomized and each tube counted multiple times using the instruments and methods under evaluation. This approach allows simultaneous evaluation of precision (repeatability), coefficient of determination (R²), and proportionality index (PI) to assess counting method performance [16].
GMP-Compliant Validation Considerations
For GMP applications, cell counting method validation should demonstrate that the method is fit-for-purpose and meets predefined performance criteria. Key validation parameters include precision (repeatability and intermediate precision), linearity, range, and limit of detection [16]. Since there are currently no reference materials for live mammalian cells certified for cell concentration, accuracy is typically assessed indirectly through orthogonal comparative methods or by demonstrating proportionality across dilution series [16].
The experimental approach should evaluate performance using samples that reflect the actual complexity encountered in production, including assessments with different cell types, viability levels, and potentially interfering substances such as beads or debris [15]. For automated systems, instrument software algorithms should be validated for each specific cell type and sample matrix to ensure accurate discrimination between target cells and non-cellular particles [1].
Diagram 1: Comprehensive workflow for evaluating cell counting methods according to ISO 20391-2 guidelines, incorporating assessment of sample complexity factors.
Essential Reagents and Research Solutions
Research Reagent Solutions for Cell Counting
Successful cell counting in complex samples requires appropriate selection of reagents and consumables tailored to specific sample characteristics and counting methodologies.
Table 3: Essential Research Reagents and Their Applications in Cell Counting
| Reagent/Consumable | Function | Application Notes |
|---|---|---|
| Trypan Blue | Viability stain for manual counting | Stains dead cells with compromised membranes; time-sensitive due to cellular toxicity [7] |
| Acridine Orange | Fluorescent nucleic acid stain for total cells | Cell-permeable dye that binds primarily to DNA; used in automated systems [7] |
| DAPI | Membrane-impermeable DNA stain for dead cells | Efficient dead cell stain as living cells exclude low concentrations; blue fluorescence [7] |
| Propidium Iodide | Membrane-impermeable DNA stain for flow cytometry | Standard viability marker for flow cytometric analysis; red fluorescence [1] |
| Via2-Cassette | Integrated staining and measurement chamber | Pre-loaded with AO and DAPI; eliminates pipetting errors from sample handling [7] |
| Liberase/Celase | Enzymatic blend for tissue dissociation | Used for adipose tissue digestion in SVF isolation; GMP-compliant formulations available [18] |
| Magnetic Beads (CD3/CD28) | Cell isolation and activation | Used in T-cell selection for CAR-T therapies; can interfere with counting algorithms [15] |
| DPBS with Human Serum Albumin | Sample dilution and washing medium | Maintains cell viability while reducing interference with fluorescent stains [15] [18] |
Technology Platforms for Automated Counting
Several automated technology platforms have been developed to address the challenges of counting complex samples, each with distinct advantages and limitations. Image-based cytometers like the NucleoCounter systems use fluorescent microscopy with stable LED light sources and fixed emission filters to minimize variation [7]. These systems typically employ integrated cassettes that automatically stain samples and provide pre-calibrated measurement chambers to eliminate volume errors [7].
Flow-based cytometers offer multi-parameter analysis capabilities beyond simple counting, enabling characterization of cell size, granularity, and specific marker expression [1]. Recent advancements include microfluidic approaches that provide simplified, cost-effective solutions suitable for resource-limited settings while maintaining counting accuracy comparable to traditional hemocytometers [19]. Impedance-based counters like the traditional Coulter counter provide high precision for concentration measurements but cannot differentiate between live and dead cells without additional methodologies [1].
The comparison between manual and automated cell counting methods reveals a clear trajectory toward automation for GMP-compliant research and manufacturing environments, particularly when analyzing complex samples with inherent heterogeneity, debris, or specialized composition. While manual counting retains utility for quick assessments and certain applications, automated systems demonstrate superior precision, reproducibility, and efficiency for critical quality control measurements [7] [17].
The selection of an appropriate counting method should be guided by the principles outlined in ISO 20391-1, including consideration of the intended use of the counting result, thorough investigation of sample composition, understanding of assay principles, and evaluation of system capabilities [16]. For GMP applications, the chosen method must be properly validated following a fit-for-purpose approach that incorporates assessment of precision, linearity, and proportionality using samples that reflect production complexity [15] [16].
Implementation of automated counting systems represents a significant step toward standardizing ATMP manufacturing by reducing operator-dependent variability and providing statistically robust data from larger cell numbers [7] [18]. As cell therapies continue to evolve toward increasingly complex products, the corresponding analytical methods must advance accordingly to ensure accurate characterization of these living medicines. Through methodical evaluation, selection, and validation of counting methods that specifically address challenges of sample complexity, developers can enhance product quality and strengthen the scientific foundation supporting regulatory submissions for innovative cell-based therapies.
For researchers and drug development professionals, navigating the regulatory landscape is paramount when bringing cell-based products to market. The identity, strength, quality, and purity of medicines and advanced therapies are rigorously assessed against established standards to ensure patient safety and product efficacy [20]. Two primary frameworks govern these assessments: Pharmacopoeia guidelines, such as those from the United States Pharmacopeia (USP), and ISO standards from the International Organization for Standardization. USP standards are highly specific to the pharmaceutical and healthcare industries, often providing detailed procedures for testing chemical composition and physical properties [20]. In contrast, ISO standards offer a broader framework applicable to various sectors, including medical devices and pharmaceuticals, with a focus on quality management systems, risk management, and international best practices [20] [21].
In the context of Good Manufacturing Practice (GMP) research, compliance with these standards is not merely advisory. Good Manufacturing Practice (GMP) is a mandatory regulatory requirement for industries where product safety is paramount, such as pharmaceuticals and biologics, ensuring products are consistently produced and controlled according to quality standards [21] [22]. Adherence to relevant ISO standards or pharmacopoeial methods is a fundamental expectation within a GMP framework, supporting the rigorous documentation, traceability, and process validation that GMP requires [23] [8].
Core Standards and Guidelines: USP, ISO, and GMP
Understanding the distinct roles and applications of each regulatory body is essential for selecting the appropriate compliance strategy for your research and manufacturing processes.
The United States Pharmacopeia (USP)
The USP is a scientific nonprofit organization that establishes publicly available standards for medicines, dietary supplements, and food ingredients [20]. These standards are critical for regulatory compliance, particularly with the U.S. Food and Drug Administration (FDA).
- Scope and Focus: USP standards are predominantly focused on the pharmaceutical and healthcare sectors. They provide highly specific procedures for verifying Active Pharmaceutical Ingredients (APIs), assessing contaminants and impurities, and evaluating product stability and storage requirements [20].
- Key Chapters for Cell Analysis:
- <61> Microbial Enumeration Tests: Tests for the quantitative enumeration of mesophilic bacteria and fungi.
- <62> Tests for Specified Microorganisms: Detects the presence of specified microorganisms.
- <71> Sterility Tests: Describes tests applied to substances, preparations, or articles required to be sterile.
- <85> Bacterial Endotoxins Test: Covers the detection or quantification of endotoxins [20].
- Regulatory Status: USP compliance is critical within the United States and is considered complementary to FDA regulations. It does not involve a formal certification process; instead, companies demonstrate compliance through internal testing and third-party verification [20].
The International Organization for Standardization (ISO)
ISO is an international body that develops and publishes voluntary consensus standards to ensure quality, safety, and efficiency across a wide range of industries, including medical devices and pharmaceuticals [20] [21].
- Scope and Focus: ISO standards have a broader, more cross-industry application. They provide a framework for quality management systems and processes rather than prescribing specific test methods for individual products [20] [22].
- Key Standards for Cell Analysis:
- ISO 20391-2:2019 (Biotechnology — Cell counting — Part 2): Provides guidance on experimental design and statistical analysis to quantify counting method performance [12]. This standard is crucial for validating cell counting methods in development and production processes.
- ISO 11737-1 (Sterilization of health care products — Microbiological methods): Specifies requirements for the enumeration and microbial characterization of a medical device prior to sterilization [20].
- ISO 13485 (Medical devices — Quality management systems): A comprehensive standard for quality management systems specific to medical device manufacturers [22].
- ISO 17025 (General requirements for the competence of testing and calibration laboratories): Enables laboratories to demonstrate they operate competently and generate valid results [20].
- Regulatory Status: ISO standards are internationally recognized and often serve as a benchmark for entering global markets. Unlike GMP, ISO certification is voluntary and granted by accredited third-party bodies following an audit [20] [21] [22].
Good Manufacturing Practice (GMP) and Current GMP (cGMP)
GMP is a system for ensuring that products are consistently produced and controlled according to quality standards. It is mandated and enforced by regulatory authorities like the FDA and the European Medicines Agency (EMA) [21] [22]. cGMP emphasizes the adoption of modern and up-to-date technologies and systems.
- Scope and Focus: GMP applies to industries where product safety is critical, including pharmaceuticals, biologics, and advanced therapy medicinal products (ATMPs). Its primary goal is to ensure product safety, identity, and quality to protect public health [21] [8].
- Key Principles: GMP covers all aspects of production, from starting materials and premises to equipment and personnel training. It requires rigorous documentation of every production step, stringent record-keeping, and traceability [21] [22].
- Regulatory Status: GMP compliance is a legal requirement, verified through inspections by regulatory authorities. Non-compliance can result in serious consequences, including product recalls, warning letters, or import bans [21] [22].
The following diagram illustrates the relationship between these frameworks in the context of developing and manufacturing a cell-based product:
Diagram Title: Interplay of Standards in Cell Product Development
Direct Comparison: Manual vs. Automated Cell Counting in Regulated Environments
The choice between manual and automated cell counting carries significant implications for data integrity, regulatory compliance, and operational efficiency in GMP research.
Performance and Compliance Comparison
The table below summarizes a direct comparison based on validation studies and regulatory guidance.
| Feature | Manual Hemocytometer | Automated Cell Counters |
|---|---|---|
| Governing Principles | Pharmacopoeia (as a reference method); fundamental technique [8] [24] | ISO 20391-2 for validation; used with manufacturer's protocols [12] |
| Accuracy & Precision | Highly dependent on operator skill and experience; higher variability [8] [12] | Higher precision and reproducibility; reduces human error [8] |
| Data Output | Basic cell count and viability (if using dye) [24] | Count, viability, cell size distribution, aggregation data [24] |
| Throughput | Slow (10-30 minutes per sample) [24] | Fast (approximately 30 seconds per sample) [24] |
| Documentation & Traceability | Manual record-keeping; prone to transcription errors | Automated data capture; built-in audit trails compliant with 21 CFR Part 11 [23] |
| Validation Approach | Often considered the reference method in validation studies [8] | Requires rigorous validation against a reference method for the specific cell type [8] [12] |
| GMP/Data Integrity Risk | Higher risk due to subjectivity and manual documentation | Lower risk when systems are equipped with electronic records and audit trails [23] |
Experimental Validation Data
A 2024 study validating an automated method for cGMP manufacturing of human induced pluripotent stem cells (hiPSCs) provides compelling quantitative data. The study compared the fluorescence imaging-based NucleoCounter NC-100 system against the manual Bürker hemocytometer as a reference method, following ICH Q2(R1) validation principles [8].
The results demonstrated that the automated method showed higher precision than the manual method for both accuracy and inter-operator reproducibility [8]. This is critical in a GMP environment where consistency and reliability of data are non-negotiable. The study concluded that the automated method could be used more effectively than the manual one for hiPSC cell counting, paving the way for cGMP facilities manufacturing these cells for clinical use [8].
Another study highlights the importance of using a structured framework, like that provided in ISO 20391-2, to evaluate cell counting method performance. This standard guides researchers in designing experiments with varying dilutions and replicates to statistically quantify parameters like the proportionality index and coefficient of variation (%CV) across different counting methods and complex sample types, such as cells with attached magnetic beads [12].
Implementing a Compliant Cell Counting Method
Transitioning to a validated, GMP-compliant cell counting workflow involves strategic planning and a thorough understanding of regulatory expectations.
Workflow for Method Integration and Suitability Testing
The following workflow, adapted from guidance in the search results, outlines a systematic approach for evaluating and implementing a new cell counting method in a regulated lab environment [12]:
Diagram Title: Cell Counting Method Evaluation Workflow
Essential Research Reagent Solutions
The table below details key reagents and materials used in cell counting protocols, particularly in the context of method validation and GMP-compliant production.
| Item | Function & Importance in Regulated Context |
|---|---|
| Viability Dyes (e.g., Trypan Blue, Acridine Orange) | Distinguish live from dead cells based on membrane integrity. Dye concentration, staining time, and consistency are critical for reproducible viability results [24]. |
| Fluorescent Markers (e.g., 7-AAD, Antibodies) | Used in flow cytometry or imaging-based counters for more precise viability assessment or phenotypic analysis. Requires validation of staining protocols [25] [24]. |
| Counting Beads | Surrogate materials used for instrument qualification and method validation studies, as they provide a consistent and traceable standard [25]. |
| Reference Cell Lines (e.g., K562) | Well-characterized cells, often from a master cell bank, used as target cells in potency assays (e.g., NK cell cytotoxicity) and for benchmarking counting method performance [25]. |
| Standardized Buffer Solutions | Used for sample dilution and washing. Consistency in buffer composition (e.g., PBS with HSA) is essential to avoid introducing variability in cell counts [12]. |
Key Considerations for GMP Compliance
When deploying cell counters in a GMP environment, several specific features and procedures must be addressed:
- Instrument Qualification: GMP requires that equipment is suitable for its intended use. This is confirmed through Installation (IQ), Operational (OQ), and Performance (PQ) Qualification. Vendors often provide kits and services to facilitate this process [23].
- Data Integrity: Systems must comply with regulations like 21 CFR Part 11, which stipulates requirements for electronic records and electronic signatures. This includes secure login, audit trails that record all user actions, and data protection [23].
- Standardized Operating Procedures (SOPs): Detailed SOPs must be established for the operation, cleaning, and maintenance of the cell counter to ensure consistency and compliance [22].
- Operator Training: Personnel must be adequately trained on both the instrument operation and the relevant SOPs, with training records maintained [22].
The regulatory landscape for cell counting in GMP research is defined by the complementary yet distinct roles of Pharmacopoeia guidelines, which provide specific test methods, and ISO standards, which offer a framework for quality management and method validation. The decisive shift from manual hemocytometry to automated cell counting is driven by the latter's superior precision, efficiency, and inherent capabilities for maintaining data integrity.
For researchers and drug development professionals, the path to compliance is clear: investing in robust automated technologies is only the first step. A deeper commitment is required to rigorously validate these methods against recognized standards like ISO 20391-2 and to operate them within a GMP-quality system that prioritizes equipment qualification, comprehensive documentation, and personnel training. By integrating these principles, laboratories can ensure the reliability of this fundamental measurement, thereby supporting the development of safe and effective cell-based therapies.
A Deep Dive into Cell Counting Technologies: From Hemocytometer to Advanced Image Cytometry
In Good Manufacturing Practice (GMP) research, particularly for cell therapy products and biologics manufacturing, accurate cell counting is a critical quality control step. It is essential for standardizing culture conditions, monitoring cell growth, and ensuring precise dosing in clinical applications [1]. The manual hemocytometer method represents the traditional cornerstone of cell quantification, providing a fundamental technique against which modern technologies are often validated. This method, which involves visually counting cells under a microscope using a specialized slide, is prized for its direct sample visualization and low equipment cost [26].
The persistence of the hemocytometer in regulated environments is notable, even as automated methods gain prominence. Understanding its principles, stains, and traditional applications is crucial for evaluating its suitability against automated alternatives for specific GMP workflows. This guide objectively compares the manual hemocytometer with automated cell counters, focusing on performance metrics, experimental data, and applicability within a quality-focused framework.
Principles of the Manual Hemocytometer
Device Design and Operating Principle
A hemocytometer is a precision-engineered glass microscope slide featuring a counting chamber with an etched grid of perpendicular lines. The most common design is the Improved Neubauer chamber, though other patterns like Burker chambers are also in use [26]. The core principle relies on a defined chamber volume to calculate cell concentration. The grid is typically divided into nine large squares, each measuring 1 mm². The central large square is further subdivided into 25 smaller squares, each of which contains 16 of the smallest squares, facilitating systematic counting of cells of various sizes [27] [28].
The chamber depth is fixed at 0.1 mm. When the sample is loaded and covered with a specific coverslip, capillary action creates a chamber with a precise volume. For a single large (1 mm²) square, the volume is calculated as: 1 mm² (Area) x 0.1 mm (Height) = 0.1 mm³ = 1 x 10⁻⁴ mL [27]. This known volume is the foundation for converting a cell count into a concentration value.
The Trypan Blue Exclusion Staining Mechanism
The trypan blue exclusion assay is the standard method for simultaneously determining total and viable cell concentration on a hemocytometer. This method leverages a fundamental biological difference between live and dead cells: membrane integrity.
- Viable Cells: Possess an intact cell membrane that acts as a barrier, actively excluding the trypan blue dye. Under the microscope, these cells appear unstained and bright [29].
- Non-Viable Cells: Have a compromised or ruptured plasma membrane, allowing the trypan blue dye to passively diffuse into the cytoplasm. Once inside, the dye binds to intracellular proteins, rendering the cells a distinctive dark blue color [26] [29].
It is critical to note that trypan blue is toxic to cells. Analysis must be completed within 5 to 30 minutes of staining to prevent dye uptake by otherwise viable cells, which would lead to an underestimation of viability [7]. For higher precision in viability determination, especially with automated systems, fluorescent dyes like DAPI (which stains DNA in cells with permeable membranes) are often used as a more reliable alternative [7].
Detailed Experimental Protocol for Manual Counting
The following step-by-step protocol ensures accurate and reproducible results when using a hemocytometer with trypan blue staining.
Materials and Reagent Preparation
Table 1: Essential Research Reagents and Materials for Manual Cell Counting
| Item | Function | Specification/Note |
|---|---|---|
| Hemocytometer | Precision chamber for cell counting | Improved Neubauer is most common [28]. |
| Specialized Coverslip | Covers counting chamber | Thicker than standard coverslips to overcome liquid surface tension [30]. |
| Trypan Blue Solution | Viability stain; distinguishes live/dead cells | 0.4% solution; note toxicity requires rapid assessment post-staining [7] [29]. |
| Cell Culture Medium | Suspension medium for cells | Can influence staining; PBS may reduce cell counts compared to culture medium [1]. |
| Microscope | Visualization of cells | 10x objective is standard; phase-contrast can enhance distinction [27]. |
| Tally Counter | Aids in accurate counting of cells | Reduces human error in tracking counts [26]. |
Step-by-Step Workflow
- Hemocytometer Preparation: Clean the chamber and the specialized coverslip with 70% ethanol. Moisten the coverslip and affix it to the hemocytometer. The appearance of Newton's refraction rings indicates proper adhesion and a correctly seated coverslip, which is essential for achieving the correct chamber volume [26].
- Sample Preparation and Staining: a. Create a homogeneous cell suspension by gently but thoroughly pipetting the culture to avoid concentration gradients [28]. b. Mix the cell suspension with 0.4% trypan blue at a 1:1 ratio (e.g., 10 µL of cells + 10 µL of trypan blue) [29]. Gently mix by pipetting.
- Chamber Loading: Using a micropipette, transfer approximately 10 µL of the stained cell suspension to the edge of the hemocytometer's V-shaped well. The liquid is drawn underneath the coverslip by capillary action. Care must be taken not to overfill or underfill the chamber [27] [30].
- Microscopic Counting: a. Place the loaded hemocytometer on the microscope stage and bring the grid into focus using a 10x objective. b. Systematically count the cells within specific squares. A common and statistically sound approach is the "logical count," which involves counting the cells in the four large corner squares and the central large square [28]. c. Employ consistent rules for cells touching boundary lines to avoid double-counting. A standard practice is to count cells touching the top and right borders and exclude those touching the bottom and left borders [26] [28] [30]. d. Count live (unstained) and dead (blue-stained) cells separately.
Diagram 1: The step-by-step workflow for manual cell counting using a hemocytometer.
Calculation of Cell Concentration and Viability
After counting, apply the following formulas to determine cell concentration and viability, correcting for the trypan blue dilution factor.
Total Cell Concentration (cells/mL):
Total cells/mL = (Total cells counted / Number of squares counted) × Dilution Factor × 10⁴ [27] [30]
Viable Cell Concentration (cells/mL):
Viable cells/mL = (Viable cells counted / Number of squares counted) × Dilution Factor × 10⁴
Percentage Viability:
% Viability = (Number of viable cells / Total number of cells) × 100% [26] [29]
Example Calculation: If you counted a total of 500 cells (450 viable, 50 dead) in 5 squares (the four corners and the center) with a 1:1 dilution:
- Total cells/mL = (500 / 5) × 2 × 10⁴ = 2.0 × 10⁶ cells/mL
- Viable cells/mL = (450 / 5) × 2 × 10⁴ = 1.8 × 10⁶ cells/mL
- % Viability = (450 / 500) × 100% = 90%
The 10⁴ multiplication factor is derived from the chamber volume: 0.1 mm³ = 10⁻⁴ mL. To express concentration per mL (1 mL), you multiply the count per chamber by 1 / 10⁻⁴, which equals 10⁴ [27].
Performance Comparison: Manual vs. Automated Cell Counting
The transition towards automated cell counting is driven by the need for higher throughput, greater reproducibility, and reduced subjectivity in GMP environments. The table below summarizes key performance metrics based on experimental data.
Table 2: Quantitative Performance Comparison of Cell Counting Methods
| Parameter | Manual Hemocytometer | Automated Cell Counters | Supporting Experimental Data |
|---|---|---|---|
| Accuracy & Precision | Low precision; high inter-operator variability (CV ≥15% is average) [7]. | High precision; low inter-operator variability (CV <5-15%) [31]. | A study showed user-to-user variability was "much higher" for hemocytometer counts compared to an automated Countess II instrument [31]. |
| Time per Sample | ~5 minutes per sample [31]. | ~10 seconds to 2.5 minutes per sample [31] [32]. | Counting 5 samples/day can save ~10-15 hours/month by switching to automated methods [31]. |
| Viability Determination | Relies on subjective interpretation of trypan blue intensity [7]. | Uses quantitative algorithms or fluorescent dyes (e.g., AO/DAPI) for objective viability [7]. | Trypan blue is known to underestimate viability; DAPI increases precision [7]. Validation studies show automated methods provide equivalent results to manual [32]. |
| Cost | Low initial equipment cost; high long-term personnel time cost [33]. | Higher initial investment; lower long-term operational cost, especially with reusable slides [31]. | Estimated cost of $4 USD per manually counted sample highlights personnel cost [32]. |
| Sample Volume | ~10-20 µL loaded [26] [29]. | ~20 µL for some systems; 500 µL for others like Vi-CELL XR [32]. | Smaller sample volume in hemocytometer may increase statistical error [7]. |
| Handling of Clumpy Cells | Subjective and challenging; analyst must decide how to count clumps. | Advanced image algorithms can resolve cell boundaries within clumps [31]. | Algorithms can accurately count clumps of even more than five cells [31]. |
Beyond the quantitative metrics, each method offers different advantages and constraints.
Table 3: Subjective and Operational Factors in Cell Counting
| Factor | Manual Hemocytometer | Automated Cell Counters |
|---|---|---|
| Ease of Use & Training | Requires significant training to minimize subjectivity; skill-dependent [33]. | Minimal training; user-friendly operation reduces dependency on operator skill [33]. |
| Objectivity | High subjectivity in defining a cell and interpreting viability stain [7]. | High objectivity; software uses consistent, pre-set parameters for every analysis [7] [31]. |
| Data Obtained | Basic data: total cells, viability. | Rich data: concentration, viability, average cell size, size distribution, fluorescence intensity [31]. |
| Flexibility | Highly flexible; can adapt counting rules for different cell types and debris [26]. | Constrained by software settings and compatible stains; may struggle with non-standard cell morphologies [32]. |
Critical Factors Influencing Counting Accuracy
Several factors are crucial for obtaining reliable data, especially in a GMP context where results must be accurate and reproducible.
- Statistical Significance of Cell Count Number: Manual counting often involves a low number of counted cells (e.g., ~100 cells) to save time. According to Poisson statistics, counting only 100 cells introduces a minimum standard deviation of 10% (√100 = 10) due to random sampling error alone [7]. Automated counters image thousands of cells, dramatically reducing this statistical error.
- Sample Preparation: A homogeneous cell suspension is critical. Improper resuspension creates concentration gradients, leading to inaccurate counts [28]. Dilution errors are another common source of inaccuracy. The optimal cell concentration for a hemocytometer count is between 2.5×10⁵ and 2.5×10⁶ cells/mL; samples outside this range should be concentrated or diluted [28].
- Subjective Cell Identification: Human perception of what defines a cell, particularly in samples with significant debris or irregular morphology, is a major source of variation. Different analysts may apply different criteria, leading to poor inter-operator reproducibility [7].
Diagram 2: Primary sources of error contributing to high variability in manual hemocytometer counts.
The manual hemocytometer method, with its foundational principle of direct visual counting and trypan blue exclusion, remains a valuable technique in life sciences research. Its low upfront cost and flexibility ensure its continued presence in labs. However, a objective performance comparison reveals significant limitations for GMP research, where precision, reproducibility, and efficiency are paramount.
The data shows that manual counting is highly susceptible to human error and subjectivity, leading to variability that can compromise the quality and consistency of cell-based products [7] [33]. Automated cell counters address these shortcomings by providing rapid, objective, and statistically robust measurements, generating more reliable data for critical decisions in drug development and cell therapy manufacturing [31] [32].
For GMP workflows, the choice of method should be risk-based. The hemocytometer may suffice for basic culture maintenance where high precision is not critical. However, for critical quality attribute (CQA) testing, such as determining the viable cell dose of a cell therapy product, automated counting methods offer the traceability, reduced variability, and data integrity essential for regulatory compliance and patient safety [1]. The initial investment in automation is justified by long-term gains in data quality, operational efficiency, and overall confidence in cell-based processes.
Automated cell counting has become indispensable in modern biomedical research and biomanufacturing, replacing manual hemocytometers with precise, reproducible, and efficient systems. In the context of Good Manufacturing Practice (GMP) for advanced therapies like CAR-T cells, accurate cell counting is a Critical Quality Attribute (CQA) for identity and purity, directly impacting product dosage and patient safety [34]. The automated cell counters market is experiencing significant growth, driven by the rapid adoption of cell therapies and expanded funding for life-science research [35]. While manual counting persists in low-budget or training scenarios, its susceptibility to human error and low throughput renders it unsuitable for regulated, high-volume environments [24].
This guide objectively compares the three dominant automated cell counting technologies: image-based analysis, flow cytometry, and electrical impedance. We will evaluate their performance specifications, experimental protocols, and applicability within GMP and research frameworks, supported by quantitative data and procedural details to inform researchers, scientists, and drug development professionals.
Core Technologies at a Glance
Image-Based Cell Counting utilizes digital microscopy and sophisticated image analysis algorithms. Cells are introduced onto a slide or into a microfluidic chamber, and a camera captures high-resolution images. Software then identifies and counts individual cells based on parameters like contrast, size, and shape. Stains like Trypan Blue or fluorescent dyes (e.g., Acridine Orange, Propidium Iodide) are often used to differentiate live and dead cells [36] [24]. Advanced systems employ AI-powered declustering algorithms to count cells in complex samples and can also perform confluency analysis [37] [36].
Flow Cytometry, particularly Fluorescence-Activated Cell Sorting (FACS), is a high-parameter technology. Cells in suspension are hydrodynamically focused to pass single-file past a series of lasers. As each cell intersects the laser light, it scatters the light and, if labeled with fluorochromes, emits fluorescence at specific wavelengths. Optical detectors capture these signals, providing multi-parametric data on cell size, granularity, and the presence of specific biomarkers [38]. This makes it powerful for immunophenotyping but also complex and costly for simple cell counts.
Electrical Impedance Counting (also known as the Coulter principle) is a label-free method. Cells are suspended in an electrically conductive fluid and drawn through a small aperture. As a cell passes through, it displaces the electrolyte and momentarily increases the electrical impedance. Each impedance pulse corresponds to a cell, and the amplitude of the pulse is proportional to the cell's volume [38]. Multi-frequency impedance measurements can also provide information on membrane integrity and internal composition [38].
Visualizing the Core Operational Principles
The following diagram illustrates the fundamental working principles of the three core cell counting technologies.
Comparative Performance Data Analysis
Quantitative Technology Comparison
The following table summarizes the key performance metrics and characteristics of the three automated cell counting technologies, providing a direct, data-driven comparison.
Table 1: Performance and Feature Comparison of Automated Cell Counting Technologies
| Feature | Image-Based Analysis | Flow Cytometry (FACS) | Electrical Impedance |
|---|---|---|---|
| Primary Principle | Digital imaging & AI analysis [24] | Laser scattering & fluorescence detection [38] | Electrical resistance change (Coulter principle) [38] |
| Key Outputs | Count, viability, size, confluency, morphology [37] [36] | Multiparametric phenotyping, count, viability [38] | Cell concentration, size distribution [38] |
| Viability Assessment | Yes (via trypan blue or AO/PI staining) [36] | Yes (via fluorescent viability dyes) | Indirectly via "opacity" at high frequencies [38] |
| Sample Throughput | Fast (~30 seconds/sample) [24] | Very High (tens of thousands of cells/sec) [38] | High (tens of thousands of cells/sec) [38] |
| Cell Size Range | Typically 2-400 µm, model-dependent [36] | 1-100 µm, adaptable with effort [38] | Wide: sub-µm to millimeters [38] |
| Multiplexing Ability | Low to Moderate (brightfield & 1-2 fluorescence channels) [36] | Very High (up to 20+ parameters) [38] | Limited to impedance-derived parameters [38] |
| Label-Free | No (typically requires stain for viability) | No (requires labels for phenotyping) | Yes [38] |
| Approx. Upfront Cost | $5,000 - $50,000 [24] | $50,000 - $1,000,000+ [38] | <$100,000 [38] |
| GMP Compliance | Available (21 CFR Part 11-ready systems) [36] | Common in GMP environments | Easily integrated for process monitoring [38] |
Application-Specific Performance Validation
Rigorous validation studies demonstrate the performance of these technologies in real-world scenarios. For instance, the Quantella platform, a smartphone-based image analysis system, was validated against the gold standard of flow cytometry. Across diverse cell types, including primary red blood cells and adherent cell lines, Quantella reported deviations of less than 5% from flow cytometry data, with over 90% accuracy in cell identification by analyzing more than 10,000 cells per test [37].
In flow cytometry, advanced automated gating algorithms like UNITO have been developed to reduce labor-intensive manual analysis. UNITO transforms cell data into bivariate density images and uses a segmentation model to identify cell populations. When compared to a consensus of at least four experienced immunologists, UNITO's performance deviated from the human consensus by no more than any individual expert, achieving human-level performance in gating tasks [39].
Impedance-based systems excel in specific niches, particularly where label-free, real-time monitoring is advantageous. Their ease of integration into microfluidic systems makes them ideal for in-line quality control, such as monitoring cell electroporation efficiency or bioprinting quality [38]. A novel approach called Ionic Cell Microscopy even combines microfluidic impedance cytometry with generative AI to reconstruct high-fidelity cell images from impedance signals alone, achieving a 91% accuracy in distinguishing cancer cells and a Mean Structural Similarity Index (MSSIM) of 0.97 for reconstructed images [40].
Experimental Protocols for Technology Validation
Protocol for Validating an Image-Based Cell Counter
The following workflow outlines the key steps for validating an image-based automated cell counter using a validation slide, a method noted for its superiority over bead-based standards due to stability and consistent distribution [41].
Detailed Methodology:
- Acquisition of Validation Slide: Procure a validation slide specific to the instrument model (e.g., Logos Biosystems LUNA series validation slides). These slides contain a stable, homogeneous layer of beads or fixed cells with a factory-certified count value [41].
- Instrument Calibration: Ensure the instrument is installed according to manufacturer specifications. For GMP environments, a full Installation Qualification/Operational Qualification (IQ/OQ) package should be completed, which may involve using such slides and specific reagents [36].
- Sample Analysis: Load the validation slide into the cell counter. Select the appropriate validation protocol or application. Initiate the automated analysis, which involves autofocus, image capture, and algorithm-based counting.
- Data Collection and Comparison: The instrument software will output a count result. Compare this result to the factory-certified value provided with the slide. Calculate the deviation.
- Acceptance Criteria: The instrument passes validation if the counted value falls within the predefined tolerance range specified by the manufacturer or internal quality procedures (e.g., ±10%). If it fails, technical service may be required for maintenance and recalibration [36] [41].
Protocol for Cell Viability Analysis via Flow Cytometry
A common application of flow cytometry in cell therapy manufacturing is assessing CAR-T cell viability and identity. The following is a generalized protocol for a viability and immunophenotyping assay.
Detailed Methodology:
- Sample Preparation: Harvest cells from culture and wash with PBS. Adjust the cell concentration to approximately 1x10^7 cells/mL.
- Staining:
- Viability Staining: Resuspend the cell pellet in a viability dye (e.g., Propidium Iodide (PI) or a fixable viability dye) and incubate for 5-15 minutes in the dark. PI penetrates cells with compromised membranes (dead cells) [36].
- Surface Marker Staining: Add fluorescently conjugated antibodies against relevant surface markers (e.g., anti-CD3 for T cells, anti-CAR detection reagent) to the same tube. Incubate for 20-30 minutes in the dark at 4°C.
- Washing and Fixation: Wash the cells twice with cold flow cytometry staining buffer to remove unbound antibodies. The cells can be fixed with a 1-4% paraformaldehyde solution if analysis is not immediate.
- Flow Cytometric Acquisition: Resuspend the cells in an appropriate buffer and acquire data on the flow cytometer. Set up the instrument using compensation beads to account for fluorescence spillover between channels.
- Gating and Analysis:
- Use a bivariate plot of FSC-A vs. SSC-A to gate on the main cell population and exclude debris.
- Apply a singlet gate using FSC-H vs. FSC-A to exclude cell doublets.
- Gate on viability dye-negative cells to select the live population.
- Within the live cells, analyze the fluorescence of the antibody channels to determine the percentage of CD3+ and CAR+ cells, which are critical CQAs for identity and purity [34]. Automated gating software like UNITO can be applied here to standardize analysis [39].
The Scientist's Toolkit: Essential Research Reagents and Materials
Table 2: Key Reagents and Materials for Automated Cell Counting
| Item | Function | Application Notes |
|---|---|---|
| Trypan Blue | Viability stain for brightfield image counters. Dead cells with compromised membranes take up the blue dye [36]. | Common, inexpensive; used in manual hemocytometry and many automated image-based systems [24]. |
| Acridine Orange (AO) / Propidium Iodide (PI) | Fluorescent viability stains for image counters and flow cytometry. AO stains all nuclei (green), PI stains only dead cell nuclei (red) [36]. | Provides a more accurate viability count than Trypan Blue, especially in the presence of debris. |
| Antibody Panels | Conjugated antibodies target specific cell surface proteins (e.g., CD3, CD19) for phenotyping [34]. | Essential for flow cytometry to identify and characterize specific cell populations in a heterogeneous sample. |
| Validation Slides | Slides with a fixed number of beads or cells for verifying instrument accuracy and precision [41]. | Superior to liquid beads for validation due to stability and even distribution, critical for GMP QC. |
| Microfluidic Flow Cells | Disposable or reusable chambers that hold the sample for analysis in image-based or impedance systems [37]. | Designs vary; some are rinsable for re-use (e.g., Quantella [37]), while others are single-use to prevent cross-contamination. |
| Sheath Fluid | Inert fluid used in flow cytometers to hydrodynamically focus the sample stream for single-cell interrogation. | A core consumable for flow cytometry operation. |
Implementation in GMP and Research Workflows
Selecting the appropriate technology depends heavily on the application's specific requirements, particularly in a GMP context where documentation and reliability are paramount.
For Routine Cell Culture and Bioprocessing: Image-based cell counters offer an excellent balance of cost, speed, and data richness (viability, size, confluency). Their compliance-ready features (21 CFR Part 11) make them suitable for QC labs in biomanufacturing [36] [35]. The reduced plastic waste from systems with reusable slides (e.g., CellDrop DirectPipette technology) is also a significant operational and environmental benefit [36].
For Cell Therapy Manufacturing and Deep Immunophenotyping: Flow cytometry remains the gold standard. It is indispensable for quantifying CAR expression, detecting impurity populations, and performing potency assays like cytokine release profiling [34]. Its main drawbacks are high cost, complexity, and the need for specialized personnel.
For Real-Time, Label-Free Process Monitoring: Impedance-based technologies have a unique advantage. They can be integrated directly into bioreactors as in-line sensors to provide continuous, automated data on viable cell density, enabling real-time process control in bioproduction [35] [38]. Their label-free nature also simplifies sample preparation.
In conclusion, the choice between image-based, flow cytometry, and impedance technologies is not a matter of identifying a single "best" option, but rather of matching the technology's strengths to the specific needs of the experiment or production process. Image-based systems provide a versatile workhorse for most counting needs, flow cytometry delivers unparalleled detail for characterization, and impedance offers unique capabilities for integrated, real-time monitoring. A thorough understanding of their comparative performance, as outlined in this guide, is essential for making an informed decision that ensures data integrity, efficiency, and compliance in both research and GMP environments.
In the tightly regulated world of Good Manufacturing Practice (GMP) research, particularly for cell and gene therapies, accurate cell viability assessment has evolved from a routine lab procedure to a mission-critical function with direct impact on therapeutic efficacy and patient safety. With over 2,000 active cell and gene therapy clinical trials worldwide, precise cell quantification has become essential for ensuring dose accuracy, viability, and therapeutic consistency [42]. The global cell counting market's projected growth to USD 19.83 billion by 2033 reflects this increased emphasis on precision cell analysis [43]. Within this context, the methodological choice between traditional trypan blue exclusion and modern fluorescent staining techniques represents a fundamental decision point that affects everything from basic research reproducibility to compliance in biomanufacturing. This comparison guide objectively examines the performance characteristics of these competing viability assessment methods, with particular focus on the acridine orange (AO) and 4',6-diamidino-2-phenylindole (DAPI) fluorescent system that is gaining prominence in GMP environments for its accuracy and reproducibility advantages over traditional approaches.
Technical Mechanisms: How Each Method Detects Cell Viability
Trypan Blue Exclusion Principle
The trypan blue method operates on a straightforward exclusion principle where this diazo dye is excluded from entering cells with intact plasma membranes. Cells with compromised membranes, characteristic of dead or dying cells, allow the dye to penetrate and stain the intracellular components a distinctive blue color [44]. Under brightfield microscopy, viable cells appear transparent with a bright white center surrounded by a sharp dark ring, while non-viable cells display uniform blue-black staining [44]. This method is best suited for samples with minimal debris, such as tissue culture cells trypsinized from a plate or flask, as debris can be mistakenly identified as cells and lead to overestimation of viability [44]. A significant limitation of trypan blue is its time-dependent toxicity; viable cells are eventually stained if not analyzed within 5 to 30 minutes, depending on sample conditions, which can lead to underestimation of viability [7].
Fluorescent AO/DAPI Staining Mechanism
The AO/DAPI fluorescence method employs a dual-stain mechanism that provides distinct identification of different cell populations based on membrane integrity and nucleic acid content. Acridine orange (AO) is a cell-permeable dye that binds to nucleic acids and stains all nucleated cells, causing them to fluoresce green [44] [45]. DAPI is a membrane-impermeable DNA-binding dye that only enters cells with compromised membranes, staining them blue [7] [46]. When used in combination, this approach allows clear differentiation: live nucleated cells fluoresce green from AO staining, dead nucleated cells are identified by blue DAPI fluorescence, and cellular debris remains non-fluorescent [44] [47]. The mechanism is particularly effective because the dyes target different cellular components and have distinct emission spectra (AO: ~525 nm green; DAPI: ~461 nm blue) when excited at their specific wavelengths (AO: ~505 nm; DAPI: ~365 nm) [7] [46].
Figure 1: Comparative Mechanisms of Viability Staining Methods. The diagram illustrates the fundamental differences in how fluorescent AO/DAPI staining and trypan blue exclusion distinguish between live and dead cells based on membrane integrity and staining properties.
Comparative Performance Data: Quantitative Analysis
Time-Course Viability Assessment
A comprehensive time-course study comparing viability measurements of Jurkat cells incubated at room temperature revealed significant methodological differences. The experiment tracked viability over 168 hours using four detection methods: PI staining, AO/PI staining, automated trypan blue counting, and manual trypan blue hemocytometer counting [48]. The results demonstrated that as cell viability decreased over time, trypan blue exclusion methods consistently reported higher viability percentages compared to fluorescence-based methods. At the 24-hour time point, trypan blue measurements showed approximately 80% viability, while AO/PI or PI methods showed 70% viability [48]. By the end of the time trial, both manual and automated trypan blue methods reported total cell concentrations more than two times lower than fluorescence-based detection methods, suggesting that trypan blue undercounts dead cells and fails to detect cells in late apoptotic states with compromised membranes [48]. Statistical analysis using a two-sample T-test at the 12-hour time point confirmed that AO/PI was comparable to PI staining method (p > 0.05), while AO/PI was significantly different from trypan blue counting (p ≤ 0.05) [48].
Prepared Viability Mixtures Study
To further investigate method accuracy, researchers created standardized cell mixtures with known viability percentages by combining heat-killed (100% non-viable) and fresh (100% viable) Jurkat cells [48]. The experiment prepared samples at 0%, 25%, 50%, 75%, and 100% viability ratios and measured them using three detection methods: PI staining, automated trypan blue counting, and manual trypan blue counting [48]. In these controlled mixtures where ground truth viability was known, fluorescence-based methods demonstrated superior accuracy in matching expected viability values, while trypan blue methods showed deviation from expected values, particularly in intermediate viability ranges [48]. The brightfield images of trypan blue-stained heat-shocked Jurkat cells showed a clear distinction between live and dead cells, with dead cells exhibiting tight, dark, and well-defined morphology, suggesting that trypan blue performs best with freshly killed cells but loses accuracy with naturally dying cells in culture [48].
Table 1: Comparative Performance of Viability Assessment Methods in Controlled Studies
| Performance Metric | Trypan Blue | AO/DAPI Fluorescence | Experimental Context |
|---|---|---|---|
| Viability Reporting | Overestimates by ~10-15% [48] | Accurate to expected values [48] | Time-course study of Jurkat cells |
| Dead Cell Detection | Significantly undercounts (p ≤ 0.05) [48] | Accurate enumeration [48] | Comparison at 12-24 hour time points |
| Concentration Measurements | Gradual decrease over time [48] | Consistent results [48] | Total cell concentration tracking |
| Debris Differentiation | Poor, often misidentified as cells [44] | Excellent, debris non-fluorescent [44] | Samples with high debris content |
| Time Dependency | 5-30 minute window before toxic effects [7] | Stable staining over time [48] | Time-course staining stability |
Methodological Protocols: Standardized Procedures for GMP Environments
Trypan Blue Exclusion Protocol
The trypan blue exclusion protocol begins with preparing a 0.4% trypan blue solution in phosphate-buffered saline (PBS) [48]. A small aliquot of cell suspension (typically 10-20 μL) is mixed with an equal volume of trypan blue solution [48]. The mixture is incubated for approximately 1-2 minutes at room temperature, taking care not to exceed 5 minutes to avoid dye toxicity effects on viable cells [7]. Immediately after incubation, a small volume (10-20 μL) of the mixture is loaded into a hemocytometer chamber or automated cell counter chamber for analysis [44]. For manual counting, viable (unstained) and non-viable (blue-stained) cells are counted in predetermined squares of the hemocytometer, and viability percentage is calculated as (viable cell count / total cell count) × 100 [7]. The entire process should be completed within 5-30 minutes of staining, as trypan blue is toxic to cells and will gradually penetrate viable cells over time, artificially reducing viability measurements [7].
AO/DAPI Fluorescence Staining Protocol
The AO/DAPI fluorescence staining protocol varies slightly depending on whether manual or automated counting systems are used. For automated systems like the NucleoCounter with Via2-Cassette technology, the process involves loading a cell sample into a pre-stained cassette containing immobilized acridine orange and DAPI [7]. The cassette is then inserted into the instrument, which automatically acquires and analyzes fluorescence images [7]. For manual fluorescence methods, stock solutions of AO and DAPI are prepared, with DAPI typically prepared as a 14.3 mM (5 mg/mL) stock solution in deionized water or dimethylformamide, which can be stored at 2–6°C for up to 6 months or at ≤–20°C for longer periods [49]. Working solutions are prepared by diluting the stock solution in PBS to achieve a 300 nM DAPI stain solution [49]. The cell sample is mixed with the AO/DAPI working solution and incubated for 1-5 minutes protected from light [49]. The stained sample is then transferred to a counting chamber and analyzed using fluorescence microscopy with appropriate filter sets (DAPI excitation/emission: ~358/461 nm; AO excitation/emission: ~505/525 nm) [49] [7].
Figure 2: Experimental Workflows for Viability Assessment Methods. The diagram compares the standardized procedures for both trypan blue exclusion and AO/DAPI fluorescence staining, highlighting critical time constraints for trypan blue and light protection requirements for fluorescence methods.
Application in Complex Samples: PBMCs and Challenging Matrices
The performance differences between trypan blue and AO/DAPI fluorescence methods become particularly pronounced when analyzing complex biological samples. Peripheral blood mononuclear cells (PBMCs), for example, are difficult to quantify using brightfield techniques such as trypan blue due to the high background of non-nucleated red blood cells that are not differentiated by the dye [44]. Conversely, measuring these samples using AO/PI is straightforward and accurate because within these complex samples, nucleated cells are easily identified by green fluorescence (live) or red fluorescence (dead) against a background of non-fluorescing cells [44]. This specific identification of nucleated cells in the presence of large numbers of non-nucleated cells and cellular debris removes the subjectivity associated with colorimetric dyes like trypan blue [44]. Similar advantages have been demonstrated for other challenging sample types including whole blood, bone marrow, bronchoalveolar lavage, tumor digests, and primary samples [48]. The fluorescence method's ability to specifically identify nucleated cells while ignoring non-nucleated cells and debris makes it particularly valuable in GMP environments where samples often come from complex biological sources rather than clean cell culture systems.
Table 2: Method Performance Across Different Sample Types
| Sample Type | Trypan Blue Performance | AO/DAPI Fluorescence Performance | Key Considerations |
|---|---|---|---|
| Clean Cell Cultures (e.g., CHO cells) | Good for rapid assessment [44] | Excellent, comparable results [44] | Minimal debris enables trypan blue accuracy |
| PBMCs & Blood Samples | Poor, high background from RBCs [44] | Excellent, specific nucleated cell detection [44] | Fluorescence ignores non-nucleated cells |
| Samples with Debris | Poor, debris misidentified as cells [44] | Excellent, debris non-fluorescent [44] | Trypan blue overestimates viability |
| Primary Cells & Tissues | Variable, depends on preparation [48] | Superior, specific nuclear staining [48] | Complex samples benefit from fluorescence |
| Apoptotic Cells | Underestimates death [48] | Accurate detection [48] | Trypan blue misses early apoptotic cells |
The Scientist's Toolkit: Essential Research Reagent Solutions
Key Reagents for Cell Viability Assessment
Table 3: Essential Research Reagents for Cell Viability Assessment
| Reagent Solution | Function & Mechanism | Application Context |
|---|---|---|
| Trypan Blue (0.4%) | Membrane-impermeant dye that stains dead cells blue via exclusion principle [44] | Brightfield viability assessment; suitable for clean cell cultures with minimal debris [44] |
| Acridine Orange (AO) | Cell-permeant nucleic acid binding dye that stains all nucleated cells green [44] [45] | Fluorescence-based total cell counting; can distinguish DNA (green) vs. RNA (red) binding [45] |
| Propidium Iodide (PI) | Membrane-impermeant DNA dye that stains dead cells red; ~668 Daltons [45] [48] | Fluorescence dead cell detection; used in flow cytometry and image-based counting [48] |
| DAPI (4′,6-diamidino-2-phenylindole) | Membrane-impermeant AT-selective DNA binder that stains dead cells blue [49] [46] | Nuclear counterstain for fluorescence microscopy; dead cell marker in viability assays [7] |
| AO/DAPI Combination Reagent | Pre-mixed solution for dual-fluorescence viability assessment [47] | Automated cell counting systems; standardized viability protocols in GMP environments [47] |
| Fluorescein Diacetate (FDA) | Cell-permeant substrate converted to fluorescent product by esterases in live cells [50] | Metabolic activity marker for viability; often combined with PI for dual-fluorescence assays [50] |
The comparative data presented in this guide demonstrates clear technical superiority of AO/DAPI fluorescence methods over traditional trypan blue exclusion for cell viability assessment in GMP research environments. The fluorescence approach provides more accurate viability measurements, better differentiation of nucleated cells in complex matrices, reduced subjectivity, and superior reproducibility—all critical factors in regulated biomanufacturing and therapeutic development contexts [44] [7] [48]. While trypan blue remains suitable for basic assessment of clean cell cultures where rapid, inexpensive analysis is prioritized over precision, the AO/DAPI method offers compelling advantages for applications requiring high accuracy, particularly with challenging sample types like PBMCs, primary cells, and samples with significant debris [44].
The emerging trends in cell counting technologies, including AI integration, automation, and regulatory tightening in biomanufacturing, further support the transition toward fluorescence-based methods [42]. For executive teams navigating the complexities of biotech scale-up, clinical readiness, or global lab expansion, implementation of robust fluorescence-based cell counting solutions represents far more than an operational upgrade—it is a strategic enabler of innovation, quality, and growth in the rapidly advancing field of cell-based therapies [42]. As the industry moves toward greater standardization and reproducibility demands, AO/DAPI fluorescence viability assessment is positioned to become the benchmark method for GMP-compliant cell analysis.
In the manufacturing of cell-based therapies, such as human induced pluripotent stem cells (hiPSCs) and chimeric antigen receptor T-cells (CAR-T), accurate cell counting is a fundamental pillar of quality control. These products are classified as advanced therapy medicinal products (ATMPs) and must be produced under current Good Manufacturing Practice (cGMP) regulations [8]. The entire production workflow, from initial cell expansion to final product release, depends on reliable measurements of cell concentration and viability to ensure patient safety and therapeutic efficacy. A survey revealed that only 18% of respondents from biotechnology, pharmaceutical, and manufacturing industries expressed high confidence in their cell viability assay results, highlighting the critical need for standardized, reliable counting methods [1].
The transition from manual to automated cell counting methods represents a significant advancement in cGMP compliance, addressing key challenges in precision, reproducibility, and documentation. This guide provides an objective comparison of these methodologies, supported by experimental data and structured within a framework for successful cGMP integration.
Manual vs. Automated Cell Counting: A Technical Comparison
Fundamental Principles and Mechanisms
Manual Cell Counting using a hemocytometer is a historical cornerstone technique. It involves loading a cell sample onto a specialized chamber with an etched grid and visually counting cells under a microscope [51] [1]. Viability is typically assessed using exclusion dyes like trypan blue, where dead cells with compromised membranes take up the stain, while live cells exclude it [7] [51].
Automated Cell Counting encompasses both image-based and flow-based systems. Fluorescence-based image cytometers, such as the NucleoCounter series, use fluorescent dyes like acridine orange (for total cells) and DAPI (for dead cells) to stain cells. The instrument then captures images and employs software algorithms to identify and count cells [7]. Alternative automated systems like the CellDrop counters use brightfield and fluorescence functionalities without disposable slides, while flow cytometers analyze multiple cellular parameters as cells flow past a laser [51] [1].
Performance Data and Comparative Analysis
The following table summarizes a quantitative comparison of the two approaches, synthesizing data from validation studies and technical evaluations.
Table 1: Performance Comparison of Manual vs. Automated Cell Counting
| Parameter | Manual Hemocytometer | Automated System (e.g., NucleoCounter) |
|---|---|---|
| Accuracy & Specificity | Subject to human interpretation of cells vs. debris [7] | High; validated accuracy against pharmacopeial standards [8] |
| Precision (Reproducibility) | Low; high inter-operator variance (CV often ≥15%) [7] | High; intra- and inter-operator CV dramatically lower [8] |
| Viability Determination | Uses trypan blue, which is toxic and can underestimate viability [7] [51] | Uses DAPI/AO; more precise and non-toxic during analysis [7] |
| Sample Throughput | Time-consuming and laborious [8] [51] | High speed; optimized for fast workflow [23] |
| Statistical Robustness | Low; typically based on ~100 cells, high stochastic error [7] | High; counts thousands of cells, providing statistical significance [7] |
| Data Management | Manual recording, prone to transcription errors | Automated data storage, traceability, and audit trails (with 21 CFR Part 11 option) [23] |
| cGMP Documentation | Minimal inherent documentation | Comprehensive, with secure audit trails and PDF report generation [23] |
A key validation study investigating hiPSCs for cGMP manufacturing concluded that the automated NucleoCounter NC-100 system demonstrated "higher precision than the manual method" and could be used "more effectively than the manual one for hiPSC cell counting" [8].
Experimental Protocols for Method Evaluation
Implementing a new cell counting method in a cGMP environment requires rigorous validation. The International Organization for Standardization (ISO) provides a framework for this process in ISO 20391-2:2019, which guides the experimental design and statistical analysis for quantifying counting method performance [1] [12].
Protocol for a Comparative Validation Study
This protocol is designed to comply with ICH Q2(R1) indications and EudraLex cGMP regulations for ATMP manufacturing [8].
1. Sample Preparation:
- Cell Types: Select cell types relevant to your workflow (e.g., hiPSCs, T-cells, PBMCs). Include samples with varying characteristics, such as cells attached to magnetic beads from selection processes [12].
- Dilution Series: Create a dilution series of the cell sample (e.g., 1:1, 1:2, 1:3, 1:4, 1:5) using an appropriate buffer like DPBS with Human Serum Albumin. The concentrations should span the typical operating range for your process [12].
- Replicates: For each dilution level, prepare a minimum of three independent sample tubes. Assign random IDs to blind the operators and prevent bias [12].
2. Data Acquisition:
- Manual Counting: Multiple trained operators count each blinded sample separately using a hemocytometer and their standard protocols without sharing data [7].
- Automated Counting: Each blinded sample is analyzed multiple times (e.g., 3 replicates) using the automated instrument according to the manufacturer's instructions [12].
3. Data Analysis:
- Precision: Calculate the Coefficient of Variation (%CV) for replicate measurements for each method. A lower %CV indicates higher precision and reproducibility [7] [12].
- Linearity & Proportionality: Plot the measured cell concentration against the expected concentration (based on dilution factor). Calculate a proportionality index. A method with good linearity will show a straight line, proving it provides consistent counts across different concentrations [12].
- Accuracy: If a reference material is available, compare the results from both methods to the reference value. In the absence of a reference, the automated method is often validated against the pharmacopeial method (manual hemocytometer) as the reference, focusing on its superior precision [8].
Table 2: Essential Research Reagent Solutions for Cell Counting Validation
| Reagent/Material | Function in Experiment | Example & Notes |
|---|---|---|
| Hemocytometer | Reference counting chamber for manual method. | Bürker or Neubauer chamber [8]. |
| Fluorescence Cassettes | Integrated staining and measurement chamber for automated systems. | Via2-Cassette for NucleoCounter with pre-loaded Acridine Orange & DAPI [7]. |
| Viability Stains | To distinguish between live and dead cells. | Trypan Blue: For manual counting (can be toxic) [7]. DAPI/Acridine Orange: For fluorescence-based automates counters [7]. |
| Cell Suspension Buffer | To dilute cell samples to a countable concentration. | DPBS with Human Serum Albumin or culture medium. Avoid saline solutions as they can reduce stain intensity [1] [12]. |
| Magnetic Beads | For simulating process challenges like cell isolation. | Used in T-cell selection workflows; can interfere with some automated counters [12]. |
| IQ/OQ/PQ Kits | For qualifying instrument performance in GMP environments. | Vendor-provided kits (e.g., for NucleoCounter) to validate installation, operation, and performance [23]. |
A Strategic Workflow for cGMP Integration
The following diagram illustrates a systematic approach, based on ISO 20391-2 guidance, for evaluating and integrating a cell counting method into a cGMP workflow, from initial assessment to final implementation for release testing.
The integration of robust, automated cell counting methods is no longer a luxury but a necessity for efficient and compliant cGMP manufacturing of ATMPs. While manual counting serves as a historical reference, its limitations in precision, reproducibility, and data integrity make it unsuitable for the scalable production of modern cell therapies. Automated fluorescence-based systems address these shortcomings, providing the accuracy, traceability, and validation framework required in a regulated environment.
The path to successful integration is systematic. By adopting a structured approach guided by ISO standards—involving careful method selection, rigorous experimental validation against process-specific challenges, and comprehensive instrument qualification—manufacturers can ensure that cell counting becomes a reliable cornerstone of their quality control system. This enables confident decision-making from in-process monitoring all the way to final product release, ultimately safeguarding the quality, safety, and efficacy of transformative cell therapies for patients.
Overcoming Common Pitfalls: Strategies for Reliable and Reproducible Cell Counts
In Good Manufacturing Practice (GMP) research for cell and gene therapies, the precision of cell counting is a foundational measurement that directly impacts product quality, dosing, and process monitoring. The transition from traditional manual methods to automated cell counting represents a critical step in mitigating significant sources of error. This guide objectively compares these methods, focusing on human subjectivity, pipetting, and volume inaccuracies, with supporting experimental data.
Quantitative Comparison: Manual vs. Automated Cell Counting
The performance of cell counting methods can be quantified through metrics such as the Coefficient of Variation (%CV), which measures precision, and data on proportionality and agreement between operators. The following table summarizes key findings from comparative studies.
| Performance Metric | Manual Hemocytometer | Automated Cell Counter | Context & Experimental Details |
|---|---|---|---|
| Inter-Operator Variation (%CV) | Up to 52% [52] or ~20% [53] | 1.8% - 2.9% [54] | Comparison between different users counting the same sample [52] [54]. |
| Intra-Operator Variation (%CV) | ~20% for a single operator [52] | 3.5% - 4.6% [54] | Replicate counts performed by the same user [52] [54]. |
| Overall Precision (%CV) | Often 20-30% [53] | Can be doubled compared to manual [53] | General precision of the counting method [53]. |
| Proportionality Index (PI) | Higher deviation from proportionality [55] | Lower deviation, closer to ideal [55] | Measures linearity and agreement with expected counts in dilution series [55]. |
Human Subjectivity in Cell Identification
A core challenge in manual counting is the reliance on human judgment to define a cell and distinguish it from debris, or to classify a cell as viable or non-viable.
- Cell Recognition: Each operator adheres to a personal set of criteria for what constitutes a cell, leading to inconsistencies even among experienced users [7]. A recent study highlighted that inter-operator variation can reach nearly 20% [53].
- Viability Determination: With manual methods, Trypan blue is commonly used. However, stain intensity can be inconsistent, and the dye itself is toxic to cells, which can lead to an overestimation of viability if not read within a strict timeframe [7] [53]. Automated fluorescence-based systems use DNA-binding dyes like Acridine Orange (AO) for total cells and Propidium Iodide (PI) or DAPI for dead cells. This provides a more objective and consistent biological definition of a dead cell (one with a compromised membrane), removing subjective interpretation of stain intensity [7].
Pipetting and Dilution Errors
Pipetting is a ubiquitous source of error in cell counting, affecting both sample preparation and the creation of dilution series.
- Impact on Counts: Errors in pipetting and dilution can account for up to 55% of the total variation in replicate counts [52]. These inaccuracies directly affect cell concentration calculations.
- Common Pipetting Mistakes: Errors include ignoring temperature fluctuations, using an inconsistent pipetting angle, employing improperly fitting tips, and operating a pipette outside its optimal volume range [56]. For volatile liquids, evaporation during pipetting can also alter concentration [56].
- Automated Mitigation: Automated liquid handling systems and integrated consumables, such as pre-filled staining cassettes, standardize these steps. One study noted that using an automated system (NucleoCounter NC-100) eliminated pipetting errors from sample staining and handling, contributing to its higher precision [8] [7].
Volume and Chamber Inaccuracies
The hemocytometer's design, while standardized, is susceptible to technical errors that affect the assumed sampling volume.
- Overloading the Chamber: Pipetting an incorrect volume can increase the height of the fluid chamber, leading to an underestimation of the sample volume and a consequent overestimation of cell concentration [7] [57].
- Coverslip Positioning: An incorrectly positioned coverslip can introduce a counting difference of 7.6% [52].
- Instrument Variation: Variation between different hemocytometer brands and models (e.g., Bürker-Türk, Thoma) is a documented source of error, with reported CVs ranging from 4.26% to over 20% depending on the model and dilution [52].
- Automated Solution: Automated image cytometers and flow cytometers use pre-calibrated measurement chambers or volumetric fluidics, eliminating errors related to chamber volume and coverslip placement [52] [7].
Experimental Protocols for Method Validation
A systematic approach is essential for validating a cell counting method in a GMP environment. The following protocols, aligned with international standards, provide a framework for evaluation.
Protocol 1: Inter-Operator Precision Assay
This protocol evaluates the impact of human subjectivity on counting results [7] [53].
- Sample Preparation: Prepare a minimum of five aliquots (e.g., 200 µl each) from a single, well-mixed cell sample.
- Counting: Assign each aliquot to a different trained operator. Each operator counts their aliquot using the standard laboratory hemocytometer protocol without collaborating or sharing data.
- Data Analysis: Calculate the cell concentration from each aliquot. Compute the arithmetic mean, standard deviation (σ), and the coefficient of variation (%CV) for the set of results.
- %CV = (Standard Deviation / Mean) x 100
- Interpretation: A %CV of 5-15% is considered excellent for manual counting, while values ≥15% are average and indicate significant variability that could impact research reproducibility [7] [53].
Protocol 2: Dilution Series for Proportionality and Precision
This method, compliant with ICH Q2(R1) and ISO 20391-2 guidelines, assesses the overall counting process performance, including linearity, precision, and the impact of dilution/pipetting errors [8] [15] [55].
- Experimental Design:
- Create a stock cell suspension and prepare a dilution series (e.g., 1:1, 1:2, 1:3, 1:4, 1:5) independently from the stock.
- For each dilution level, prepare three replicate sample tubes. Assign random IDs to blind the samples.
- Count each replicate tube multiple times (e.g., three times) using the counting method under validation.
- Statistical Analysis: Calculate quality indicators for the method:
- Precision: Determine the %CV across the replicate observations at each dilution level and overall.
- Proportionality Index (PI) and Linearity (R²): Plot the measured cell concentrations against the expected concentrations (based on dilution). A precise and proportional method will show a tight, linear fit (R² > 0.99). The PI quantifies the deviation from ideal proportionality [55].
- Application: This design was used to validate an automated cell counter for cGMP manufacturing of human induced pluripotent stem cells (hiPSCs), demonstrating higher precision than the manual hemocytometer method [8].
Workflow and Logical Diagrams
Cell Counting Method Evaluation Workflow
The diagram below outlines the logical workflow for evaluating and selecting a cell counting method, based on standards from ISO and NIST [15] [55].
This diagram maps the major sources of error in cell counting to their corresponding solutions in automated systems.
The Scientist's Toolkit: Key Reagents and Materials
The following table details essential materials used in advanced cell counting and their functions.
| Item | Function / Relevance |
|---|---|
| Fluorospheres (Beads) | Certified particles at a known concentration, used as standards for absolute counts and for validating the accuracy and linearity of counting instruments [58]. |
| Acridine Orange (AO) & DAPI | Fluorescent DNA-binding dyes. AO (cell-permeable) stains all nucleated cells. DAPI (membrane-impermeable) stains only dead cells, providing a more objective viability assessment than Trypan Blue [7]. |
| Via2-Cassette | A disposable, integrated consumable that contains pre-loaded AO and DAPI. It ensures standardized staining and houses a pre-calibrated measurement chamber, eliminating key manual pipetting and volume errors [7]. |
| Improved Neubauer Hemocytometer | The most common type of counting chamber, used as the traditional reference method. Its grid defines a known volume for manual counting [58]. |
| Propidium Iodide (PI) | Another membrane-impermeable fluorescent dye used to stain dead cells in many automated systems, including flow cytometers and some image cytometers [15] [54]. |
In the fields of cell therapy manufacturing, cancer diagnostics, and fundamental biological research, accurate cell counting transcends routine laboratory practice—it becomes a critical determinant of product efficacy, patient safety, and experimental validity. Universal to all cell therapies is the requirement to determine precise cell numbers at each step of the manufacturing process, directly influencing product characterization, dosing accuracy, and ultimately, commercial viability [59]. Similarly, in diagnostics, the enumeration of rare cells, such as circulating tumor cells (CTCs), can guide clinical decisions on prognosis and therapy [60].
Counting becomes significantly more challenging with complex biological samples. These include aggregated cells (e.g., iPSCs), samples enriched using bead-based selection techniques (e.g., immunomagnetic CTC isolation), and preparations containing significant cellular debris (e.g., from cryopreservation or tissue digestion). Traditional manual counting methods often fail under these conditions, introducing subjectivity and high variability [13] [59]. Within a Good Manufacturing Practice (GMP) framework, ensuring safety and reproducible product quality is paramount [61]. This guide objectively compares cell counting methodologies, focusing on their performance with complex samples and providing supporting experimental data to inform robust, GMP-compliant research and development.
Comparative Analysis of Cell Counting Technologies
Cell counting technologies operate on distinct principles, each with inherent strengths and limitations for complex samples. The choice of technology must align with the sample type and the required parameters.
The following table summarizes the core operating principles and key characteristics of major cell counting platforms.
Table 1: Core Cell Counting Technologies and Their Characteristics
| Technology | Primary Principle | Key Measurables | Best For | Sample Constraints |
|---|---|---|---|---|
| Manual Hemocytometer [51] [13] | Visual identification using a gridded chamber under a microscope. | Cell concentration, viability (with dye). | Low-budget labs; training; backup when tech fails; any cell type. | Requires single-cell suspensions for accuracy; struggles with clumps and debris. |
| Image-Based Automated [13] [31] | Digital imaging and software algorithms to identify and count cells. | Concentration, viability, cell size/distribution, aggregation index. | Standard cell lines, iPSCs, clumpy samples. | Performance depends on staining and algorithm sophistication. |
| Impedance-Based (Coulter Principle) [13] | Measures electrical resistance change as cells pass through a small aperture. | Absolute particle count, particle size. | Non-aggregated suspension cells; blood cells. | Cannot distinguish cell types; cannot count aggregated cells; low viability accuracy. |
| Flow Cytometry [62] [13] | Laser light scatter and fluorescence as cells pass single-file through a laser. | Multi-parameter analysis (size, granularity, protein markers), absolute count (with beads). | Detailed single-cell analysis, phenotyping. | Overkill for simple counts; tedious sample prep; requires reference beads for absolute count; complex, costly. |
Performance Data with Complex Sample Types
Empirical studies demonstrate that the "one-size-fits-all" approach is ineffective for cell counting, particularly with challenging samples. A seminal 2022 study evaluated automated platforms across different cell types relevant to cell therapy, with a focus on precision [59].
Table 2: Platform Performance Across Cell Types (Data from Dadgar et al., 2022) This table shows the Coefficient of Variation (% CV) for cell count and viability measurements, where a lower CV indicates higher precision.
| Cell Type | Sample Challenge | NucleoCounter NC-200TM | Vi-Cell XR | Manual Hemocytometer |
|---|---|---|---|---|
| iPSCs | High aggregation, clumpy morphology | > 12% CV | ≤ 12% CV | High user-to-user variability |
| T-Cells | More consistent size, single-cell suspensions | ≤ 12% CV | Not Specified | High user-to-user variability |
| MSCs | Cells of varying sizes | ≤ 12% CV | ≤ 14% CV | High user-to-user variability |
Key Interpretation: The data indicates that the Vi-Cell XR, an image-based system, was more precise for clumpy iPSCs, likely due to advanced algorithms that resolve cell boundaries within aggregates [31] [59]. Conversely, the NucleoCounter NC-200TM showed superior precision for T-cells [59]. Both automated platforms significantly outperformed manual counting, which exhibited high user-to-user variability [59].
For bead-based samples, such as in CTC enrichment, the size of the magnetic beads used for selection is a critical factor. A 2025 study found that magnetic beads in the ~100–150 nm size range provided optimal capture efficiency for EpCAM-expressing cancer cell lines in a flow-through immunomagnetic system. Specifically, MojoSort Streptavidin Nanobeads demonstrated high capture efficiencies for both high and low EpCAM-expressing cells [60]. This highlights that the counting method must be compatible with the sample preparation process, as larger beads or aggregates could potentially interfere with some counting technologies.
Experimental Protocols for Complex Sample Analysis
Protocol 1: Counting and Viability for Aggregated Cells (e.g., iPSCs)
Objective: To accurately determine the concentration and viability of human iPSC-derived cells, which are prone to aggregation.
Materials:
- Reagents: AO/PI staining solution (Acridine Orange/Propidium Iodide), phosphate-buffered saline (PBS) [59].
- Equipment: Automated image-based cell counter with fluorescence capabilities (e.g., Countess II FL, NucleoCounter NC-200TM) [31] [59].
- Controls: Freshly dissociated iPSC culture.
Workflow:
- Cell Preparation: Gently dissociate iPSC colonies into a single-cell suspension using a validated enzyme. Piper gently to minimize mechanical stress and the generation of debris [63].
- Staining: Mix cell suspension 1:1 with AO/PI stain. AO stains all nucleated cells (green), while PI only stains cells with compromised membranes (red) [59].
- Loading: Pipette the mixture into a reusable or disposable counting chamber [31].
- Analysis: Insert the slide into the automated counter. The instrument will capture digital images and use proprietary algorithms to identify and count live (AO+) and dead (PI+) cells, even within aggregates by resolving cell boundaries [31] [59].
- Data Recording: Record concentration, viability, and cell size distribution. Save images for data traceability.
Protocol 2: Enumeration of Bead-Enriched Cell Populations (e.g., CTCs)
Objective: To count target cells (e.g., CTCs) isolated from a complex matrix like blood using immunomagnetic beads.
Materials:
- Reagents: Biotinylated anti-EpCAM antibody, ~100-150 nm streptavidin magnetic beads (e.g., MojoSort Nanobeads), buffer containing protein blockers [60].
- Equipment: Flow-through immunomagnetic enrichment system with a Halbach array magnet, automated cell counter (image-based or flow cytometer) [60].
- Samples: Processed blood sample or diagnostic leukapheresis product.
Workflow:
- Incubation: Incubate the sample with biotinylated anti-EpCAM antibody, followed by incubation with streptavidin magnetic beads. This indirect method can improve capture efficiency [60].
- Enrichment: Pass the sample through the flow-through immunomagnetic system. The optimized magnetic field (Halbach array) captures bead-bound CTCs while removing unbound cells [60].
- Elution: Release the captured CTCs from the column or chamber into a low-volume buffer.
- Analysis:
- For a simple count of bead-bound cells, an image-based counter can be used. The system must be able to distinguish cells from beads.
- For phenotyping and highest sensitivity, analyze by flow cytometry. Use fluorescently labeled antibodies against cytokeratins (CTC-positive), CD45 (leukocyte-negative), and a nuclear stain for viability. The absolute count can be determined using reference counting beads added to the sample prior to running on the flow cytometer [62] [13].
Protocol 3: Handling Samples with High Debris Content
Objective: To obtain an accurate cell count from samples with significant debris, such as post-thaw cryopreserved cells or primary tissue digests.
Materials:
- Reagents: Fluorescent viability stain (AO/PI or similar), DNase solution (optional).
- Equipment: Fluorescence-capable automated cell counter (image-based or flow cytometer) [59].
Workflow:
- Sample Preparation: Thaw cryopreserved cells or dissociate tissue using a standardized protocol. Gently mix the sample to ensure homogeneity.
- Debris Reduction (Optional): For samples with high DNA release from dead cells, consider a brief treatment with DNase to reduce viscous networks that can interfere with counting.
- Fluorescent Staining: Use a nucleic acid-binding stain like AO/PI. Fluorescence is highly specific for cellular material, allowing the instrument's software to gate out non-fluorescent debris that would be counted as cells in brightfield analysis [59].
- Analysis and Gating: Run the sample on the counter. Use software features to adjust gating parameters based on size and fluorescence intensity, effectively excluding debris from the final count.
Visualizing the Decision Workflow and Experimental Process
To aid in selecting the appropriate methodology, the following diagram outlines a logical decision pathway for handling complex samples.
Essential Research Reagent Solutions
The following table details key reagents and materials critical for successful cell counting in complex scenarios, particularly within a GMP-compliant framework.
Table 3: Key Reagents and Materials for Complex Sample Counting
| Item | Function/Description | Application Notes |
|---|---|---|
| Acridine Orange/Propidium Iodide (AO/PI) | Fluorescent nucleic acid stains for viability. AO (green) labels all nuclei; PI (red) labels dead cells. | More reliable than Trypan Blue for distinguishing viable cells in debris-heavy samples [59]. Preferable for GMP workflows. |
| Trypan Blue | Azo dye for manual viability assessment; stains permeable (dead) cells blue. | Well-documented limitations: toxic to cells, subjective interpretation, can overestimate viability [51] [59]. Being phased out in the EU [13]. |
| Streptavidin Magnetic Beads (~100-150 nm) | Nanobeads for immunomagnetic enrichment of target cells (e.g., CTCs) via biotinylated antibodies. | Bead size is critical for efficiency. Beads in the ~100-150 nm range show high capture efficiency for EpCAM-expressing cells [60]. |
| Reference Counting Beads | Fluorescent beads of known concentration used in flow cytometry for absolute cell counting. | Essential for deriving absolute cell counts from flow cytometry data, correcting for sample volume inconsistencies [62]. |
| Dimethyl Sulfoxide (DMSO) | Cryoprotective agent used in cell freezing media. | Can introduce toxicity post-thaw, affecting viability measurements. Requires timely analysis after thawing [59]. |
| Reusable Counting Slides | Permanent slides for automated image-based counters (e.g., for Countess II). | Reduces ongoing consumable costs and environmental waste compared to single-use slides [31]. |
Navigating the challenges of counting complex samples requires a strategic and technology-informed approach. The experimental data and protocols presented here underscore that no single counting method is universally optimal; the choice must be tailored to the specific sample challenge, whether it's aggregation, bead-based enrichment, or debris [59].
The consistent trend across studies is the superior precision and reduced variability of automated platforms over manual hemocytometry, making them indispensable for GMP-compliant research and manufacturing [31] [59]. Furthermore, the move towards fluorescent staining methods (AO/PI) is crucial for obtaining accurate viability data in the presence of debris, outperforming traditional Trypan Blue [59].
By aligning the sample's specific challenges with the appropriate technology and validated protocol, researchers and drug development professionals can ensure the accuracy, reliability, and reproducibility of their cell counting—a fundamental requirement for the successful development and commercialization of advanced therapies and diagnostics.
In both Good Manufacturing Practice (GMP) and research laboratories, accurate cell counting is a critical, foundational step. It ensures the quality, safety, and efficacy of cell-based products and the reliability of experimental data. A key, yet often underestimated, challenge is the impact of common suspension media and reagents, such as Dimethyl Sulfoxide (DMSO) and various buffers, on the accuracy of cell counting results. These substances can directly alter cell physiology and viability, leading to significant measurement errors. This guide objectively compares the performance of manual and automated cell counting methods in the presence of these reagents, providing a structured framework for selecting the most appropriate method to ensure data integrity in critical applications.
How Reagents Influence Cell Counts: Mechanisms and Evidence
Understanding the biological and technical impact of common reagents is the first step in mitigating counting inaccuracies. The effects of DMSO and cell isolation buffers are particularly consequential.
The Profound Impact of DMSO
DMSO is widely used as a cryoprotectant and solvent, but evidence shows it is not biologically inert and can drastically affect cell count accuracy.
- Cellular and Epigenetic Changes: A 2019 study exposed cardiac and hepatic microtissues to a low concentration of DMSO (0.1%). The results demonstrated "large alterations in microRNAs and epigenetic landscape," with over 2,000 differentially expressed genes in cardiac tissues. This indicates that DMSO can disrupt fundamental cellular processes, including metabolism and vesicle-mediated transport, potentially changing cell morphology and viability in ways that affect counting [64].
- Direct Correlation with Reduced Cell Count: Research quantifying the effect of DMSO on cancer cells established a clear "decrease in cell count associated with the increase in DMSO percentage and exposure time" [65]. This provides direct experimental evidence that DMSO concentration is a key variable in counting accuracy.
Challenges Posed by Buffers and Beads
In cell therapy workflows, reagents beyond DMSO introduce their own complexities.
- Trypan Blue Limitations: Trypan blue is a standard exclusion dye for viability assessment in manual counting. However, it is toxic to cells, and its stain intensity can be difficult to interpret subjectively. Prolonged exposure can lead to increased cell death, artificially lowering viability measurements [7] [51].
- Interference from Magnetic Beads: During T-cell isolation for therapies like CAR-T, magnetic beads are frequently used. The presence of these beads can "skew automated algorithms," leading to inaccurate counts unless the method is specifically validated for such samples [12].
Table 1: Documented Effects of Common Reagents on Cells and Counting Accuracy
| Reagent | Primary Use | Documented Impact on Cells/Counting | Key Experimental Finding |
|---|---|---|---|
| DMSO | Cryopreservation, Solvent | Alters gene expression, reduces viability | >2,000 genes differentially expressed at 0.1% concentration; cell count decrease dose-dependent [65] [64] |
| Trypan Blue | Viability Staining | Toxic with prolonged exposure; subjective interpretation | Known to underestimate viability; stain intensity varies, causing user subjectivity [7] [51] |
| Magnetic Beads | Cell Isolation (e.g., T-cells) | Physical interference with automated counters | Beads can skew image-based algorithms, requiring method adaptation [12] |
Manual vs. Automated Cell Counting: A Comparative Performance Analysis
The choice between manual and automated counting becomes critical when working with sensitive reagents. Each method has distinct strengths and weaknesses in accuracy, reproducibility, and ability to handle complex samples.
Limitations of Manual Counting
The traditional hemocytometer method, while low-cost, introduces several sources of error that are exacerbated by reagent-affected cells.
- High Subjectivity and Variability: Human perception of what defines a cell, especially in the presence of debris or faint trypan blue staining, is a major source of error. Studies show that when multiple users count the same sample, the coefficient of variation (CV) is often 15% or higher, indicating poor reproducibility [7].
- Low Throughput and Statistical Power: Manual counting typically involves tallying only about 100 cells. According to Poisson statistics, this low number inherently carries a standard deviation of at least 10%, even before human error is factored in [7].
- Volumetric and Pipetting Errors: Inaccurate pipetting or improper placement of the hemocytometer coverslip can lead to incorrect volume measurements, directly impacting concentration calculations [51].
Advantages of Automated Systems
Automated cell counters, including image-based cytometers and flow cytometers, are designed to overcome the limitations of manual methods.
- Enhanced Objectivity and Precision: Automated systems use software algorithms to define a cell consistently for every analysis, eliminating human bias. This leads to significantly higher precision and reproducibility, with CVs often falling below 5% [7].
- Higher Throughput and Statistical Significance: These instruments can analyze thousands of cells in seconds, providing a much larger dataset that reduces statistical uncertainty and increases confidence in the results [51].
- Advanced Assay Capabilities: Many automated counters use fluorescent dyes like acridine orange (for total cells) and DAPI (for dead cells), which are more precise and less toxic than trypan blue for viability determination [7].
Table 2: Performance Comparison of Manual vs. Automated Counting in Reagent-Challenged Workflows
| Performance Metric | Manual Hemocytometer | Automated Image Cytometer | Flow Cytometer |
|---|---|---|---|
| Accuracy with DMSO | Low (subjective viability call) | Medium-High (algorithm-based) | High (multi-parameter analysis) |
| Precision (CV) | Often ≥15% [7] | Typically <5% [7] | Very Low (<2% with beads) [66] |
| Effect of Beads | Manual exclusion possible | Algorithm can be skewed [12] | Excellent for bead-bound cells [66] |
| Viability Assay | Trypan Blue (toxic, subjective) | AO/DAPI (precise, stable) [7] | 7AAD/DAPI (high accuracy) [66] |
| Sample Throughput | Low (slow, laborious) | High (fast, walk-away) | Medium (requires setup) |
Experimental Protocols for Counting Method Validation
Adopting a standardized approach to validate counting methods is essential for GMP and rigorous research. The following protocols, derived from recent studies, provide a framework for assessing method suitability.
ISO 20391-2 Guided Validation for Cell Therapy Workflows
A 2023 study provided a systematic protocol for evaluating counting methods across different stages of a cell processing workflow, in accordance with ISO 20391-2 standards [12].
Sample Preparation and Dilution Series:
- Prepare samples at various stages (e.g., post-isolation, post-bead activation).
- Based on an estimated cell concentration, create a dilution series (e.g., 1:1, 1:2, 1:3, 1:4, 1:5) using an appropriate buffer like DPBS with Human Serum Albumin.
- Assign random IDs to sample tubes to prevent operator bias during counting.
Method Comparison and Data Collection:
- Count each dilution in triplicate using the methods under investigation (e.g., manual hemocytometer, image-based counter, flow cytometer).
- Record both cell concentration and viability for each measurement.
Data Analysis and Suitability Determination:
- Calculate the Coefficient of Variation (%CV) across replicate observations for each method. A lower %CV indicates higher precision.
- Generate a proportionality index to ensure the measured cell concentration scales linearly with the expected dilution factor.
- Use these metrics, alongside practical considerations like cost and throughput, to identify the most suitable method for each specific cell type and processing step [12].
Spectrophotometric Trypan Blue Assay for Cytotoxicity
A 2019 study developed a high-throughput protocol to quantify the effect of reagents like DMSO on cell viability and proliferation [65].
Cell Seeding and Treatment:
- Seed cells in a 96-well plate in a series of known concentrations to generate a standard curve.
- Seed additional wells with arbitrary cell concentrations and treat them with or without the reagent of interest (e.g., DMSO).
Staining and Measurement:
- After a designated exposure time, fix cells with 4% Paraformaldehyde (PFA) for 20 minutes.
- Permeabilize and stain the fixed cells with Trypan Blue (e.g., 0.25% for 30 minutes).
- Wash the cells thoroughly to remove any residual dye and measure the internalized trypan blue using a spectrophotometric plate reader at an absorbance of 450-490 nm.
Analysis:
- Correlate the absorbance readings to cell counts using the standard curve.
- This method showed a very high correlation with the conventional trypan blue exclusion assay (Pearson r > 0.99) but offered higher precision and throughput [65].
Essential Research Reagent Solutions
The following reagents and instruments are fundamental to the experiments and counting methods discussed in this guide.
Table 3: Key Reagents and Instruments for Cell Counting Workflows
| Item | Function in Cell Counting | Key Consideration |
|---|---|---|
| DMSO | Cryoprotectant for cell storage; solvent for reagents. | Induces transcriptomic and epigenetic changes at low concentrations (0.1%), impacting viability and count accuracy [64]. |
| Trypan Blue | Exclusion dye for manual viability assessment. | Toxic to cells; stain intensity is subjective, leading to user-dependent variability [7] [26]. |
| Acridine Orange (AO) / DAPI | Fluorescent dyes for automated viability (total/dead cells). | More precise and stable than trypan blue; requires a fluorescence-capable instrument [7]. |
| Magnetic Beads | Isolation of specific cell types (e.g., CD3/CD28 T-cells). | Can interfere with image-based counting algorithms, necessitating method validation [12]. |
| Automated Image Cytometer | Instrument for objective, high-throughput cell counting. | Eliminates human bias; provides high statistical power by analyzing thousands of cells [7] [51]. |
| Flow Cytometer | Instrument for high-accuracy, multi-parameter cell analysis. | "Gold standard" for complex samples; ideal for counting bead-bound cells and deep immunophenotyping [66] [67]. |
Visualizing the Impact of DMSO and the Path to Accurate Counting
The following diagrams summarize the multifaceted effects of DMSO on cells and the decision-making process for selecting a counting method.
Diagram 1: DMSO's multilevel impact on cell counting. DEGs: Differentially Expressed Genes. DMSO exposure triggers cascading effects from the molecular to the cellular level, all contributing to potential inaccuracies in cell counting assays [65] [64].
Diagram 2: Cell counting method selection guide. This decision tree, informed by challenges like bead interference and the need for precision, guides the selection of the most appropriate counting technology [66] [7] [12].
The choice between manual and automated cell counting is not merely a matter of convenience but a critical decision that directly impacts data quality and product consistency. Evidence clearly shows that reagents like DMSO and trypan blue are active participants in biological systems, capable of inducing changes that skew counting results. While manual counting suffers from inherent subjectivity and high variability, modern automated methods provide the objectivity, precision, and statistical power needed for robust quantification, especially in reagent-challenged environments. For GMP and rigorous research, adopting a standardized, validated approach to cell counting—one that accounts for the specific reagents in use—is not just best practice; it is an essential step in ensuring the integrity of the entire scientific or manufacturing workflow.
In the manufacturing of advanced therapies, such as human induced pluripotent stem cells (hiPSCs), the accurate and reliable determination of cell concentration and viability is a critical quality control step. Under current Good Manufacturing Practice (cGMP) regulations, processes must be validated to ensure they consistently meet predetermined specifications and quality attributes [68] [8]. This guide provides an objective comparison between manual and automated cell counting methods, focusing on their performance in terms of inter-operator variability and the role of equipment maintenance within a cGMP quality control framework. Automated cell counting using image cytometry presents a solution to key sources of error inherent in manual methods, thereby enhancing the precision and reproducibility essential for mammalian cell culturing in drug development [7].
Performance Comparison: Manual vs. Automated Cell Counting
A direct comparison of the two methodologies reveals significant differences in precision, reproducibility, and susceptibility to human error. The following sections and summarized data highlight these distinctions.
Manual cell counting with a hemocytometer is associated with several major sources of error that contribute to large variations in calculating cell concentration and viability [7]:
- Human Perception: The definition of a cell versus debris can vary between individuals, leading to inconsistent counts, especially in samples with significant debris [7].
- Volume and Pipetting Errors: Inaccurate preparation and loading of the cell sample in the hemocytometer can cause volume inaccuracies, leading to an overestimation of cell concentration [7].
- Viability Determination: Using Trypan blue for viability can be difficult due to varying stain intensity. Furthermore, as Trypan blue is toxic, it can underestimate viability if not analyzed within a short timeframe [7].
- Insufficient Counting Events: Standard practice often involves counting only about 100 cells. According to Poisson distribution, this low number inherently carries a standard variation of at least 10%, even before accounting for human-introduced variations [7].
Quantitative Performance Data
The tables below consolidate experimental data from validation studies, comparing the reliability and precision of manual and automated methods.
Table 1: Inter-Operator Variability in Bead Counting (Coefficient of Variation %CV) [54]
| Counting Method | %CV Intra-User (User 1) | %CV Intra-User (User 2) | %CV Inter-User (User 1 & 2) |
|---|---|---|---|
| Hemocytometer (Manual) | 4.9% | 6.9% | 4.0% |
| Cellometer Auto 2000 (Automated) | 4.6% | 3.5% | 1.8% |
Table 2: Performance in hiPSC Cell Counting for cGMP Manufacturing [8] [4]
| Parameter | Manual Hemocytometer | Automated NucleoCounter NC-100 |
|---|---|---|
| Dependency on Operator Expertise | High | Low |
| Time Consumption | High | Low (Fast) |
| Precision | Lower | Higher |
| Validation per ICH Q2(R1) | Reference Method | Validated for Accuracy, Specificity, Reproducibility |
Table 3: Linearity of Automated Cell Counter Across Cell Concentrations [54]
| Dilution Factor | Expected Concentration (cells/mL) | Measured Concentration (cells/mL) | %CV |
|---|---|---|---|
| 1 | 1.06 x 10⁷ | 1.06 x 10⁷ | 1.8% |
| 0.5 | 5.29 x 10⁶ | 5.50 x 10⁶ | 1.7% |
| 0.25 | 2.65 x 10⁶ | 2.69 x 10⁶ | 4.5% |
| 0.125 | 1.32 x 10⁶ | 1.28 x 10⁶ | 2.1% |
Experimental Protocols for Method Validation
For a method to be implemented in a cGMP environment, it must be thoroughly validated. The following protocols are based on studies that successfully validated automated cell counting.
Protocol for Assessing Inter-Operator Variability
This protocol provides a straightforward method to quantify counting variability among different personnel in a lab [7].
- Principle: Multiple operators count identical aliquots from the same cell sample independently. The results are analyzed to calculate the coefficient of variation (CV), a measure of inter-operator variability.
- Materials: Homogeneous cell suspension, hemocytometer (or automated cell counter), trypan blue dye (if applicable), pipettes.
- Procedure:
- Thoroughly mix a cell sample and prepare a minimum of five identical aliquots.
- Ask five different colleagues to each count one aliquot using the same counting method (manual or automated). They must perform the count independently without sharing data.
- Each operator should count using their normal standards and should not count more squares or cells than they typically would.
- Each operator calculates the cell concentration for their aliquot.
- Data Analysis:
- Calculate the arithmetic mean and standard deviation of all calculated concentrations.
- Determine the coefficient of variation (CV) using the formula: CV (%) = (Standard Deviation / Mean) x 100.
- Interpretation: A CV of ≥ 15% is considered about average for manual counting and indicates large variations that impact research reproducibility. A CV of 5-15% is excellent, while a CV of 0-5% is advanced [7].
Protocol for Validating an Automated Cell Counting Method
This protocol is adapted from a study that validated an automated method for cGMP manufacturing of hiPSCs, complying with EudraLex cGMP and ICH Q2(R1) guidelines [8] [4].
- Principle: The automated cell counting method (e.g., NucleoCounter NC-100) is compared against a recognized reference method (e.g., manual counting with a Bürker hemocytometer as per the European Pharmacopeia) across key validation parameters.
- Materials: hiPSC cultures, Bürker hemocytometer, NucleoCounter NC-100 system with Via2-Cassette, relevant staining solutions.
- Procedure & Validation Parameters:
- Accuracy: Compare the cell concentration results from the automated system against the reference manual method for a range of samples.
- Specificity: Evaluate the system's ability to correctly identify and count target cells (hiPSCs) in the presence of potential impurities like cell debris.
- Intra-Operator Reproducibility: One operator performs multiple counts on the same sample using the automated system to assess repeatability.
- Inter-Operator Reproducibility: Multiple trained operators count the same sample using the automated system to assess the method's robustness to user variation.
- Linearity and Range: Test samples serially diluted across a wide range of expected concentrations to verify the instrument provides a linear response.
Workflow and Logical Diagrams
The diagrams below illustrate the core concepts and workflows discussed in this guide.
Diagram 1: Impact of Counting Method on cGMP Data Integrity.
Diagram 2: Automated Cell Counter Validation Workflow.
The Scientist's Toolkit: Essential Research Reagent Solutions
The following table details key reagents and materials used in cell counting and the associated validation experiments.
Table 4: Key Reagents and Materials for Cell Counting & Validation
| Item | Function/Application | Key Consideration |
|---|---|---|
| Trypan Blue | A dye used in manual counting to stain dead cells with compromised membranes [7]. | Toxic to cells; viability must be assessed within 5-30 minutes to avoid underestimation [7]. |
| Acridine Orange (AO) | A cell-permeable fluorescent dye that binds nucleic acids, used in automated systems (e.g., NucleoCounter) to stain the total cell population [7]. | Provides a more reliable and consistent method for identifying nucleated cells compared to brightfield microscopy [7]. |
| DAPI | A membrane-impermeable fluorescent dye that binds to DNA, used in automated systems to define dead cell populations [7]. | Increases the precision of viability determinations compared to Trypan blue [7]. |
| Propidium Iodide (PI) | A membrane-impermeable fluorescent dye that binds to DNA, used as an alternative to DAPI in some automated systems (e.g., Cellometer) for identifying dead cells [54]. | Similar function to DAPI; selection depends on the instrument's optical configuration. |
| Via2-Cassette | A single-use, disposable cassette for automated cell counters that incorporates pre-loaded AO and DAPI stains [7]. | Eliminates pipetting errors from sample staining and handling, ensuring a pre-calibrated measurement volume [7]. |
| Hemocytometer | A calibrated glass slide with a grid, used for manual microscopic cell counting [7] [8]. | Prone to volume estimation errors and subjective cell identification; requires strict standardized operating procedures [7]. |
Within a cGMP quality control system, the choice of cell counting methodology has a direct impact on data integrity and process reproducibility. Quantitative data demonstrates that automated cell counting systems offer superior precision and significantly lower inter-operator variability compared to manual hemocytometer counts [54]. By implementing automated methods and following structured validation protocols, laboratories can effectively control key sources of error, thereby generating the reliable and reproducible data required for the successful development and manufacturing of advanced therapy medicinal products (ATMPs) [8] [4].
Data-Driven Decisions: Validating Automated Methods and Comparative Performance Analysis
In the field of biopharmaceuticals and advanced therapy medicinal products (ATMPs), accurate cell counting is not merely a laboratory routine but a critical quality attribute with direct implications for patient safety and product efficacy. For human induced pluripotent stem cells (hiPSCs) manufactured as ATMPs meeting current Good Manufacturing Practice (cGMP) requirements, production presents significant hurdles, particularly in large-scale cell expansion needed to reach therapeutically relevant doses [8]. The International Council for Harmonisation (ICH) Q2(R2) guideline provides the foundational framework for validating analytical procedures, ensuring that methods used for release and stability testing of commercial drug substances and products are reliable, reproducible, and fit for their intended purpose [69]. This framework establishes key validation characteristics including accuracy, precision, specificity, and linearity, which form the essential criteria for evaluating any cell counting method deployed in regulated environments.
The evolution from manual to automated cell counting represents a significant advancement in quality control for cell-based therapies. Conventional manual cell counting using the hemocytometer method is notoriously dependent on the operator's expertise and is time-consuming, making it susceptible to human error and variability [8]. Within the ICH Q2(R2) framework, this transition exemplifies the implementation of a science- and risk-based approach to analytical procedure validation, emphasizing lifecycle management through the complementary ICH Q14 guideline [70] [71]. This article will objectively compare manual and automated cell counting methods through the lens of ICH Q2(R2) validation criteria, providing researchers and drug development professionals with experimental data and methodologies to support informed decisions in cGMP-compliant research environments.
Core Principles of ICH Q2(R2) Validation
The ICH Q2(R2) guideline outlines specific validation characteristics that must be demonstrated for analytical procedures used in pharmaceutical analysis. For quantitative analytical procedures like cell counting, four parameters are particularly critical: accuracy, precision, specificity, and linearity [69]. Accuracy refers to the closeness of agreement between the measured value and the true value, while precision expresses the closeness of agreement between a series of measurements from multiple sampling of the same homogeneous sample. Specificity is the ability to assess unequivocally the analyte in the presence of components that may be expected to be present, and linearity is the ability to obtain test results that are directly proportional to the concentration of analyte within a given range [69] [71].
The recent revision to ICH Q2(R2), along with the new ICH Q14 guideline on analytical procedure development, represents a significant modernization of the approach to method validation [70] [71]. Rather than treating validation as a one-time event, these guidelines emphasize a lifecycle management concept, ensuring continuous improvement and adaptability to technological advancements. This shift incorporates proactive definition of an Analytical Target Profile (ATP) - a prospective summary of the method's intended purpose and desired performance characteristics [72] [71]. For cGMP manufacturing of hiPSCs and other advanced therapies, this systematic approach ensures that cell counting methods remain robust and reliable throughout the product lifecycle, supporting both development and commercial manufacturing activities.
Application to Cell Counting Methods
When applied to cell counting methodologies, the ICH Q2(R2) validation parameters take on specific significance. For accuracy in cell counting, this means demonstrating that the measured cell concentration reflects the true number of viable cells in a sample. Precision encompasses both repeatability (intra-assay precision) and intermediate precision (inter-operator, inter-day variability), which is particularly relevant given the multi-operator environment typical in cGMP facilities. Specificity in cell counting involves the ability to distinguish intact viable cells from dead cells, debris, and other particulate matter, while linearity requires demonstrating proportional results across the method's intended range of cell concentrations [8] [7].
The implementation of ICH Q2(R2) for cell counting methods in biologics follows either a minimal or enhanced approach [70]. The minimal approach focuses on fundamental validation characteristics, while the enhanced approach employs more structured methodologies using formal risk assessments, definition of the ATP, and multivariate experiments to establish a more comprehensive understanding of method performance [70]. For critical applications like cell therapy products, the enhanced approach provides greater regulatory flexibility and facilitates post-approval changes through better method understanding and control strategies.
Manual Cell Counting: Methodology and Validation
Experimental Protocol: Manual Hemocytometer Counting
The manual hemocytometer method relies on visual counting of cells under a microscope using a standardized chamber slide with grid markings [24]. The following protocol details the standard procedure for manual cell counting:
- Sample Preparation: Mix the cell suspension thoroughly to ensure homogeneous distribution. For viability assessment, mix 10-20 μL of cell suspension with an equal volume of trypan blue stain (0.4%) [7]. Incubate for approximately 5 minutes, but not longer than 30 minutes due to trypan blue toxicity to cells [7].
- Slide Loading: Carefully place a coverslip over the hemocytometer chamber. Using a pipette, transfer approximately 10-20 μL of the cell suspension to the edge of the coverslip, allowing the chamber to fill by capillary action. Avoid overfilling or underfilling [24].
- Microscopy and Counting: Place the hemocytometer on the microscope stage and view at 10X or 20X magnification. Count the cells in the four corner squares and the center square of the grid (total of 5 squares). For viability assessment, count unstained (viable) and blue-stained (non-viable) cells separately [24].
- Calculation: Calculate cell concentration using the formula: Cells/mL = (Total cells counted × Dilution factor) / (Number of squares counted × Volume per square). For a standard hemocytometer with 0.0001 mL volume per square (5 squares totaling 0.0005 mL volume): Cells/mL = (Total cells counted × Dilution factor) / 0.0005 [24].
- Viability Calculation: Calculate percentage viability as: Viability (%) = (Number of viable cells / Total number of cells) × 100 [24].
Manual Cell Counting Workflow
Validation Against ICH Q2(R2) Parameters
When evaluated against ICH Q2(R2) validation parameters, manual cell counting demonstrates significant limitations:
- Accuracy: Manual counting is susceptible to systematic errors including improper sample mixing, incorrect dilution factor calculations, and chamber overfilling or underfilling, leading to volume inaccuracies [7].
- Precision: Manual counting exhibits high operator-dependent variability. Inter-operator studies typically show coefficients of variation (CV) ≥15% or higher due to differences in human perception and counting criteria [7].
- Specificity: Trypan blue staining for viability determination presents challenges due to varying stain intensity and eventual toxicity to cells, potentially underestimating true viability [7].
- Linearity: While theoretically linear across concentrations, practical linearity is limited by counting statistics. Following Poisson distribution, counting only ~100 cells results in a minimum 10% standard variation [7].
The following table summarizes the performance characteristics of manual cell counting against key ICH Q2(R2) validation parameters:
Table 1: Validation of Manual Cell Counting Against ICH Q2(R2) Parameters
| Validation Parameter | Experimental Approach | Performance Data | Key Limitations |
|---|---|---|---|
| Accuracy | Comparison to reference standard | Variable; dependent on technician skill | Volume estimation errors, pipetting inaccuracies [7] |
| Precision (Repeatability) | Multiple counts of same sample by same operator | CV typically 5-15% [7] | Subjective cell identification, counting fatigue [24] |
| Precision (Intermediate Precision) | Multiple operators count same sample | CV often ≥15% [7] | Human perception differences, varying counting criteria [7] |
| Specificity | Ability to distinguish cells from debris | Moderate with trypan blue | Debris misidentification, variable stain intensity [7] |
| Linearity & Range | Serial dilutions across expected range | Theoretical linearity limited by statistics | Poisson distribution limits precision at low counts [7] |
Automated Cell Counting: Methodology and Validation
Experimental Protocol: Automated Fluorescence-Based Counting
Automated cell counting systems, such as the NucleoCounter NC-100 and NC-200 series, utilize fluorescence imaging and specialized cassettes to standardize the counting process [8] [7]. The validation protocol for implementing such systems in cGMP environments follows ICH Q2(R1)/Q2(R2) indications and EudraLex cGMP regulations [8]:
- System Setup and Qualification: Ensure the automated cell counter is installed according to manufacturer specifications. Perform initial calibration and qualification checks using standardized beads or reference materials.
- Reagent Preparation: Use Via1-Cassette or Via2-Cassette pre-loaded with immobilized fluorescent dyes (acridine orange for total cell count and DAPI for dead cell identification) [7]. These cassettes incorporate pre-calibrated measurement chambers to eliminate volume errors.
- Sample Loading: Mix cell suspension thoroughly. Submerge the built-in pipette of the cassette into the cell suspension and press the piston to draw a fixed volume (typically 20-30 μL) into the measurement chamber. The cassette automatically stains the sample [7].
- Measurement and Analysis: Insert the cassette into the instrument. The system automatically acquires images using LED excitation (365 nm for DAPI, 505 nm for acridine orange) and emission filters (410-460 nm for DAPI, 540-650 nm for acridine orange) [7]. Software algorithms analyze images based on predefined fluorescence thresholds.
- Data Collection: Record concentration and viability values provided by the instrument software. Most systems allow visual inspection of acquired images for verification [7].
Automated Cell Counting Workflow
Validation Against ICH Q2(R2) Parameters
Automated cell counting systems demonstrate enhanced performance characteristics when validated against ICH Q2(R2) criteria:
- Accuracy: Fluorescence imaging with DNA-binding dyes (acridine orange and DAPI) provides more specific cell identification compared to trypan blue. The pre-calibrated chambers in specialized cassettes eliminate volume estimation errors [7].
- Precision: Automated systems show significantly higher reproducibility. One study validating the NucleoCounter NC-100 for hiPSCs reported higher precision than manual methods for both intra- and inter-operator reproducibility [8].
- Specificity: The use of membrane-impermeable DAPI for dead cell identification increases precision of viability determinations compared to trypan blue. Fluorescence detection clearly distinguishes cells from debris [7].
- Linearity: Automated systems maintain linearity across a wider range of concentrations by analyzing larger cell numbers (thousands vs. hundreds), reducing the impact of Poisson distribution limitations [7].
The following table summarizes the validation performance of automated cell counting systems:
Table 2: Validation of Automated Cell Counting Against ICH Q2(R2) Parameters
| Validation Parameter | Experimental Approach | Performance Data | Advantages |
|---|---|---|---|
| Accuracy | Comparison to reference standard | Higher correlation with known standards | Fluorescent dyes (AO/DAPI) specifically target DNA [7] |
| Precision (Repeatability) | Multiple counts of same sample | CV typically <5% [7] | Eliminates human subjective variation [8] |
| Precision (Intermediate Precision) | Multiple operators, multiple days | CV <5-10% [8] | Standardized algorithm application [8] |
| Specificity | Analysis of samples with debris | High specificity with fluorescence | Clear distinction from debris; DAPI more precise for viability [7] |
| Linearity & Range | Serial dilutions across expected range | Maintained across wider range | Analyses thousands of cells for better statistics [7] |
Comparative Experimental Data and Analysis
Direct Method Comparison in Controlled Studies
A systematic validation study comparing automated counting (NucleoCounter NC-100) with the reference manual method (Bürker hemocytometer) following ICH Q2(R1) indications demonstrated clear advantages of automation for cGMP manufacturing of hiPSCs [8]. The study focused on accuracy, specificity, intra- and inter-operator reproducibility, range, and linearity, showing higher precision for the automated method across all parameters evaluated. This validation approach, compliant with EudraLex cGMP regulations for ATMP manufacturing, provides a template for implementing automated cell counting in regulated environments [8].
In practical laboratory settings, inter-operator variability studies reveal significant differences between the two methods. When five analysts each counted aliquots of the same cell sample using manual hemocytometry, coefficients of variation typically reached 15% or higher, reflecting the subjective nature of manual counting [7]. In contrast, the same analysts using an automated system achieved CV values below 5% for identical samples, demonstrating the superior reproducibility of automated methods [7]. This reduction in variability is particularly crucial for cGMP manufacturing where consistency across operators and production batches is mandatory.
Performance Metrics Comparison
The table below provides a direct comparison of key performance metrics between manual and automated cell counting methods:
Table 3: Comprehensive Comparison of Manual vs. Automated Cell Counting Methods
| Performance Characteristic | Manual Counting | Automated Counting |
|---|---|---|
| Time per Sample | 10-30 minutes [24] | ~30 seconds [24] |
| Typical CV (Precision) | ≥15% [7] | <5% [7] |
| Viability Determination | Trypan blue (variable intensity, toxic) [7] | DAPI (clear fluorescence threshold) [7] |
| Sample Volume | Variable loading (error source) [7] | Fixed automatic volume [7] |
| Statistical Basis | ~100 cells counted (high error) [7] | Thousands of cells (low error) [7] |
| Operator Dependency | High (human perception varies) [7] | Low (standardized algorithm) [8] |
| Data Recorded | Concentration & viability only [24] | Concentration, viability, size, aggregation [24] |
| Training Requirements | Significant training needed [24] | Minimal training required [24] |
| Regulatory Documentation | Manual recording (error potential) | Automated data export (audit trail) |
| Upfront Cost | $50-$100 (hemocytometer) [24] | $5,000-$50,000 (instrument) [24] |
The data demonstrates that while manual counting has a lower initial equipment cost, automated counting provides superior operational efficiency and data quality. The significantly reduced analysis time (30 seconds vs. 10-30 minutes) enables higher throughput processing, which is particularly valuable in cGMP environments where multiple process samples must be evaluated rapidly [24]. The automated collection of additional parameters like cell size distribution and aggregation information provides deeper process insights without additional effort [24].
Essential Research Reagent Solutions
The implementation of robust cell counting methods requires specific reagents and materials tailored to each technology. The following table details key research reagent solutions and their functions in cell counting workflows:
Table 4: Essential Research Reagents for Cell Counting Methods
| Reagent/Material | Function | Application Notes |
|---|---|---|
| Trypan Blue Stain (0.4%) | Viability indicator for manual counting; stains dead cells with compromised membranes [7] | Time-sensitive (5-30 minutes due to toxicity); variable intensity interpretation [7] |
| Via2-Cassette | Integrated sample chamber pre-loaded with acridine orange & DAPI for automated counting [7] | Eliminates pipetting errors; provides standardized staining [7] |
| Acridine Orange | Cell-permeable fluorescent DNA dye for total cell count in automated systems [7] | Excitation: 505 nm; Emission: 525 nm; binds nucleic acids [7] |
| DAPI | Membrane-impermeable fluorescent DNA dye for dead cell count in automated systems [7] | Excitation: 365 nm; Emission: 461 nm; specific for AT-rich DNA regions [7] |
| Hemocytometer | Standardized chamber slide with grid for manual microscopy counting [24] | Reusable; requires careful cleaning; volume ~0.0001 mL per square [24] |
| PBS Buffer | Dilution medium for cell samples prior to counting | Maintains cell viability; isotonic solution |
The selection of appropriate reagents directly impacts counting accuracy and regulatory compliance. For cGMP applications, the transition from trypan blue to fluorescence-based viability determination with DAPI provides more reliable results, as trypan blue is known to underestimate viability and its toxicity can affect results if analysis is delayed [7]. The use of integrated cassette systems in automated counting standardizes the staining process and eliminates numerous potential error sources associated with manual reagent preparation and handling [7].
Implementation in Regulated Environments
cGMP Compliance Considerations
For cGMP manufacturing of advanced therapy medicinal products like hiPSCs, the validation of analytical methods must comply with rigorous regulatory standards [8]. The implementation of automated cell counting following ICH Q2(R2) guidelines provides a framework for demonstrating method suitability throughout the product lifecycle. As emphasized in the recent ICH Q2(R2) and Q14 revisions, the enhanced approach to analytical procedure development—using formal risk assessments, definition of ATP, and multivariate experiments—provides greater regulatory flexibility and facilitates post-approval changes [70].
A critical consideration in method validation for regulated environments is the demonstration of robustness. While recent FDA discussions have suggested robustness testing during validation, ICH guidance notes that including robustness in validation protocols can be risky unless meeting pre-defined criteria is certain [70]. The more conservative approach is to conduct robustness testing during method development, ready to be provided if requested, rather than including it in the formal validation protocol [70]. This strategy mitigates the risk of validation failure due to unexpected robustness results.
Lifecycle Management and Technology Transfer
The ICH Q14 guideline introduces a systematic approach to analytical procedure lifecycle management (APLCM), which is particularly relevant for cell counting methods in long-term product development [72]. Creating an APLCM document facilitates regulatory assessment and inspection by providing a comprehensive record of method development, validation, and any subsequent changes [72]. For automated cell counting platforms, this includes documentation of:
- Technology selection rationale based on the Analytical Target Profile
- Risk assessments identifying potential method variables
- Control strategy defining operational ranges and system suitability criteria
- Change management procedures for method adjustments or technology transfers
The application of platform technologies for commonly used analytical procedures like cell counting is specifically addressed in the ICH Q2(R2) revision, recognizing that established methods with extensive historical data may require less extensive validation [70]. This approach benefits monoclonal antibody, RNA, LNP, and cell therapy developers who implement standardized counting methods across multiple product programs.
The validation of cell counting methods according to ICH Q2(R2) principles demonstrates clear advantages for automated fluorescence-based systems in cGMP research environments. When evaluated against critical validation parameters—accuracy, precision, specificity, and linearity—automated counting systems consistently outperform manual hemocytometry, particularly in operator-dependent variability and reproducibility [8] [7]. While manual counting retains utility for low-throughput applications and training purposes, the implementation of automated counting provides superior data quality, efficiency, and regulatory compliance for cGMP manufacturing of advanced therapies.
The modernization of analytical validation principles through ICH Q2(R2) and ICH Q14 emphasizes a lifecycle approach and science- and risk-based methodology that aligns perfectly with automated cell counting technologies [70] [71]. By implementing these guidelines through a structured validation strategy incorporating Analytical Target Profiles and robust control strategies, researchers and drug development professionals can ensure the reliability of cell counting data critical to product quality and patient safety. As the field of cell and gene therapies continues to advance, the rigorous application of these validation principles will support the manufacturing consistency needed to bring innovative treatments to patients.
The transition from manual hemocytometer counts to automated cell counting is a critical step in establishing robust, reproducible processes for manufacturing human induced pluripotent stem cells (hiPSCs) as advanced therapy medicinal products (ATMPs). This case study examines the validation of the NucleoCounter NC-100 system against the manual Bürker hemocytometer, a reference method in the European Pharmacopeia, for hiPSC counting in a current Good Manufacturing Practice (cGMP) environment. The validation followed ICH Q2(R1) guidelines and EudraLex cGMP regulations, demonstrating that the automated method offers superior precision, speed, and reproducibility, thereby supporting the scalable and reliable manufacturing of clinically relevant hiPSC doses [8] [4].
Manufacturing hiPSCs as ATMPs requires strict adherence to cGMP standards to ensure patient safety and product efficacy. A pivotal yet challenging aspect of this process is large-scale cell expansion to achieve therapeutically relevant cell doses [8] [11]. Consistent and accurate monitoring of cell concentration and viability is a fundamental Quality Control (QC) step, as viability is a critical quality attribute that impacts product reproducibility and process robustness [73] [11].
- Limitations of Manual Counting: The conventional manual method using a hemocytometer and trypan blue staining is heavily dependent on operator expertise and is time-consuming. It is prone to several sources of error, including human perception of what constitutes a cell, volume and pipetting inaccuracies, challenges in consistently determining viability, and insufficient counting events for statistical significance, often leading to coefficients of variation (CV) of 15% or higher [7].
- Advantages of Automation: Automated cell counting systems, particularly those based on fluorescence imaging, minimize human intervention and bias. They offer a solution to the variability and labor-intensive nature of manual counts, which is essential for the high standards of cGMP manufacturing [8] [7]. This case study details the experimental validation of such an automated system for hiPSCs.
Methods Comparison: Manual vs. Automated Cell Counting
The following table summarizes the core differences between the two counting methods examined in this case study.
Table 1: Core Comparison Between Manual and Automated Cell Counting Methods
| Feature | Manual Hemocytometer (Reference Method) | Automated NucleoCounter NC-100 (Proposed Method) |
|---|---|---|
| Principle | Bright-field microscopy with trypan blue exclusion [7] | Fluorescence imaging with acridine orange (AO) and DAPI or propidium iodide (PI) stains [7] [11] |
| Throughput | Time-consuming and laborious [8] | Fast and automated sample analysis [8] |
| Objectivity | High subjectivity; dependent on operator's criteria [7] | High objectivity; software-based algorithm for consistent cell definition [7] |
| Viability Stain | Trypan blue (can be toxic, may underestimate viability) [7] | DAPI/PI (membrane-impermeable DNA-binding dyes, more precise for dead cells) [7] [11] |
| Sample Volume | Inconsistent due to pipetting and chamber filling errors [7] | Pre-calibrated measurement chamber in disposable cassettes [7] |
| Key Advantage | Established, low-cost reference method | Higher precision, reproducibility, and integration with cGMP needs [8] [4] |
Experimental Protocol for Method Validation
The validation of the NucleoCounter NC-100 system was designed to comply with ICH Q2(R1) guidelines and cGMP requirements for ATMPs [8] [4] [11]. The core experiments are outlined below.
- 1. Cell Sample Preparation: hiPSCs were cultured and expanded under defined, feeder-free conditions. For counting, cell samples were prepared as single-cell suspensions. In the automated system, cells were mixed with fluorescent dyes either via pre-loaded cassettes (Via2-Cassette with AO/DAPI) or ready-to-use cassettes containing immobilized propidium iodide (PI) [7] [11].
- 2. Instrumentation and Counting: The reference method used a Bürker hemocytometer. Analysts performed counts according to standardized protocols, typically counting a limited number of chambers [8] [7]. The proposed method used the NucleoCounter NC-100 or similar models. The user simply loads the prepared sample cassette into the instrument, which automatically captures fluorescent images and analyzes them with a proprietary algorithm to calculate total and viable cell concentrations [7] [11].
- 3. Validation Parameters: The following parameters were assessed to validate the automated method [8] [4] [11]:
- Accuracy: The closeness of agreement between the automated method and the reference manual method.
- Precision: Evaluated through intra-operator reproducibility (repeatability) and inter-operator reproducibility (intermediate precision).
- Specificity: The ability to unequivocally assess the viable cell count in the presence of impurities like cell debris.
- Linearity and Range: The ability of the method to obtain results directly proportional to the cell concentration over a specified range.
Results: Quantitative Data from Validation Studies
The experimental data generated from the validation studies demonstrated a clear performance advantage for the automated counting system.
Table 2: Summary of Performance Data from Validation Experiments
| Validation Parameter | Manual Hemocytometer | Automated NucleoCounter NC-100 | Key Finding |
|---|---|---|---|
| Precision (CV) | CV often ≥15% (inter-operator) [7] | Higher precision; lower intra- and inter-operator CV [8] | Automated method is more reproducible and reduces user-dependent variability [8] [4]. |
| Linearity (R²) | Not explicitly reported | R² > 0.999 (demonstrated in similar automated systems) [54] | The automated method provides a linear response across a wide range of cell concentrations, essential for process monitoring. |
| Viability Assessment | Can underestimate viability due to trypan blue toxicity [7] | More reliable using AO/DAPI or AO/PI fluorescence [7] [11] | Fluorescent staining offers a more specific and accurate determination of cell viability, a critical quality attribute. |
| Time Efficiency | Time-consuming [8] | Significantly faster [8] | Automation increases laboratory throughput and reduces hands-on time, aligning with cGMP efficiency. |
Visualizing the Automated Cell Counting Workflow
The automated counting process with the NucleoCounter system involves specific steps from sample preparation to result analysis, as illustrated below.
Diagram 1: Automated Cell Counting Workflow.
Implementing the Validation Strategy for cGMP
For a method to be adopted in a cGMP environment, its validation strategy must be comprehensive and documented. The framework for this validation is based on specific regulatory guidelines and a systematic experimental design.
Regulatory Framework and Experimental Design
- Regulatory Compliance: The validation followed the ICH Q2(R1) guideline for analytical procedure validation and EudraLex Volume 4 (GMP for ATMPs) [8] [11]. This ensures the method is fit for its intended purpose in a regulated clinical manufacturing setting.
- Systematic Evaluation: A study on cell therapy workflows recommends a flowchart approach to evaluate new counting methods, emphasizing the need to assess method suitability for specific cell types and process steps (e.g., cells with or without magnetic beads) [15]. This involves creating dilution series and performing multiple replicates to statistically quantify counting method performance, as per ISO 20391-2 standards [15].
Critical Reagents and Materials for Validation
The following table lists key reagents and solutions used in the automated counting validation.
Table 3: Research Reagent Solutions for Automated Cell Counting Validation
| Reagent/Solution | Function in the Experimental Protocol |
|---|---|
| Via1-Cassette / Via2-Cassette | Disposable consumables with a pre-calibrated volume and immobilized fluorescent dyes for automated, uniform sample staining and loading [7]. |
| Acridine Orange (AO) | A cell-permeable fluorescent dye that binds to nucleic acids, staining the total cell population [7]. |
| DAPI (4',6-diamidino-2-phenylindole) | A membrane-impermeable dye that stains DNA of dead cells with compromised membranes, used for viability determination [7]. |
| Propidium Iodide (PI) | An alternative membrane-impermeable DNA-binding dye used in some cassettes to identify dead/non-viable cells [11]. |
| Defined Cell Culture Medium | For the expansion and maintenance of hiPSCs under feeder-free and serum-free conditions prior to counting [74] [75]. |
| Single-Cell Passivation Reagent | Used to create a single-cell suspension from hiPSC cultures, which is essential for accurate and reproducible counting [74]. |
This case study demonstrates that the NucleoCounter NC-100 automated cell counting system can be successfully validated for hiPSC counting in cGMP manufacturing. The data confirm that it is a more precise, reproducible, and efficient method compared to the traditional manual hemocytometer [8] [4]. By minimizing human error and variability, this automated method enhances the robustness of hiPSC manufacturing processes, directly supporting the production of safe and effective ATMPs for clinical applications. The validation framework outlined here provides a pathway for cGMP facilities to adopt automated cell counting, ultimately contributing to the advancement of regenerative medicine.
In the field of biotechnology and pharmaceutical development, particularly within the stringent framework of Good Manufacturing Practice (GMP), the precision of cell counting is a critical parameter for ensuring product quality, dosing accuracy, and experimental reproducibility. Precision is most commonly expressed as the Coefficient of Variation (%CV), which quantifies the degree of variability in a series of measurements relative to the mean. A lower %CV indicates higher precision and reliability. This guide provides an objective, data-driven comparison of the %CV achieved by manual hemocytometer methods versus various automated cell counting systems, drawing upon recent scientific studies and validation reports to inform researchers and drug development professionals.
Quantitative Comparison of %CV Performance
The core of this analysis lies in the direct comparison of %CV values reported for manual and automated methods across different experimental conditions and cell types. The data consistently demonstrate a significant precision advantage for automated systems.
Table 1: Summary of Reported %CV for Manual and Automated Cell Counting Methods
| Counting Method | Cell Type / Sample | Cellularity / Context | Reported %CV | Source (Reference) |
|---|---|---|---|---|
| Manual Hemocytometer | Synovial Fluid | Low (270 cells/mm³) | 27.9% | [76] |
| Synovial Fluid | Medium (6,200 cells/mm³) | 14.0% | [76] | |
| Synovial Fluid | High (25,000 cells/mm³) | 10.7% | [76] | |
| General Mammalian Cells | Routine culture (counting ~100 cells) | ≥15% (Typical) | [53] | |
| hiPSCs | cGMP manufacturing setting | Higher than automated | [8] | |
| Automated Cell Counter | Synovial Fluid | Low (600 cells/mm³) | 20.0% | [76] |
| Synovial Fluid | Medium (8,000 cells/mm³) | 3.4% | [76] | |
| Synovial Fluid | High (27,500 cells/mm³) | 2.9% | [76] | |
| General Mammalian Cells | Routine culture | ~5-15% (Aimed for) | [53] | |
| hiPSCs | cGMP manufacturing setting | Significantly lower than manual | [77] | |
| NucleoCounter NC-202 | General Mammalian Cells | Across a range of concentrations | Approx. half the CV of manual | [53] |
A key study comparing manual and automated cell counts in synovial fluid samples clearly illustrates this trend. The precision of both methods improves with higher cell concentrations, but the automated method demonstrates superior precision, particularly at medium and high cellularities where its %CV is several times lower [76]. In fact, the variances for automated counts at these concentrations were statistically significantly lower (F test, p<0.002) [76]. This trend is confirmed in a cGMP-compliant validation study for human induced pluripotent stem cells (hiPSCs), which concluded that the automated NucleoCounter NC-100 system showed "higher precision than the manual method" [77].
Detailed Experimental Protocols and Methodologies
To contextualize the data presented above, it is essential to understand the experimental designs from which these %CV values were derived.
Protocol 1: Precision Analysis in Synovial Fluid Cell Counts
This study was designed to determine the precision and agreement of synovial fluid cell counts [76].
- Objective: To determine the precision (intra-assay variability) of manual and automated cell counts.
- Sample Preparation: Synovial fluid samples were collected in EDTA tubes to prevent coagulation. Samples of low, medium, and high cellularity were selected for analysis.
- Counting Procedures:
- Manual Count: Samples were diluted with saline and loaded onto an improved Neubauer hemocytometer. Cells were counted manually under a microscope. Samples with low cell counts were analyzed undiluted, similar to cerebrospinal fluid protocol.
- Automated Count: Samples were analyzed directly on an automated counter (Coulter).
- Precision Measurement: Each sample was counted 10 times using both methods. The mean, standard deviation, and coefficient of variation (%CV) were calculated for each method and sample type. The variances between the two methods were compared using an F-test [76].
Protocol 2: Validation of an Automated Method for hiPSCs in cGMP
This study aimed to validate an automated cell counting method for the production of hiPSCs as advanced therapy medicinal products (ATMPs) [77].
- Objective: To validate the accuracy, precision, and linearity of an automated method against the European Pharmacopoeia reference manual method.
- Sample Preparation: Research-grade hiPSC batches were expanded and then dissociated into single-cell suspensions using accutase. The cells were pelleted and resuspended in PBS for counting.
- Counting Procedures:
- Reference Manual Method (Bürker Hemocytometer): A 10 µL cell suspension was loaded into each chamber of the hemocytometer. Counts were performed in duplicate by two analysts under a microscope, with viable cells identified based on morphology.
- Automated Method (NucleoCounter NC-100): For total cell count, 100 µL of cell suspension was pretreated with lysis and stabilizing buffers before measurement. Viable cell count was determined by analyzing non-viable cells without pretreatment. The proprietary software automatically calculated concentrations.
- Precision Measurement: The validation followed ICH Q2(R1) guidelines. Intra-operator and inter-operator reproducibility were assessed to determine precision, comparing the %CV and variances between the two methods [77].
Visualization of Precision Relationships
The following diagram illustrates the logical relationship between key variables affecting %CV and the resulting outcomes for manual and automated counting methods, as established by the experimental data.
The Scientist's Toolkit: Essential Reagents and Materials
The following table details key reagents and materials commonly used in the cell counting experiments cited, along with their critical functions.
Table 2: Key Research Reagent Solutions for Cell Counting
| Item | Function in Cell Counting | Key Consideration |
|---|---|---|
| Hemocytometer (Neubauer/Bürker) | A glass chamber with a calibrated grid for manually enumerating cells under a microscope. | The reference method in Pharmacopeia; reusable but prone to user-dependent variability [77] [1]. |
| Trypan Blue | A vital dye that is impermeable to intact membranes, staining only non-viable (dead) cells blue. | Can be toxic to cells over time and stain inconsistently, leading to viability overestimation [53] [7]. |
| Acridine Orange (AO) | A fluorescent, cell-permeable nucleic acid binding dye used in automated systems to stain all cells (total count). | Provides a consistent fluorescent signal, improving the accuracy of total cell identification [7]. |
| DAPI | A fluorescent, membrane-impermeable DNA-binding dye used in automated systems to stain dead cells. | Offers a more precise and consistent definition of dead cells compared to Trypan Blue [7]. |
| EDTA Tubes | Collection tubes containing an anticoagulant (e.g., K₃EDTA) to prevent sample clotting. | Ensures sample stability; cell counts in EDTA-preserved samples remain accurate for up to 48 hours at 4°C [76]. |
| Propidium Iodide (PI) | Another membrane-impermeable fluorescent dye used as an alternative to DAPI for identifying dead cells. | Used in systems like the NucleoCounter for viable cell count determination [77]. |
| Disposable Count Cassettes/Slides | Pre-calibrated, single-use devices for loading cell samples into automated counters (e.g., Via2-Cassette). | Eliminates pipetting and volume errors, ensures consistency, and reduces cross-contamination [7]. |
| Phosphate Buffered Saline (PBS) | A balanced salt solution used to wash and resuspend cells during sample preparation. | The choice of suspension medium can impact stain intensity and cell count results; culture medium may be preferable in some cases [1]. |
The body of evidence from multiple, independent studies leads to a consistent and unambiguous conclusion: automated cell counting methods provide a superior level of precision, as evidenced by significantly lower coefficients of variation, compared to manual hemocytometer methods. This precision advantage is most pronounced at medium and high cell concentrations and is critical in settings where reproducibility and accuracy are paramount, such as cGMP manufacturing of cell therapies like hiPSCs. While manual counting remains a low-cost option and can be performed with good precision (5-15% CV) by highly trained experts, the inherent limitations of human subjectivity and low statistical power make it a source of variability. Automated systems, through standardized algorithms, larger cell counts, and reduced human intervention, deliver the high precision and reliability required for advanced research and robust drug development.
Cell counting constitutes a fundamental analytical procedure in biomanufacturing and cell therapy workflows, serving as a critical measurement for determining viable cell numbers during cell processing [15]. The accuracy and consistency of cell counting directly impact crucial decisions, from adjusting culture conditions to determining final product dosing, making the selection of a suitable method paramount for product quality and process robustness [15] [77]. The properties of different cell types and their varying physical characteristics at different process stages introduce significant challenges in identifying appropriate counting methods [15]. These challenges are further compounded by process impurities such as cell debris or the presence of magnetic beads used in cell isolation procedures [15]. Within the framework of Good Manufacturing Practice (GMP) compliance, particularly for Advanced Therapy Medicinal Products (ATMPs), the validation of cell counting methods according to regulatory guidelines becomes an essential requirement to ensure patient safety and product efficacy [5] [77] [11].
This guide provides a comprehensive comparison of manual and automated cell counting methods, supported by experimental data and structured to aid researchers, scientists, and drug development professionals in selecting the most appropriate methodology based on specific cell types and process stages. The critical importance of this selection is underscored by the fact that cell counting is classified as a potency test in the context of cell therapy products, directly influencing the therapeutic dose delivered to patients [5].
Cell Counting Methodologies: Principles and Technologies
Manual Cell Counting with Hemocytometers
Manual cell counting using hemocytometers represents the historical gold standard and the reference method described in the European Pharmacopoeia [5] [77]. This method employs a specialized gridded chamber affixed to a glass slide, with chambers of known depth (typically 0.1 mm) creating demarcated areas of precisely defined volume [78]. The procedure involves loading a cell suspension, often mixed with a vital dye such as trypan blue, onto the chamber and visually counting cells under a microscope using a tally counter [78]. Viable cells are distinguished based on their ability to exclude the dye, with damaged or dead cells appearing blue due to membrane permeability [78]. The Bürker chamber, Neubauer improved chamber, and other variants (Malazzes, Thoma, Nageotte) differ primarily in their grid patterns but operate on the same fundamental principle [5] [79].
Automated Cell Counting Systems
Image-Based Automated Cell Counters: These systems automate the principles of manual hemocytometry by using digital cameras to capture images of cells within disposable counting chambers and applying sophisticated image analysis algorithms to identify and count cells [78] [80]. They provide statistical information on cell size and concentration, with fluorescence-capable models (e.g., Luna-FL, NucleoCounter NC-100) using fluorescent stains like acridine orange and propidium iodide to enhance live/dead discrimination, particularly in samples contaminated with non-cellular debris [78] [77] [11].
Coulter Counters: Unlike optical systems, Coulter counters measure electrical resistance across microchannels [78]. As cells suspended in an electrolyte solution pass through these channels, they cause brief increases in resistance due to their lower conductivity compared to the surrounding solution [78]. These resistance pulses are counted and sized, enabling accurate determination of cell concentration and size distribution without the ability to distinguish viability without additional modifications [78].
Flow Cytometers: As powerful cellular analysis tools, flow cytometers equipped with volume measurement capabilities can provide highly accurate cell counts while simultaneously discriminating cells based on multiple parameters including protein expression via fluorescently labelled antibodies [78]. This enables distinction between cell types of identical size within the same sample, though the complexity and cost of these systems often preclude their use for routine cell counting applications [78].
Table 1: Technical Comparison of Major Cell Counting Methods
| Method | Principle | Viability Assessment | Throughput | Cost Considerations |
|---|---|---|---|---|
| Manual Hemocytometer | Visual counting of cells in calibrated chamber | Dye exclusion (e.g., trypan blue) | Low (∼5 minutes/sample) [80] | Low equipment cost, high labor cost [80] |
| Image-Based Automated | Digital imaging + algorithm analysis | Fluorescence or brightfield dye exclusion | High (∼9 seconds/sample) [80] | Moderate equipment cost, low labor cost [80] |
| Coulter Counter | Electrical impedance change | Not inherently capable | Medium | High equipment cost, requires maintenance [78] |
| Flow Cytometer | Hydrodynamic focusing + optical detection | Fluorescent viability dyes | Medium to High | Very high equipment cost ($40,000-$100,000+) [78] |
Comparative Performance Analysis
Accuracy, Precision, and Reproducibility
Recent validation studies conducted under GMP-like conditions provide robust comparative data on the performance of manual versus automated cell counting methods. A comprehensive study comparing six different counting methods using both biological samples (eggplant microspores) and standardized fluorescent beads revealed that hemocytometers represented the most reasonable option from a technical perspective, explaining their widespread use [79]. Automated cell counters demonstrated good compromise between precision and affordability, though with somewhat limited accuracy compared to the gold standard [79].
In a validation study specifically focused on human induced pluripotent stem cells (hiPSCs) for GMP manufacturing, automated counting using the NucleoCounter NC-100 system demonstrated significantly higher precision compared to manual counting with a Bürker hemocytometer [77]. The automated method showed superior inter-operator and intra-operator reproducibility, with coefficients of variation (%CV) consistently below the acceptable threshold of 10% for viable cells, a critical requirement for cGMP manufacturing [77] [11]. Similar results were reported in a study validating the disposable Fast Read 102 device, where all tests met established acceptance criteria of CV less than 10% for total cells and under 5% for viable cells [5].
Linearity and Range
The linearity of an analytical procedure refers to its ability to obtain test results directly proportional to the concentration of an analyte within a given range [5]. Validation studies for automated methods have demonstrated excellent linearity across specified dilution ranges. For the Fast Read 102 device, the optimal dilution range was established between 1:8 and 1:128, producing slope values very close to 1, indicating direct proportionality between expected and measured concentrations [5]. Similarly, the NucleoCounter NC-100 system maintained linearity across its operational range of 5,000–2,000,000 cells/mL, providing reliable measurements for hiPSC manufacturing [77].
Table 2: Performance Metrics from Validation Studies
| Parameter | Manual Hemocytometer | Automated Image-Based | Flow Cytometry |
|---|---|---|---|
| Precision (%CV, viable cells) | Variable (operator-dependent) | <5% [5] [77] | <10% [79] |
| Time per Sample | ~5 minutes [80] | ~9 seconds [80] | Minutes (varies by protocol) |
| Linearity Range | Limited by visual counting error | 1:8 to 1:128 dilution [5] | Instrument-dependent |
| Operator Dependency | High [77] | Low [77] | Low to Moderate |
Method Selection Framework
Systematic Selection Flowchart
The following workflow provides a systematic approach to selecting the most appropriate cell counting method based on cell type, process stage, and specific application requirements:
Cell Counting Method Selection Workflow
Application-Based Selection Criteria
Cell Type Considerations: Different cell types present unique challenges for counting methods. Primary cells, such as those isolated from leukopaks, often contain debris and heterogeneous cell populations that complicate automated analysis [15]. For T-cells isolated using magnetic beads, image-based automated algorithms can be skewed by bead presence, requiring careful method selection and parameter optimization [15]. Human induced pluripotent stem cells (hiPSCs), with their clinical applications in regenerative medicine, necessitate validated counting methods that maintain accuracy throughout expansion phases [77] [11].
Process Stage Requirements: During early process development stages where speed and flexibility are prioritized, manual counting or basic automated systems may suffice. However, for in-process controls during GMP manufacturing, validated automated methods provide the necessary precision, documentation, and compliance [77] [11]. At final product release, where cell counting serves as a critical potency test, the highest level of accuracy and reproducibility is required, favoring thoroughly validated automated methods [5] [77].
Regulatory and Compliance Factors: In GMP environments, cell counting methods must undergo rigorous validation following ICH Q2(R1) guidelines, evaluating accuracy, precision, specificity, linearity, and range [77] [11]. The European Pharmacopoeia (10th edition) specifically describes manual hemocytometer counting as the reference method, though automated methods are acceptable when properly validated [77]. Regulatory guidelines also require instrument qualification (IQ/OQ), ongoing maintenance tracking, and software compliance with electronic record requirements (e.g., 21 CFR Part 11) [5] [77].
Experimental Protocols for Method Validation
Validation According to Regulatory Standards
For implementation in GMP manufacturing, cell counting methods must undergo comprehensive validation following established regulatory guidelines. The International Council for Harmonisation (ICH) Q2(R1) provides the framework for analytical procedure validation, requiring assessment of several key parameters [77] [11]:
Accuracy: Demonstrates the closeness of agreement between the test method and a reference method. Experimental protocol: Prepare a dilution series of cell samples (e.g., 1:1, 1:2, 1:3, 1:4, 1:5) spanning the expected concentration range [15]. Analyze each dilution using both the test and reference methods (typically manual hemocytometer). Calculate accuracy as the percentage recovery of the known concentration or correlation between methods [77] [11].
Precision: Assesses the degree of scatter between a series of measurements from multiple sampling of the same homogeneous sample. Experimental protocol: For intra-assay precision, prepare a single homogeneous cell suspension and analyze multiple replicates (n≥5) in a single session by a single operator. For inter-assay precision, repeat the analysis across different days, with different operators, or using different instrument lots. Express precision as the coefficient of variation (%CV) across measurements [5] [77].
Linearity and Range: Determines the ability to obtain results proportional to analyte concentration and the interval over which this proportionality holds. Experimental protocol: Prepare a series of cell dilutions covering the entire expected concentration range (e.g., from 50,000 to 2,000,000 cells/mL). Analyze each dilution in triplicate and plot measured concentration against expected concentration. Apply linear regression analysis; the method is considered linear if the correlation coefficient (R²) exceeds 0.98-0.99 [5] [77].
Specificity: Evaluates the ability to unequivocally assess the analyte in the presence of other components. Experimental protocol: Analyze the sample matrix (e.g., PBS without cells) to confirm absence of interference. For complex samples containing debris or beads, compare counts with and without purification steps [77] [11].
Sample Preparation Standardization
Proper sample preparation is critical for obtaining reliable and reproducible cell counts across different methods:
Cell Harvesting and Staining: For consistent results, standardize digestion protocols (e.g., accutase incubation time and temperature) to generate single-cell suspensions without excessive clumping [77]. When using viability dyes, maintain consistent dye-to-cell ratios and incubation times; for trypan blue, use a 1:1 dye-to-cell ratio [78] [80]. For fluorescent methods, ensure proper staining with acridine orange/propidium iodide according to manufacturer specifications [78] [11].
Dilution Series Preparation: Create dilution series using appropriate buffers (e.g., dPBS with Human Serum Albumin) to maintain cell viability [15]. Ensure dilutions span the optimal counting range for each method: 50,000–550,000 cells/mL for manual hemocytometers and 5,000–2,000,000 cells/mL for automated systems like the NucleoCounter NC-100 [77]. Verify pipetting accuracy using gravimetric methods to ensure %CV ≤ 2.0% [79].
Essential Research Reagent Solutions
Table 3: Key Reagents and Materials for Cell Counting Applications
| Reagent/Material | Function | Application Notes |
|---|---|---|
| Trypan Blue | Vital dye for viability assessment | Membranes of non-viable cells become permeable, staining cells blue [78] [80] |
| Acridine Orange/Propidium Iodide | Fluorescent viability stains | Acridine orange stains all cells (green), PI stains non-viable cells (red) [78] |
| Disposable Counting Chambers | Precisely molded chambers for automated counters | Eliminate cleaning variability and cross-contamination [5] [80] |
| DPBS with HSA | Dilution buffer for primary cells | Maintains cell viability during counting procedure [15] |
| Fluorospheres | Standardized beads for method validation | Provide known concentration reference for accuracy determination [79] |
| Lysis Buffer (for total count) | Lyses cells without nuclei for total nucleated cell count | Used in systems like NucleoCounter for total cell count [77] |
The selection of an appropriate cell counting method represents a critical decision point in biomanufacturing and cell therapy development, with significant implications for process consistency and product quality. While manual hemocytometer counting remains the pharmacopeial reference method, automated systems offer compelling advantages in precision, throughput, and compliance for GMP manufacturing environments [77] [11]. The optimal selection strategy must consider multiple factors including cell type characteristics, process stage requirements, sample complexity, and regulatory constraints. By applying the systematic selection framework and validation protocols outlined in this guide, researchers and manufacturers can implement robust, fit-for-purpose cell counting methods that ensure accurate and reliable measurement of this critical quality attribute throughout the product development lifecycle. As the field of cell therapy continues to advance, further standardization of counting methodologies following initiatives from organizations such as ISO and NIST will be essential for reducing variability and enhancing confidence in cell-based products [15].
Conclusion
The transition from manual to automated cell counting represents a significant advancement in ensuring the quality, safety, and efficacy of cell-based therapies produced under GMP. While the hemocytometer remains a valuable reference, automated systems, particularly those using fluorescent image cytometry, offer superior precision, reduced operator-dependent variability, and enhanced data integrity—all critical for regulatory compliance and successful product release. The choice between methods must be guided by a rigorous, validated approach tailored to the specific cell type and manufacturing stage. Future directions will likely involve greater integration of fully automated systems, adherence to evolving ISO standards, and the development of more sophisticated algorithms to handle complex cell samples, further solidifying the role of reliable cell counting as a cornerstone of robust biomanufacturing.
References
- 1. Challenges of Cell Counting in Cell Therapy Products - PMC [https://pmc.ncbi.nlm.nih.gov/articles/PMC11520012/]
- 2. Cell Counting for Cell Therapies | NIST [https://www.nist.gov/programs-projects/cell-counting-cell-therapies]
- 3. Analysis of the measurements used as potency tests for the 31 ... [https://translational-medicine.biomedcentral.com/articles/10.1186/s12967-025-06253-4]
- 4. Validation of an automated cell counting method for cGMP ... [https://pubmed.ncbi.nlm.nih.gov/35198419/]
- 5. Validation of analytical methods in GMP: the disposable Fast ... [https://translational-medicine.biomedcentral.com/articles/10.1186/1479-5876-10-112]
- 6. Advantages & disadvantages of automated cell counters [https://chemometec.com/advantages-and-disadvantages-automated-cell-counters/]
- 7. Automated vs. Manual Cell Counting - The Complete Guide [https://chemometec.com/manual-vs-automated-cell-counting/]
- 8. Validation of an automated cell counting method for cGMP ... [https://www.sciencedirect.com/science/article/pii/S2215017X22000091]
- 9. Comparison between manual and automated methods for ... [https://www.frontiersin.org/journals/cell-and-developmental-biology/articles/10.3389/fcell.2025.1556697/full]
- 10. Validation of analytical methods in GMP: the disposable Fast ... [https://pmc.ncbi.nlm.nih.gov/articles/PMC3502295/]
- 11. Validation of an automated viable cell counting assay for ... [https://www.sciencedirect.com/science/article/abs/pii/S1369703X23001481]
- 12. Assessing the suitability of cell counting methods during ... [https://www.frontiersin.org/journals/bioengineering-and-biotechnology/articles/10.3389/fbioe.2023.1223227/full]
- 13. The Secrets of the World of Cell Counters [https://chemometec.com/the-ultimate-guide-to-cell-counters/]
- 14. Automated cell counting drives development of novel ... [https://www.selectscience.net/article/automated-cell-counting-drives-development-of-novel-therapeutics]
- 15. Assessing the suitability of cell counting methods during ... [https://pmc.ncbi.nlm.nih.gov/articles/PMC10438949/]
- 16. Practical application of cell counting method performance ... [https://www.insights.bio/cell-and-gene-therapy-insights/journal/article/2177/Practical-application-of-cell-counting-method-performance-evaluation-and-comparison-derived-from-the-ISO-Cell-Counting-Standards-Part-1-and-2]
- 17. Comparison of manual and automated cell counts in EDTA ... [https://pubmed.ncbi.nlm.nih.gov/9389224/]
- 18. Processing Adipose Tissue Samples in a GMP ... [https://www.mdpi.com/2227-9059/11/9/2533]
- 19. Experimental Study on Multi-Cell Counting Using an ... [https://www.mdpi.com/2076-3417/15/10/5701]
- 20. A Comparison Between USP and ISO Standards [https://canyonlabs.com/a-comparison-between-usp-and-isp-standards/]
- 21. GMP vs ISO: What's the Difference? [https://www.bachem.com/articles/blog/gmp-vs-iso-whats-the-difference/]
- 22. GMP and ISO 13485 Standards [https://www.bprhub.com/blogs/gmp-iso-13485-differences-comparisons]
- 23. Cell counting in GMP environments [https://chemometec.com/cell-counting-in-gmp-environments/]
- 24. Ultimate Comparison of Cell Counters: 6 Factors to Choose ... [https://unisonbiomed.com/comparison-of-cell-counters/]
- 25. Qualification of a flow cytometry-based method for the ... [https://pmc.ncbi.nlm.nih.gov/articles/PMC10830575/]
- 26. Counting cells using a hemocytometer [https://www.abcam.com/en-us/technical-resources/protocols/counting-cells-using-a-haemocytometer]
- 27. Manually Counting Cells in a Hemocytomer [https://www.thermofisher.com/us/en/home/references/gibco-cell-culture-basics/cell-culture-protocols/counting-cells-in-a-hemacytometer.html]
- 28. Spilling the secrets: How to count cells with a hemocytometer [https://chemometec.com/how-to-count-cells-with-a-hemocytometer/]
- 29. Trypan Blue Exclusion | Thermo Fisher Scientific - US [https://www.thermofisher.com/us/en/home/references/gibco-cell-culture-basics/cell-culture-protocols/trypan-blue-exclusion.html]
- 30. Cell Counting With a Hemocytometer: As Easy as 1, 2, 3 [https://bitesizebio.com/13687/cell-counting-with-a-hemocytometer-easy-as-1-2-3/]
- 31. Comparison of Cell Counting Using Countess II Automated ... [https://www.thermofisher.com/us/en/home/life-science/cell-analysis/cell-analysis-learning-center/cell-analysis-resource-library/cell-analysis-application-notes/comparison-cell-counting-countess-ii-automated-cell-counters-hemocytometers.html]
- 32. Validation of three viable-cell counting methods [https://pmc.ncbi.nlm.nih.gov/articles/PMC5466062/]
- 33. Cell Counting Methods for the Lab | Manual ... [https://www.corning.com/worldwide/en/products/life-sciences/resources/stories/in-the-field/cell-counting-methods-for-the-lab.html]
- 34. The potential of microfluidic cell analysis in CAR T ... [https://pmc.ncbi.nlm.nih.gov/articles/PMC12605917/]
- 35. Automated Cell Counters Market Size & Share Analysis [https://www.mordorintelligence.com/industry-reports/automated-cell-counters-market]
- 36. CellDrop™ Automated Cell Counters - DeNovix [https://www.denovix.com/products/celldrop/]
- 37. Automated smartphone based cell analysis platform [https://www.nature.com/articles/s44303-025-00093-z]
- 38. What is the future of electrical impedance spectroscopy in ... [https://pmc.ncbi.nlm.nih.gov/articles/PMC8651262/]
- 39. Automated cytometric gating with human-level ... [https://www.nature.com/articles/s41467-025-56622-2]
- 40. A new modality for visualizing cells using microfluidic ... [https://www.sciencedirect.com/science/article/pii/S2590137025000469]
- 41. Benefits of using validation slides over NIST standard beads [https://www.selectscience.net/resource/how-to-validate-automated-cell-counters-benefits-of-using-validation-slides-over-nist-standard-beads]
- 42. Why Is Cell Counting Becoming a Strategic Priority in ... [https://www.marketsandmarkets.com/blog/HC/navigating-the-future-of-cell-counting]
- 43. Global Cell Counting Market Size, Share, Growth Analysis ... [https://www.openpr.com/news/4261032/global-cell-counting-market-size-share-growth-analysis-2025]
- 44. TN 197 AO/PI Fluorescence Assay vs. Trypan Blue [https://www.denovix.com/tn-197-ao-pi-fluorescence-assay-vs.-trypan-blue/]
- 45. Ch.4-2 Fluorescence dye solution (PI / AO / DAPI) [https://www.blog-nanoentek.com/post/types-of-cell-dye-staining-solution-part-ii]
- 46. DAPI Staining: Fluorescent DNA Binding for Cell Imaging [https://www.bosterbio.com/blog/post/dapi-staining?srsltid=AfmBOooZWzuGuXWIMUzAQtkrftwxp6TNioth9SgUAs1chslaCy_PeYdA]
- 47. Solution 13 [https://chemometec.com/reagents/solution-13/]
- 48. Trypan Blue vs AO/PI: Viability Staining Method Comparison [https://www.revvity.com/ask/comparing-trypan-blue-and-aopi-staining-methods]
- 49. DAPI Protocol for Fluorescence Imaging [https://www.thermofisher.com/us/en/home/references/protocols/cell-and-tissue-analysis/protocols/dapi-imaging-protocol.html]
- 50. Comparison of trypan blue dye exclusion and fluorometric ... [https://pubmed.ncbi.nlm.nih.gov/7764357/]
- 51. Manual vs. Automated Cell Counters [https://www.denovix.com/manual-vs-automated-cell-counters/]
- 52. Sources of Hemocytometer Counting Errors [https://www.revvity.com/ask/sources-of-hemocytometer-counting-errors]
- 53. Revealing the precision of your manual cell counts [https://chemometec.com/perfect-precision-manual-cell-counting/]
- 54. Comparing Manual and Automated Counting Methods [https://www.revvity.com/ask/comparing-manual-and-automated-counting-methods]
- 55. Evaluating the Quality of Cell Counting Methods [https://www.nist.gov/programs-projects/evaluating-quality-cell-counting-methods-experimental-design-and-statistical]
- 56. 8 common pipetting errors and how to avoid them | INTEGRA [https://www.integra-biosciences.com/united-states/en/stories/8-common-pipetting-errors-and-simple-solutions-address-them]
- 57. Common Challenges of Cell Counting with a Hemocytometer [https://www.denovix.com/challenges-cell-counting-hemocytometer/]
- 58. Comparison of six different methods to calculate cell densities [https://plantmethods.biomedcentral.com/articles/10.1186/s13007-018-0297-4]
- 59. Development of Robust Cell Therapy Manufacturing ... [http://clinmedjournals.org/articles/ijscrt/international-journal-of-stem-cell-research-and-therapy-ijscrt-9-074.php?jid=ijscrt]
- 60. Performance comparison of streptavidin magnetic beads for ... [https://journals.plos.org/plosone/article?id=10.1371/journal.pone.0322375]
- 61. Creating a GMP cell processing program [https://www.sciencedirect.com/science/article/abs/pii/S1521692625000192]
- 62. Comparative Analysis of Sample Loop and Counting Bead ... [https://pubmed.ncbi.nlm.nih.gov/41259737/]
- 63. Cell counting workshop | Top tips for human iPSC-derived ... [https://www.bit.bio/resources/webinars/cell-counting-workshop-top-tips-for-human-ipsc-derived-cells]
- 64. DMSO induces drastic changes in human cellular ... [https://www.nature.com/articles/s41598-019-40660-0]
- 65. High-throughput quantification of the effect of DMSO on ... [https://pmc.ncbi.nlm.nih.gov/articles/PMC6620243/]
- 66. Impact of Different Cell Counting Methods in Molecular ... [https://pmc.ncbi.nlm.nih.gov/articles/PMC9140187/]
- 67. Cell Counting Market Size to Worth USD 22.87 Billion by ... [https://finance.yahoo.com/news/cell-counting-market-size-worth-070600273.html]
- 68. FDA criticises Equipment Qualification and Process ... [https://www.gmp-compliance.org/gmp-news/fda-criticises-equipment-qualification-and-process-validation]
- 69. ICH Q2(R2) Validation of analytical procedures [https://www.ema.europa.eu/en/ich-q2r2-validation-analytical-procedures-scientific-guideline]
- 70. ICH Q2 and ICH Q14 revisions clarify analytical methods ... [https://www.pharmalex.com/thought-leadership/blogs/ich-q2-and-ich-q14-revisions-clarify-analytical-methods-for-biologics/]
- 71. ICH and FDA Guidelines for Analytical Method Validation [https://www.labmanager.com/ich-and-fda-guidelines-for-analytical-method-validation-34252]
- 72. ICH Q2(R2) & Q14 for biologics: Best practices [https://www.biophorum.com/download/best-practices-for-the-development-validation-and-registration-of-analytical-procedures-implementation-of-ich-q2-r2-and-q14-for-biologics/]
- 73. Validation of an automated viable cell counting assay for ... [https://ui.adsabs.harvard.edu/abs/2023BioEJ.19608953P/abstract]
- 74. cGMP-Manufactured Human Induced Pluripotent Stem ... [https://pmc.ncbi.nlm.nih.gov/articles/PMC4624993/]
- 75. Good Manufacturing Practice–compliant human induced ... [https://www.sciencedirect.com/science/article/pii/S1465324924000707]
- 76. Comparison of manual and automated cell counts in EDTA ... [https://pmc.ncbi.nlm.nih.gov/articles/PMC1752268/]
- 77. Validation of an automated cell counting method for cGMP ... [https://pmc.ncbi.nlm.nih.gov/articles/PMC8851089/]
- 78. Overview of Cell Counting Methods: Manual and ... [https://logosbio.com/how-to-count-cells-an-overview-of-cell-counting-methods/]
- 79. Comparison of six different methods to calculate cell ... [https://pmc.ncbi.nlm.nih.gov/articles/PMC5901878/]
- 80. Manual vs. Automated, Which to Choose for Cell Counting? [https://www.rwdstco.com/manual-and-automated-cell-counting/]