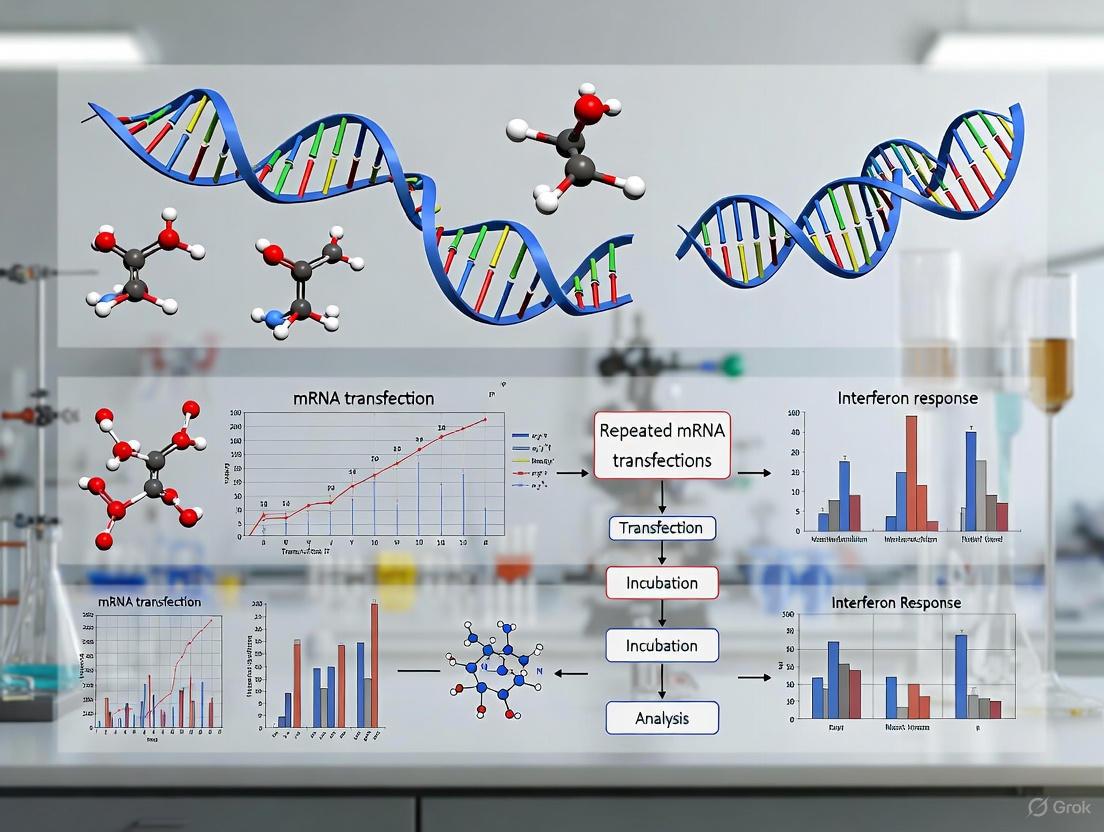
Overcoming Interferon Response in Repeated mRNA Transfections: Strategies for Enhanced Efficacy and Sustained Protein Expression
The success of mRNA-based therapeutics, from vaccines to protein replacement therapies, is often challenged by the host's innate immune response, particularly the type I interferon (IFN) reaction triggered by exogenous...
Overcoming Interferon Response in Repeated mRNA Transfections: Strategies for Enhanced Efficacy and Sustained Protein Expression
Abstract
The success of mRNA-based therapeutics, from vaccines to protein replacement therapies, is often challenged by the host's innate immune response, particularly the type I interferon (IFN) reaction triggered by exogenous mRNA. This response, while offering self-adjuvant properties in vaccines, acts as a major barrier for repeated administrations by inhibiting translational efficiency and shortening protein expression duration. This article synthesizes foundational research and recent advances to provide a comprehensive framework for scientists and drug developers. We explore the molecular mechanisms of IFN activation through sensors like RIG-I, MDA5, and TLRs, detail methodological breakthroughs in nucleotide modification, LNP engineering, and co-delivered boosters, and present optimization strategies for sequential dosing. Finally, we review preclinical and clinical validation data, comparing the efficacy of various platforms in overcoming this critical hurdle to unlock the full potential of multi-dose mRNA regimens.
The Interferon Barrier: Understanding the Innate Immune Response to Exogenous mRNA
The innate immune system utilizes a sophisticated set of pattern recognition receptors (PRRs) to detect foreign mRNA and initiate antiviral responses. Among these, the RIG-I-like receptors (RLRs) and Toll-like receptors (TLRs) play pivotal roles in sensing viral RNA in distinct cellular compartments. RIG-I and MDA5 survey the cytosol for abnormal RNA species, while TLR7 and TLR8 reside in endosomal membranes to detect ingested RNA. Upon ligand binding, these receptors trigger signaling cascades that culminate in the production of type I interferons (IFN-α/β) and proinflammatory cytokines, establishing an antiviral state in the host cell. Understanding the specific functions, ligands, and signaling pathways of these receptors is crucial for researchers developing mRNA-based therapeutics, where uncontrolled interferon activation can undermine protein expression and induce unwanted immune responses.
Receptor Fundamentals: Ligands, Signaling, and Localization
The following table summarizes the key characteristics of the major mRNA-sensing receptors.
| Feature | RIG-I | MDA5 | TLR7 | TLR8 |
|---|---|---|---|---|
| Primary Ligands | Short dsRNA with 5' triphosphate (5'ppp); blunt-ended dsRNA [1] [2] | Long double-stranded RNA (dsRNA) [1] [3] | Single-stranded RNA (ssRNA); GU-rich sequences [3] [4] | Single-stranded RNA (ssRNA) [3] [4] |
| Localization | Cytosolic [3] | Cytosolic [3] | Endosomal [4] | Endosomal [4] |
| Adaptor Protein | Mitochondrial Antiviral-Signaling protein (MAVS, also known as IPS-1/Cardif/VISA) [1] [5] | Mitochondrial Antiviral-Signaling protein (MAVS) [1] [5] | Myeloid Differentiation Primary Response 88 (MyD88) [6] | Myeloid Differentiation Primary Response 88 (MyD88) [6] |
| Key Transcription Factors Activated | IRF-3, IRF-7, NF-κB [1] [6] | IRF-3, IRF-7, NF-κB [1] [6] | IRF-7, NF-κB [6] | IRF-7, NF-κB [6] |
| Primary Cell Types | Ubiquitous; all cell types [3] | Ubiquitous; all cell types [3] | Plasmacytoid Dendritic Cells (pDCs) [7] | Monocytes; Myeloid Dendritic Cells (mDCs) [4] |
Troubleshooting Guide: Common Experimental Issues & Solutions
Q1: My mRNA transfection consistently triggers a strong type-I IFN response, impairing my protein yield. How can I pinpoint which receptor is responsible?
This is a classic challenge in mRNA-based therapeutic development. A systematic approach using genetic and pharmacological tools is required to identify the culprit receptor.
Recommended Experimental Protocol:
- Utilize Genetic Knockdown/Knockout: Use siRNA or CRISPR-Cas9 to deplete individual receptors in your cell model (e.g., HEK-293 or dendritic cells). Transfect with your mRNA and measure IFN-β mRNA levels by qRT-PCR. The receptor whose absence most significantly ablates the IFN response is the primary sensor.
- Employ Selective Pharmacological Inhibitors: Treat cells with published inhibitors prior to transfection.
- RIG-I: There are no highly specific commercial inhibitors, but its signaling can be blocked upstream.
- MDA5: C20 (a cardenolide glycoside) has been reported to inhibit MDA5 filament formation.
- General RLR Pathway: Target the common adaptor MAVS (IPS-1) with siRNA. Ablation of MAVS abolishes signaling from both RIG-I and MDA5 [6] [8].
- Measure Downstream Signaling: Analyze phosphorylation of IRF-3 and NF-κB via Western blot, or use reporter assays for IRF-3/7 and NF-κB activation. Distinct kinetics and magnitudes can hint at the involved pathway.
Solution: The table below outlines the expected outcomes if a specific receptor is the main sensor of your mRNA preparation.
| Experimental Intervention | If RIG-I is Main Sensor | If MDA5 is Main Sensor | If TLR7/8 is Main Sensor |
|---|---|---|---|
| RIG-I Knockdown | >70% reduction in IFN-β | Minimal change in IFN-β | Minimal change in IFN-β |
| MDA5 Knockdown | Minimal change in IFN-β | >70% reduction in IFN-β | Minimal change in IFN-β |
| MAVS Knockdown | Near-complete loss of IFN-β | Near-complete loss of IFN-β | Minimal change in IFN-β |
| MyD88 Inhibition | No effect | No effect | Significant reduction in IFN-β |
| Endosomal Acidification Inhibition (Chloroquine) | No effect | No effect | Significant reduction in IFN-β |
Q2: I am working with a novel mRNA construct. How can I predict its potential immunogenicity via RIG-I/MDA5?
Immunogenicity is largely determined by the RNA's structural features. RIG-I and MDA5 have distinct ligand preferences, which can be assessed through a combination of in silico and empirical methods.
Recommended Experimental Protocol:
- In Silico Prediction:
- In Vitro Binding/Activation Assay:
- Protein Expression: Express and purify the recombinant caspase activation and recruitment domains (CARDs) of RIG-I and MDA5, along with their helicase domains.
- Electrophoretic Mobility Shift Assay (EMSA): Incubate your in vitro-transcribed (IVT) mRNA with the purified proteins. A band shift indicates direct binding.
- Reporter Assay: Co-transfect cells with your mRNA construct and luciferase reporter plasmids under the control of an IFN-β promoter or an IRF-3-responsive promoter. This confirms functional activation of the pathway.
Solution:
- To minimize RIG-I activation, ensure efficient 5' capping (to remove the 5' triphosphate) and 3' end processing. Also, consider incorporating modified nucleotides like pseudouridine, which can dampen RIG-I recognition [2].
- To minimize MDA5 activation, avoid long stretches of perfect duplex formation within the mRNA sequence. Disrupting extended secondary structures can reduce MDA5 activation.
Q3: My data suggests both RLR and TLR pathways are activated upon mRNA delivery. How can I model and exploit this crosstalk?
Crosstalk between TLR and RLR pathways is an emerging and critical area, as it can lead to a synergistic antiviral response. This can be harnessed for vaccine adjuvant design but must be suppressed for protein replacement therapies.
Recommended Experimental Protocol:
- Stimulate with Specific Agonists: Use well-characterized ligands to map the crosstalk in your system.
- Measure Synergistic Output: Co-stimulate cells with sub-optimal doses of TLR and RLR agonists. A synergistic increase in IL-12p70 and IFN-β (measured by ELISA) is a hallmark of pathway crosstalk [4].
- Genetic Validation: Use MyD88-deficient cells (for TLR) and MAVS-deficient cells (for RLR) to confirm that the synergistic effect requires both signaling pathways.
Solution:
- For Vaccine Development: The combination of a TLR8 agonist (e.g., Motolimod) and an RLR agonist (e.g., poly(I:C)) induces a potent IL-12 and type-I IFN response, which is ideal for driving strong cellular immunity [4]. This can be incorporated into mRNA vaccine formulations.
- For Therapeutic Protein Expression: To avoid this crosstalk, ensure your mRNA is highly purified to remove double-stranded RNA (dsRNA) contaminants (the RLR ligand) and use delivery systems that minimize endosomal TLR activation.
Essential Signaling Pathways
The following diagram illustrates the core signaling pathways from each receptor, highlighting the key molecules and their interactions leading to interferon and cytokine production.
The Scientist's Toolkit: Key Research Reagents
This table provides a curated list of essential reagents for studying mRNA-sensing pathways, based on protocols and compounds cited in the literature.
| Reagent / Tool | Primary Function / Target | Example Use Case | Key Consideration |
|---|---|---|---|
| Poly(I:C) (High MW) | MDA5 & TLR3 agonist [3] [4] | Positive control for MDA5 activation; inducing IFN-β response. | High molecular weight (HMW) preparations preferentially activate MDA5. |
| Poly(I:C) / LyoVec | RIG-I & MDA5 agonist (transfection-ready) [4] | Positive control for cytosolic RLR pathway activation. | LyoVec facilitates delivery into the cytosol, ensuring RLR engagement. |
| R848 (Resiquimod) | TLR7 & TLR8 agonist [4] | Stimulating endosomal TLR pathways in immune cells. | Activates both TLR7 and TLR8; check cell-specific receptor expression. |
| 5'ppp RNA | Specific RIG-I ligand [1] [2] | Specific activation of RIG-I pathway in transfection experiments. | Must be in vitro transcribed without a cap. Confirms RIG-I-dependent responses. |
| Chloroquine | Endosomal acidification inhibitor [4] | Blocking endosomal TLR (TLR7/8/9) signaling. | Controls for endosomal vs. cytosolic sensing. Can have off-target effects. |
| siRNA (RIG-I, MDA5, MAVS, MyD88) | Gene-specific knockdown [6] [8] | Determining the specific receptor/adaptor responsible for IFN induction. | Always include a non-targeting siRNA control; confirm knockdown via qPCR/Western. |
| IFN-β Promoter Luciferase Reporter | Measuring pathway activation output [8] | Quantifying integrated transcriptional activity downstream of PRR signaling. | Standardized readout for comparing immunogenicity of different mRNA constructs. |
| Selgantolimod (GS-9686) | Selective TLR8 agonist [4] | Activating TLR8-specific responses in human myeloid cells. | More specific than R848 for dissecting TLR7 vs. TLR8 roles. |
| Vesatolimod (GS-9620) | Selective TLR7 agonist [4] | Activating TLR7-specific responses in pDCs. | Tool for probing pDC-specific biology without TLR8 engagement. |
FAQs: Understanding IFN-β and Translation Suppression
Q1: What is the core mechanism by which IFN-β inhibits protein translation? IFN-β inhibits protein translation by disrupting the cap-dependent translation process. This occurs at a step after the association of cap-binding factors and the small ribosome subunit but before the formation of the 80S ribosome [9]. This mechanism specifically targets exogenous mRNAs that enter across the cytoplasmic membrane, such as those delivered via transfection, while the translation of endogenous host mRNAs is largely preserved [9].
Q2: How does IFN-β-induced translation suppression differ from the effects of PKR? The suppression of translation by IFN-β is a potent, PKR-independent activity [9]. While the double-stranded RNA-dependent protein kinase (PKR) inhibits translation by phosphorylating eukaryotic translation initiation factor 2α (eIF2α), IFN-β priming induces a separate pathway that blocks translation at the initiation stage without relying on eIF2α phosphorylation by PKR [9].
Q3: Why does my experimentally delivered mRNA show poor antigen expression, even when using modified nucleotides? Poor antigen expression from delivered mRNA can result from the innate immune response triggered by the mRNA itself. In vitro transcribed (IVT) mRNA is recognized by pattern recognition receptors (PRRs) like Toll-like Receptors (TLRs) and RIG-I-like receptors (RLRs), leading to the production of type I interferons, including IFN-β [10] [11]. The ensuing IFN-β signaling initiates an antiviral state in the cell, which actively suppresses the translation of exogenous mRNA [9]. Although nucleotide modifications (e.g., pseudouridine) can reduce IFN production, they may not completely abolish it, and the IFN-β that is produced can still exert its potent translational suppression effects.
Q4: What are the key downstream effectors in the IFN-β signaling pathway that I should measure to confirm its activation? To confirm IFN-β pathway activation, you should measure the phosphorylation of STAT1 and STAT2 transcription factors, which form the ISGF3 complex with IRF9 [12] [13]. This complex translocates to the nucleus and binds to Interferon-Stimulated Response Elements (ISREs), driving the expression of Interferon-Stimulated Genes (ISGs) [13]. Key indicative ISGs include ISG15, Oasl1, and Ifit3 [14]. Detection of these proteins or their transcripts serves as a reliable marker for active IFN-β signaling.
Q5: In the context of repeated mRNA transfections, how can I mitigate the suppressive effects of the IFN-β response? Mitigating the IFN-β response in serial transfections is challenging. Potential strategies include:
- Using highly modified mRNA: Incorporate modified nucleotides like pseudouridine (ψ) and 5-methyl-cytidine (m5C) to reduce the immunogenicity of the mRNA [10] [11].
- Employing IFNAR blockers: Using inhibitors or neutralizing antibodies against the IFN-α/β receptor (IFNAR) can block the downstream signaling cascade [10].
- Optimizing delivery systems: Selecting transfection reagents (e.g., certain liposomal carriers) that cause less innate immune activation can be beneficial [11].
- Note on small molecules: A systematic screen found that several commercially available small molecules targeting IFN pathways did not enhance mRNA transfection efficiency and some even inhibited protein expression, suggesting this approach may not be viable [10].
Troubleshooting Guides
Problem 1: Low Transfection Efficiency and Protein Yield in Primary Human Cells
Observation: Following mRNA transfection in primary human monocytes, macrophages, or fibroblasts, the percentage of transfected cells and the mean fluorescence intensity of a reporter protein (e.g., GFP) are low.
Potential Cause: Strong innate immune activation by the transfected mRNA, leading to a robust IFN-β response that shuts down cap-dependent translation [9] [11].
Solutions:
- Verify mRNA Modification: Ensure your IVT mRNA incorporates modified nucleotides (pseudouridine and 5-methyl-cytidine). Test a side-by-side comparison of modified vs. unmodified mRNA to assess its impact on both IFN-β production and final protein yield [11].
- Titrate mRNA Dose: High mRNA doses can exacerbate immune activation. Perform a dose-response experiment to find the lowest mRNA concentration that provides acceptable protein expression with minimal innate immune signaling [11].
- Screen Transfection Reagents: Different carriers (e.g., liposomal vs. polymer-based) vary in their propensity to activate innate immunity. Screen multiple reagents to identify one that offers high gene transfer rates with only moderate immune cell activation [11].
- Directly Measure IFN-β Response: Quantify the level of IFN-β in the supernatant 6-24 hours post-transfection using ELISA. Also, check the expression of ISGs (e.g., ISG15, OAS1) via RT-qPCR or Western Blot to directly correlate low yield with pathway activation [11] [14].
Problem 2: Unintended Immunogenicity in mRNA Vaccine or Therapeutic Protein Production
Observation: An mRNA-based platform designed to express a therapeutic antigen or protein triggers a strong type I interferon response, skewing the experimental outcome and reducing the yield of the desired protein.
Potential Cause: The mRNA component and/or the lipid nanoparticle (LNP) carrier is recognized by the innate immune system, activating cytosolic sensors (e.g., RIG-I, MDA5) or endosomal TLRs, which drive IFN-β production [11] [14].
Solutions:
- Decouple Immune Activation: To determine whether the LNP or the mRNA is the primary driver, perform control transfections with empty LNP and LNP containing modified mRNA. Transcriptomic analysis can reveal that inflammatory cytokines (IL-6, TNF) are often LNP-driven, while ISG responses are mRNA-driven [14].
- Purify mRNA: Ensure the IVT mRNA is highly purified to remove double-stranded RNA contaminants, which are potent inducers of IFN-β [10].
- Target Fibroblasts: Recognize that at the injection site, fibroblasts are major targets for mRNA uptake and potent producers of IFN-β. Designing strategies to modulate fibroblast responses could help control immunogenicity [14].
Experimental Protocols & Data
Key Protocol: Assessing IFN-β-Mediated Translation Suppression
This protocol outlines a method to quantify the specific suppression of exogenous mRNA translation induced by IFN-β priming [9].
Workflow:
Materials:
- Cell Lines: Baby hamster kidney cells (BHK-21), murine embryo fibroblasts (MEFs), including wild-type and PKR-/- MEFs to confirm PKR-independent effects [9].
- IFN-β: Recombinant protein.
- Reporter Constructs:
- Key Assays: Luciferase assay system, metabolic labeling reagents (e.g., S35-methionine), antibodies for phospho-STAT1 and ISG15.
Expected Outcome: Cells pre-treated with IFN-β will show a significant reduction in luciferase activity from the exogenous viral or mRNA reporter compared to vehicle-treated controls. The translation of the host mRNA mimic should be relatively unaffected. This suppression will be evident in both wild-type and PKR-/- MEFs [9].
Quantitative Data on Innate Immune Activation by mRNA
The following table summarizes data on how different mRNA and carrier properties influence cell viability, transfection efficiency, and immune activation, key parameters for troubleshooting [11].
Table 1: Impact of mRNA Transfection Parameters on Cell Health and Immune Activation
| Parameter | Condition | Impact on Viability | Impact on Transfection Efficiency | Impact on IFN-β Production |
|---|---|---|---|---|
| Nucleotide Modification | Unmodified mRNA | Lower at high doses | Lower due to immune suppression | High |
| Pseudouridine/5-methyl-cytidine | Higher at high doses | Higher due to reduced immune recognition | Significantly Reduced | |
| mRNA Dose | Low (e.g., 62.5 ng/well) | High | Low to Moderate | Low |
| High (e.g., 500 ng/well) | Significantly Lower | Can be high, but protein yield may be low due to suppression | High | |
| Carrier System | Liposomal (e.g., LipoMM) | Higher viability in monocytes | High | Moderate (depends on mRNA) |
| Polymer-based (e.g., ViroR) | Lower viability in monocytes | Lower | Variable |
Signaling Pathway Visualization
The diagram below illustrates the key steps from IFN-β receptor binding to the suppression of cap-dependent translation.
IFN-β Translation Suppression Pathway
The Scientist's Toolkit: Research Reagent Solutions
Table 2: Essential Reagents for Investigating IFN-β Signaling in mRNA Transfection
| Reagent | Function/Application | Key Note |
|---|---|---|
| Pseudouridine (& 5-methyl-cytidine) | Modified nucleotides for IVT mRNA | Reduces innate immune recognition via TLRs and RLRs, lowering IFN-β production [10] [11]. |
| Liposomal Transfection Reagents (e.g., LipoMM) | mRNA delivery carrier | Can provide high gene transfer rates with only moderate immune cell activation, making them preferable for sensitive primary cells [11]. |
| Recombinant IFN-β Protein | Positive control for pathway activation | Used to prime cells and establish the maximal translational suppression phenotype for control experiments [9]. |
| Anti-IFNAR Antibody | IFN-α/β receptor blockade | Used to inhibit the IFN-β signaling pathway, helping to confirm its role in observed translational suppression [10]. |
| PKR-/- MEFs | Knockout cell line | Critical for demonstrating that observed translation inhibition is independent of the PKR/eIF2α pathway [9]. |
| ISG Reporter Cell Line | Reporter assay | Cell line with an ISRE-driven luciferase or GFP reporter to conveniently monitor IFN pathway activation in real-time. |
| Antibodies: p-STAT1, ISG15, OAS1 | Immunoassays & Western Blot | Essential readouts for confirming the activation of the JAK-STAT pathway and downstream ISG expression [14]. |
Frequently Asked Questions (FAQs)
Q1: What are the key cell types responding to mRNA-LNP vaccination at the injection site? A comprehensive single-cell transcriptome atlas of the mRNA vaccine injection site in mouse models identified 22 different cell types in muscle tissue. The major responding populations include T cells, B cells, dendritic cells (DCs), neutrophils, monocytes, endothelial cells, and fibroblasts [14]. Following immunization, substantial shifts occur in the cellular landscape, with prominent increases in CD8 T cell, neutrophil, and monocyte populations observed 16 hours after injection [14].
Q2: Which cells are primarily targeted by and enriched with the delivered mRNA? Analysis of spike mRNA content at the injection site revealed that stromal cells, particularly fibroblasts, endothelial cells, and pericytes, are highly enriched with the delivered mRNA, alongside some myeloid cells. Lymphoid cells and other structural cells contained relatively lower amounts of the mRNA transcripts [14].
Q3: What are the two major axes of transcriptional responses, and how do they differ? The early innate immune responses can be categorized into two major axes identified through principal component analysis (PCA) [14]:
- PC1 (Stromal Inflammatory Response): This axis represents strong inflammatory responses (e.g., Il6, Tnf, Ccl2 induction) in stromal cells like fibroblasts and endothelial cells. It is primarily driven by the LNP component of the vaccine and is observed in both empty-LNP and mRNA-LNP injected samples.
- PC2 (Type I Interferon Response): This axis features antiviral and type I interferon response genes (e.g., Isg15, Oasl1, Ifit3) in migratory Dendritic Cells (mDCs). It is highly specific to the mRNA component of the vaccine.
Q4: What is the role of fibroblasts in the immune response to mRNA vaccines? Injection site fibroblasts are not only highly enriched with the delivered mRNA but also specifically express IFN-β in response to the mRNA component [14]. This mRNA-elicited IFN-β signaling is crucial, as it induces a distinct population of migratory Dendritic Cells highly expressing IFN-stimulated genes (mDC_ISGs). Blocking IFN-β signaling at the injection site significantly decreases mRNA vaccine-induced cellular immune responses [14].
Q5: How does the LNP component contribute to the overall immunogenicity? The ionizable LNP component provides strong adjuvanticity by triggering pro-inflammatory responses. It is crucial for the induction of inflammatory cytokines like IL-6, which is required for efficient T-cell and B-cell reactions [15] [14]. LNP-induced responses dominate the initial stromal pro-inflammatory axis at the injection site [14].
Troubleshooting Guides
Issue 1: High Background Inflammation in Injection Site Samples
| Possible Cause | Solution | Related Cell Types/Phenomena |
|---|---|---|
| Strong LNP-induced stromal response. | Include an empty LNP (without mRNA) control to distinguish LNP-driven inflammation from mRNA-specific effects [14]. | Fibroblasts, Endothelial cells, Monocytes. |
| Tissue damage from sample processing. | Optimize mechanical and chemical digestion protocols for single-cell suspension preparation to preserve cell viability [14]. | All cell types. |
Issue 2: Undetectable or Low Type I Interferon Signature
| Possible Cause | Solution | Related Cell Types/Phenomena |
|---|---|---|
| mRNA component is not efficiently translated or recognized. | Ensure mRNA incorporates nucleoside modifications to modulate immunogenicity while preserving the necessary IFN-β response for cellular immunity [14] [16]. | Migratory Dendritic Cells (mDCs), Fibroblasts. |
| Sampling at an suboptimal time point. | Focus single-cell RNA sequencing analysis on the peak response window at around 16 hours post-injection [14]. | mDCs expressing ISGs (e.g., Isg15, Oasl1). |
Issue 3: Challenges in Modeling Human Lymph Node Responses
| Possible Cause | Solution | Related Cell Types/Phenomena |
|---|---|---|
| Poor translatability from animal models. | Utilize emerging ex vivo human models, such as precision-cut human lymph node slices, which retain physiological architecture and functionality [17]. | Innate Lymphoid Cells (ILCs), Stromal cells, Monocytes/Macrophages. |
| Loss of critical innate or stromal cell populations during sample preparation. | Employ methods that preserve rare but critical cell types, such as full-organ cross-sections instead of fine-needle aspirations, which can miss stromal cells [17]. | Natural Killer (NK) cells, LN Stromal Cells. |
Table 1: Key Cell Populations at the mRNA Vaccine Injection Site (Mouse Model)
| Cell Type | Key Function in Response | Primary Stimulus (mRNA/LNP) | Key Expressed Genes |
|---|---|---|---|
| Fibroblasts | Major target for mRNA delivery; IFN-β production. | mRNA | Ifnb1, Enriched spike mRNA |
| Migratory DCs (mDCs) | Type I Interferon (IFN) response; antigen presentation. | mRNA | Isg15, Oasl1, Ifit3 |
| Monocytes / Macrophages | Pro-inflammatory cytokine production. | LNP | Il6, Tnf, Ccl2 |
| Endothelial Cells | mRNA enrichment; inflammatory chemokine release. | Both (Primarily LNP) | Ccl2 |
| CD8 T Cells | Population expansion post-injection. | LNP | - |
| Neutrophils | Population expansion post-injection. | LNP | - |
Table 2: Key Cell Populations in a Human Lymph Node Model (Ex Vivo) [17]
| Cell Type | Key Function in Adjuvant Response | Activation Mechanism |
|---|---|---|
| Monocytes / Macrophages | Direct initiation of inflammation via TLR4; IL-1β secretion. | Direct (TLR4 agonist) |
| Innate Lymphoid Cells (ILCs) / NK cells | Bridge innate and adaptive immunity via IFN-γ secretion. | Indirect (via cytokines from Mon./Mac.) |
| Lymph Node Stromal Cells | Orchestrate inflammatory cell recruitment (e.g., neutrophils). | Both direct and indirect |
Experimental Protocols
Objective: To profile cellular composition and transcriptional responses at the mRNA-LNP vaccine injection site.
- Vaccination: Administer mRNA vaccine (nucleoside-modified mRNA in LNP encoding antigen of interest) via intramuscular injection to animal models (e.g., female BALB/c mice). Include control groups injected with saline and empty LNP.
- Tissue Collection: At specified time points post-injection (e.g., 2h to 40h), resect the muscle tissue from the injection site.
- Single-Cell Suspension: Mechanically and chemically digest the resected muscle tissues to create a single-cell suspension.
- Library Preparation & Sequencing: Construct single-cell RNA sequencing libraries from the suspension using a platform like 10x Genomics. Sequence the libraries.
- Bioinformatic Analysis:
- Clustering and Annotation: Process the data (e.g., using Seurat) to perform unsupervised clustering and annotate cell types using canonical gene markers.
- Differential Analysis: Conduct differential gene expression and cell composition analysis comparing treatment groups to controls.
- mRNA Tracking: Map sequencing reads to the antigen reference sequence (e.g., spike open reading frame) to identify cells containing the delivered mRNA.
Objective: To create a functionally responsive, architecturally preserved human LN model for studying vaccine component responses.
- Tissue Source: Obtain healthy human LNs from elective surgical procedures.
- Precision Cutting: Using a vibratome or tissue slicer, generate 300-μm-thick, full-organ cross-sections of the LN.
- Ex Vivo Culture: Culture the LN slices in complete media (e.g., RPMI) for the desired duration.
- Stimulation: Perturb the slices with the immune stimulus of interest (e.g., vaccine adjuvant like LMQ/AS01).
- Downstream Analysis:
- Single-Cell RNA-seq: Pool multiple slices per condition, digest into single-cell suspensions, and perform scRNA-seq. To ensure representation of rare populations, numerically dominant T and B cells can be sorted and spiked back in at a controlled ratio (e.g., 1:20) prior to sequencing.
- Multiplexed Imaging: Use techniques like CODEX or Imaging Mass Cytometry to validate findings and retain spatial context.
- Flow Cytometry: Analyze cell populations and protein-level markers.
Signaling Pathways and Workflows
Injection Site Response to mRNA-LNP
Ex Vivo Human LN Response to Adjuvant
The Scientist's Toolkit: Research Reagent Solutions
Table 3: Essential Reagents and Models for Studying mRNA Vaccine Immunology
| Item / Model | Function / Application | Key Utility / Rationale |
|---|---|---|
| Nucleoside-modified mRNA | The therapeutic payload; encodes antigenic protein. | Reduced excessive innate immune activation while maintaining protein expression efficacy [15] [16]. |
| Ionizable Lipid Nanoparticles (LNPs) | Delivery vector for mRNA; provides adjuvanticity. | Essential for cytoplasmic mRNA delivery and for triggering the pro-inflammatory (IL-6) axis required for adaptive immunity [15] [14]. |
| Empty LNPs (no mRNA) | Critical experimental control. | Allows researchers to disentangle immunogenic effects of the mRNA component from the LNP delivery system [14]. |
| Precision-cut human LN slices | Ex vivo model of human lymphoid tissue. | Retains native tissue architecture and functionality, enabling study of human-specific responses in rare cell types like stroma and ILCs [17]. |
| Single-cell RNA sequencing | Profiling cellular heterogeneity and transcriptional responses. | Enables unbiased identification of cell populations, differential gene expression, and tracking of vaccine mRNA fate [14] [17]. |
| IFN-β blocking antibodies | Tool for mechanistic validation. | Used to confirm the causal role of fibroblast-derived IFN-β in driving mDC_ISG phenotypes and cellular immunity [14]. |
FAQs: Understanding the Core Challenge
Q1: What is the "self-adjuvant" effect of mRNA, and why is it a double-edged sword? The self-adjuvant effect refers to the intrinsic ability of in vitro transcribed (IVT) mRNA to stimulate the innate immune system. mRNA vaccines act as Pathogen-Associated Molecular Patterns (PAMPs) and are recognized by various Pattern Recognition Receptors (PRRs) such as Toll-like receptors (TLR3, TLR7, TLR8) and cytosolic sensors (RIG-I, MDA5). This recognition triggers signaling pathways that lead to the production of type I interferons (IFN) and pro-inflammatory cytokines [18] [19]. This is beneficial for vaccine efficacy as it enhances immune responses, acting like a built-in adjuvant [18] [20]. However, this effect is a double-edged sword because the resulting interferon response can activate enzymes like Protein Kinase R (PKR) and Ribonuclease L (RNase L), which inhibit the translation of the mRNA and lead to its degradation, thereby reducing the desired antigen expression [20] [19]. This innate immune activation can also lead to increased cellular toxicity and reactogenicity [21].
Q2: How does the interferon response specifically inhibit translation? The interferon response inhibits translation through two primary mechanisms:
- PKR Activation: Double-stranded RNA (dsRNA) impurities or structures in the IVT mRNA product activate PKR. Activated PKR phosphorylates the eukaryotic translation initiation factor 2 (eIF2α), which halts the initiation of protein synthesis [19].
- RNase L Activation: The 2'-5'-oligoadenylate synthetase (OAS) is also activated by dsRNA. Activated OAS produces oligonucleotides that, in turn, activate RNase L, which degrades cellular RNA, including the delivered mRNA [22] [19]. This process is summarized in the diagram below.
Q3: My primary cells are showing high cytotoxicity upon repeated mRNA transfection. What could be the cause? Repeated transfection of synthetic mRNA can lead to the cumulative activation of innate immune pathways, resulting in sustained interferon and cytokine production that induces cell stress and apoptosis [23]. This is particularly pronounced in sensitive cells like primary neurons and neural precursor cells (NPCs). One study demonstrated that NPCs subjected to daily mRNA transfection began to die after approximately 10 transfection cycles. The research found that cell differentiation status is a critical factor; cells that were more differentiated at the time of the first transfection tolerated repeated transfections significantly better [23].
Troubleshooting Guides
Problem: Low Antigen Expression Due to Innate Immune Sensing
Potential Causes and Solutions:
Cause 1: dsRNA Impurities in IVT mRNA.
- Solution: Implement high-performance liquid chromatography (HPLC) purification to remove dsRNA contaminants. Studies show that HPLC purification significantly enhances protein yield by eliminating immunostimulatory byproducts [24].
Cause 2: Unmodified mRNA triggering strong PRR response.
Cause 3: The delivery system or mRNA dose is overly reactogenic.
- Solution: Co-deliver innate immune inhibitors. As detailed in the experimental protocols section, co-transfecting mRNAs encoding innate inhibiting proteins (IIPs) like MERS-CoV ORF4a or using small molecules like JAK/STAT inhibitors (e.g., ruxolitinib) can suppress the interferon response and rescue protein expression [22] [21].
Problem: High Cell Death in Repeated Transfection Experiments
Potential Causes and Solutions:
Cause 1: Cumulative immune activation from each transfection round.
- Solution: Allow cells to differentiate before starting transfections. A key study found that initiating daily mRNA transfection in neural precursor cells only after a 5-7 day differentiation period drastically reduced cytotoxicity and allowed for sustained viability over 21 days of transfection [23]. The data below shows the clear difference in survival based on the transfection start day.
Cause 2: Cytotoxicity from the transfection reagent itself.
- Solution: Optimize the reagent-to-mRNA ratio and use reagents designed for low toxicity. For sensitive cells, use specialized reagents validated for primary cells and reduce the complex exposure time to 4-6 hours [26] [27]. Ensure cells are healthy and at an optimal confluency (e.g., 70-90%) at the time of transfection [27].
Table 1: Cell Viability in Repeated mRNA Transfection Based on Initiation Timing [23]
| Group | Transfection Start Day (Post-Seeding) | Cell State at First Transfection | Viability After 21 Daily Transfections |
|---|---|---|---|
| Group 1 | Day 1 | Expansion | High lethality after ~10 transfections |
| Group 2 | Day 2 | Expansion | High lethality after ~10 transfections |
| Group 3 | Day 3 | Differentiation Day 1 | High lethality after ~10 transfections |
| Group 4 | Day 4 | Differentiation Day 2 | High lethality after ~10 transfections |
| Group 5 | Day 5 | Differentiation Day 3 | High lethality after ~10 transfections |
| Group 6 | Day 6 | Differentiation Day 4 | High lethality after ~10 transfections |
| Group 7 | Day 7 | Differentiation Day 5 | Appreciable viability |
| Group 8 | Day 9 | Differentiation Day 7 | Appreciable viability |
Experimental Protocols & Data
Protocol 1: Using Innate Inhibiting Proteins (IIPs) to Enhance Expression
This protocol is based on a study that screened a library of IIPs encoded in cis within a self-amplifying RNA (saRNA) vector to enhance protein expression [22].
Methodology:
- Vector Construction: Clone the gene of interest (e.g., firefly luciferase, fLuc) and the IIP (e.g., MERS-CoV ORF4a, PIV-5 V) into a saRNA replicon, separating them with a T2A cleavage site.
- In Vitro Transcription: Synthesize saRNA using an IVT kit.
- Cell Transfection: Transfect the IIP-saRNA constructs into IFN-competent cell lines (e.g., HeLa, MRC5) using a polymeric delivery system like pABOL.
- Expression Analysis: Measure reporter protein expression (e.g., luminescence) 24-48 hours post-transfection.
Key Results: The IIPs MERS-CoV ORF4a and PIV-5 V enhanced protein expression dramatically in IFN-competent cells, with up to ~900-fold and ~800-fold increases in fLuc expression, respectively, compared to saRNA without an IIP [22].
Table 2: Enhancement of Protein Expression by Innate Inhibiting Proteins (IIPs) [22]
| IIP Construct | Pathway Target | Fold-Increase in Protein Expression (vs. control) |
|---|---|---|
| MERS-CoV ORF4a | Binds dsRNA; suppresses PACT triggering of RIG-I/MDA5 | 893x (HeLa), 109x (MRC5) |
| PIV-5 V | Blocks MDA5 and IRF3 signaling | 796x (HeLa), 72x (MRC5) |
| Orf OV20.0L | Binds dsRNA; inhibits PKR | 20-150x (HeLa) |
| BVDV Npro | Blocks IRF3 phosphorylation | 20-150x (HeLa) |
Protocol 2: Modulating Nucleocytoplasmic Transport with RNAx
This protocol uses a discrete mRNA encoding the Cardiovirus leader protein (RNAx) to broadly dampen innate signaling and reduce reactogenicity [21].
Methodology:
- mRNA Formulation: Co-formulate the antigen-encoding saRNA (e.g., for Influenza Hemagglutinin, HA) with the RNAx mRNA in lipid nanoparticles (LNPs). RNAx can be delivered in trans (as a separate mRNA) or in cis (within the same RNA molecule via an IRES).
- In Vivo Administration: Administer the LNP formulation intramuscularly to mouse models.
- Analysis:
- Expression: Monitor antigen expression over time using a reporter like nano-luciferase (nLuc).
- Immunogenicity: Measure antigen-specific antibody titers and T-cell responses.
- Reactogenicity: Quantify serum biomarkers of inflammation and pro-inflammatory cytokines.
Key Findings:
- Enhanced Expression: RNAx delivered in trans enhanced GOI expression from saRNA by 170-fold one day post-injection in mice [21].
- Reduced Cytokines: In human PBMCs, RNAx in trans suppressed 14 out of 15 saRNA-induced cytokines, including IFN-α and IP-10 [21].
- Preserved Immunity: Despite reducing reactogenicity, RNAx maintained or even enhanced the magnitude of antibody and cellular immune responses [21].
The workflow and effects of this strategy are illustrated below.
The Scientist's Toolkit: Research Reagent Solutions
Table 3: Key Reagents for Managing Interferon Response in mRNA Transfection
| Reagent / Material | Function / Application | Example Use-Case |
|---|---|---|
| Nucleoside-Modified mRNA (e.g., Pseudouridine-Ψ) | Reduces immunogenicity by evading PRR recognition; enhances stability and translation. | Standard for non-immunotherapy applications (e.g., protein replacement) to maximize expression [18] [25]. |
| Innate Inhibiting Proteins (IIPs) (e.g., MERS-CoV ORF4a, PIV-5 V) | Encoded in cis or trans with the antigen to suppress specific innate immune pathways (e.g., RIG-I/MDA5). | Boosting protein expression in IFN-competent cells and enhancing immunogenicity in saRNA vaccines [22]. |
| RNAx (Cardiovirus L protein mRNA) | Co-delivered mRNA that modulates nucleocytoplasmic transport to broadly dampen interferon and pro-inflammatory cytokine production. | Reducing systemic reactogenicity of saRNA-LNP vaccines while preserving immunogenicity [21]. |
| JAK/STAT Inhibitors (e.g., Ruxolitinib) | Small molecule inhibitors that block interferon signaling downstream of receptor binding. | Rescuing protein expression in vitro; not typically used for prophylactic vaccines due to systemic effects [22]. |
| HPLC-Purified mRNA | Removes immunostimulatory byproducts of IVT, particularly double-stranded RNA (dsRNA) impurities. | Critical step in mRNA production to minimize unintended immune activation and translation inhibition [24]. |
A primed interferon (IFN) environment is a significant cellular state that can substantially limit the efficiency of repeated mRNA or DNA transfections. This phenomenon presents a major hurdle in research and therapeutic applications, such as in multi-dose mRNA vaccine regimens or sustained protein replacement therapies, where consistent high-level expression of the transfected gene is required. When cells are first exposed to foreign nucleic acids, they mount a potent innate immune response, characterized by the production of type I interferons. This creates a "primed" state that can severely inhibit protein expression from subsequent transfection attempts. Understanding this mechanism is crucial for developing strategies to overcome this challenge and achieve reliable, repeated gene delivery.
The Core Mechanism: How Interferon Priming Creates a Hostile Environment
FAQ: What is "interferon priming" and how does it occur?
Answer: Interferon priming refers to a cellular state where an initial exposure to interferon, or stimuli that trigger interferon production, pre-activates the cell's antiviral defense pathways. This creates a heightened alert状态 that responds more rapidly and powerfully to subsequent encounters with foreign nucleic acids, such as those introduced during transfection.
- Mechanism of Priming: When cells encounter foreign DNA or RNA during the first transfection, they recognize it through various pattern recognition receptors (PRRs). For transfected DNA, the cGAS-STING pathway is a key sensor [28]. For mRNA, sensors include RIG-I, MDA5, and endosomal TLRs [28] [29]. This recognition triggers signaling cascades that lead to the production and secretion of type I interferons (IFN-α/β).
- Establishing the Primed State: These type I interferons bind to the interferon-α/β receptor (IFNAR) on the same cell and neighboring cells in an autocrine and paracrine fashion [29]. This binding activates the JAK-STAT signaling pathway, leading to the transcriptional upregulation of hundreds of Interferon-Stimulated Genes (ISGs) [30]. The proteins encoded by these ISGs establish the antiviral state, creating the "primed" environment.
FAQ: How does this primed state specifically inhibit later transfections?
Answer: The primed state inhibits subsequent transfections through the concerted action of various ISG products that target multiple stages of the gene expression process from incoming nucleic acids.
- mRNA Degradation: ISGs include powerful RNA-degrading enzymes, such as those from the 2'-5'-oligoadenylate synthetase (OAS) family and RNase L, which can directly degrade foreign mRNA before it can be translated [28].
- Translation Inhibition: Proteins from the IFIT (Interferon-Induced Proteins with Tetratricopeptide Repeats) family can directly bind to and inhibit the translation of foreign mRNA, effectively preventing protein production even if the mRNA remains intact [28].
- Epigenetic Repression: The initial innate immune activation can establish an "epigenetic memory" that keeps antiviral genes in a more accessible state, allowing for an even faster and stronger response to subsequent transfections [28].
- Enhanced Sensor Activity: The primed state often involves increased expression of the PRRs themselves (like RIG-I and MDA5), making the cell more sensitive to smaller amounts of foreign nucleic acid in subsequent transfections [28].
The following diagram illustrates this self-reinforcing inhibitory cycle.
Key Experimental Data and Evidence
The inhibitory effect of a primed interferon environment is not just a theoretical concern; it is a well-documented phenomenon with clear quantitative impacts on protein expression. The table below summarizes key findings from foundational research.
Table 1: Quantitative Evidence of Interferon-Mediated Inhibition of Transfection
| Experimental Finding | Quantitative Impact | Experimental System | Citation |
|---|---|---|---|
| Interferon Priming enhances subsequent IFN production | 3 to 10 times more interferon produced in primed cells | Mouse L929 cells induced with Newcastle disease virus | [31] |
| Type I IFN inhibits antigen expression from mRNA | Direct inhibition of protein expression from DOTAP/DOPE complexed mRNA | Mouse model immunized with HIV-1 Gag mRNA | [32] |
| IFNAR signaling attenuates adaptive immune response | Increased antigen-specific CD8+ T cells & antibodies after IFNAR blockade | Murine model of LNP-mRNA vaccination | [29] |
| cGAS-STING & RNA-sensing pathways suppress transgene expression | Significant increase in transfection efficiency after STING/MDA5 knockdown | Mammalian cell transfection model | [28] |
Troubleshooting Guide: Strategies to Overcome Interferon Priming
FAQ: What are the primary strategies to mitigate interferon-mediated inhibition?
Answer: Researchers can employ several strategies, ranging from modulating the transfected nucleic acid itself to using pharmacological inhibitors and optimizing delivery protocols.
Strategy 1: Modifying the mRNA Molecule
- Nucleoside Modification: Use mRNA where uridine is replaced with N1-methylpseudouridine (m1Ψ). This modification helps the mRNA evade recognition by certain PRRs, significantly reducing IFN induction [29] [33].
- Purification: Employ highly purified mRNA to remove double-stranded RNA (dsRNA) contaminants, which are potent inducers of interferon [29].
- Sequence Engineering: Optimize codons and UTRs to enhance translational efficiency and potentially reduce immunogenicity [33].
Strategy 2: Pharmacological and Genetic Inhibition
- IFNAR Blockade: Transiently block the type I interferon receptor using anti-IFNAR monoclonal antibodies. Studies show this can enhance adaptive immune responses to mRNA vaccines by attenuating the innate response [29].
- Kinase Inhibition: Inhibit key signaling kinases in the IFN pathway. For example, Deucravacitinib is a TYK2 inhibitor that can be used to probe the role of this JAK-STAT pathway component [29].
- Genetic Knockdown: As a research tool, knocking down genes like cGAS, STING, or MDA5 can significantly increase transfection efficiency by dismantling the core sensing machinery [28].
Strategy 3: Optimizing Delivery and Dosing
- Lipid Nanoparticle (LNP) Formulation: Use advanced LNP systems that enhance endosomal escape, delivering mRNA more efficiently to the cytosol and potentially reducing prolonged endosomal PRR activation [33].
- Dosing Interval: Optimize the time between repeated transfections. Allowing the interferon response to fully wane before the next dose can improve expression, though the optimal interval is system-dependent.
The workflow for applying these strategies is summarized in the following diagram.
The Scientist's Toolkit: Key Reagents and Protocols
This section provides a curated list of essential reagents and a foundational protocol for investigating interferon priming in your experimental system.
Table 2: Research Reagent Solutions for Studying Interferon Priming
| Reagent / Tool | Function / Mechanism | Example Use Case |
|---|---|---|
| N1-methylpseudouridine (m1Ψ) mRNA | Nucleoside-modified mRNA with reduced immunogenicity; evades PRR recognition. | Generating a "stealth" mRNA control to compare IFN induction and protein yield against unmodified mRNA. |
| Anti-IFNAR1 blocking antibody | Antagonizes the type I interferon receptor (IFNAR), preventing downstream signaling. | Transient in vivo blockade to assess the contribution of IFNAR signaling to transfection inhibition. |
| Deucravacitinib (TYK2 inhibitor) | Small molecule inhibitor of TYK2 kinase, a component of the JAK-STAT pathway. | Pharmacological inhibition to dissect the role of JAK-STAT signaling in the primed environment. |
| siRNA against cGAS, STING, or MDA5 | Genetic knockdown of key nucleic acid sensors to abrogate IFN induction. | Validating the specific PRR pathway responsible for priming in your cell type. |
| Empty LNPs (No mRNA) | Control for delivery vehicle immunogenicity; isolates LNP effects from mRNA effects. | Distinguishing innate immune activation triggered by the LNP from that triggered by the mRNA payload. |
| ELISA Kits for IFN-β & ISGs (e.g., CXCL10) | Quantitative measurement of interferon and ISG protein levels in supernatant or lysates. | Quantifying the magnitude and kinetics of the interferon response post-transfection. |
Core Experimental Protocol: Assessing the Impact of Priming on Repeated Transfection
Objective: To quantify the loss of transfection efficiency in a primed environment and test the efficacy of mitigation strategies.
Materials:
- Cell line of interest (e.g., HEK293, primary fibroblasts)
- First-wave transfection reagent (e.g., LNP formulation, cationic lipid)
- "Trigger" molecule: Immunogenic RNA (e.g., in vitro transcribed RNA) or interferon (e.g., recombinant IFN-β)
- "Reporter" molecule: mRNA encoding a luciferase or GFP reporter
- Inhibitors (optional): e.g., Anti-IFNAR antibody, small molecule inhibitors
- Equipment: Flow cytometer, plate reader, qRT-PCR machine
Method:
- Cell Seeding: Seed cells in multiple wells to achieve 70-80% confluency at the time of transfection.
- Priming Phase (Day 0):
- Test Group: Transfect cells with the "trigger" molecule (immunogenic RNA).
- Control Group: Treat cells with a non-immunogenic control (e.g., buffer or modified mRNA).
- Optional Inhibition Group: Pre-treat cells with your chosen inhibitor (e.g., anti-IFNAR) 1-2 hours before the priming transfection.
- Incubation (24-48 hours): Allow the innate immune response to develop fully.
- Challenge Phase (Day 1 or 2):
- Transfect all groups with the "reporter" mRNA (e.g., GFP or luciferase).
- Ensure the transfection conditions are identical for all groups.
- Analysis (24 hours post-challenge):
- Quantitative Readout 1 (Protein Expression):
- For Luciferase: Lyse cells and measure luminescence. Normalize to total protein content.
- For GFP: Analyze by flow cytometry to determine the percentage of positive cells and mean fluorescence intensity (MFI).
- Quantitative Readout 2 (Verification of Priming):
- Harvest cell supernatant to measure IFN-β secretion by ELISA.
- Harvest cell RNA to analyze ISG (e.g., ISG15, OAS1) mRNA levels by qRT-PCR.
- Quantitative Readout 1 (Protein Expression):
Data Interpretation:
- A significant reduction in reporter protein (luciferase/GFP) in the Test Group compared to the Control Group confirms the inhibitory effect of priming.
- Successful mitigation is demonstrated if the Inhibition Group shows restored reporter expression levels.
- Elevated IFN-β and ISG levels in the Test Group confirm the establishment of the primed state.
Engineering Solutions: Practical Strategies to Evade and Modulate Interferon Signaling
A major barrier to the successful application of therapeutic mRNA, especially in protocols requiring repeated transfections, is the innate immune system's potent interferon (IFN) response. Mammalian cells possess pattern recognition receptors (PRRs), such as Toll-like receptors (TLRs) and RIG-I-like receptors (RLRs), that recognize in vitro transcribed (IVT) mRNA as foreign material, similar to a viral invasion [10]. This recognition triggers a signaling cascade that results in the production of type-I interferons, which subsequently activate a cellular antiviral state. This state includes the upregulation of proteins like protein kinase R (PKR), which acts to shut down global protein translation, thereby severely reducing the yield of the desired therapeutic protein from the transfected mRNA [10]. Nucleoside modifications, primarily pseudouridine (Ψ) and N1-methylpseudouridine (m1Ψ), have been established as a fundamental strategy to evade this immune detection, enabling efficient and repeated mRNA transfection.
Technical Guide: Mechanisms and Experimental Validation
How Nucleoside Modifications Evade Immune Detection
The innate immune system uses specific receptors to detect unmodified exogenous RNA. The incorporation of Ψ and m1Ψ fundamentally alters the mRNA's properties, allowing it to bypass these sensors.
Key Immune Evasion Mechanisms:
- Reduced Immune Receptor Activation: Unmodified synthetic mRNA, particularly sequences rich in uridine, is a potent activator of endosomal TLRs (like TLR7 and TLR8) and cytosolic sensors like RIG-I [34] [35]. Modifications like Ψ and m1Ψ change the spatial structure and chemical signature of the mRNA, reducing its affinity for these PRRs [36] [35].
- Suppression of Interferon Signaling: By avoiding activation of PRRs, modified mRNA prevents the downstream signaling that leads to the production of type-I interferons (IFN-α and IFN-β) [34]. This is critical because IFN signaling is a primary driver of the inflammatory response and the translational shutdown that limits protein yield [10] [37].
- Alteration of RNA Secondary Structure: Modified nucleotides can influence the secondary structure of mRNA (e.g., reducing the formation of immunostimulatory double-stranded RNA regions or hairpins), which are common byproducts of IVT and key triggers for sensors like TLR3 and RIG-I [35].
The following diagram illustrates the core signaling pathway triggered by unmodified mRNA and how nucleoside modifications interfere with this process.
Comparative Efficacy of Nucleoside Modifications
Extensive research has quantified the benefits of using Ψ and m1Ψ over unmodified nucleotides. The table below summarizes the key performance metrics as established in the literature.
Table 1: Quantitative Comparison of Nucleoside Modification Efficacy
| Parameter | Unmodified mRNA | Pseudouridine (Ψ) | N1-methylpseudouridine (m1Ψ) |
|---|---|---|---|
| Innate Immune Activation | High (potent TLR7/8, RIG-I activation) [10] [35] | Reduced [34] [35] | Significantly suppressed; more effective than Ψ [34] [36] |
| Protein Production | Low (inhibited by IFN/PKR) [10] | Improved translational capacity [34] | Significantly enhanced [34] [35] |
| mRNA Stability | Low | Improved [34] | Improved pharmacokinetics and half-life [34] |
| Clinical Adoption | Not suitable for therapeutics | Early foundational studies [34] | Gold standard; used in Pfizer-BioNTech & Moderna COVID-19 vaccines [34] [36] |
Detailed Protocol: Testing Modification Efficacy In Vitro
This protocol is designed for researchers to validate the effect of nucleoside modifications on protein expression and interferon response in their specific experimental systems, such as human fibroblasts [10].
Objective: To compare the transfection efficiency and immunogenicity of unmodified mRNA, Ψ-mRNA, and m1Ψ-mRNA in mammalian cell culture.
Materials:
- Cell Line: BJ fibroblasts or other relevant primary/model cell line [10].
- mRNA Constructs: GFP-encoding mRNA synthesized in vitro with:
- Unmodified UTP
- Ψ-triphosphate
- m1Ψ-triphosphate (All mRNAs should be identically capped and include a poly(A) tail) [36].
- Transfection Reagent: A reagent optimized for mRNA delivery (e.g., lipid nanoparticles or commercial mRNA transfection reagents) [38].
- Key Assays: Flow Cytometry, ELISA for IFN-β [10].
Methodology:
Cell Seeding and Transfection:
- Seed BJ fibroblasts in a 24-well plate to reach 70-80% confluency at the time of transfection.
- Transfect separate wells with equal molar amounts (e.g., 0.5 µg) of unmodified, Ψ-, and m1Ψ-modified GFP mRNA using the optimized transfection reagent. Include a mock-transfected control.
Incubation and Sample Collection:
- Incubate cells for a predetermined period (e.g., 4-24 hours).
- Collect cell culture supernatant for cytokine analysis.
- Harvest cells for protein expression analysis.
Analysis:
- Protein Expression (Flow Cytometry): Analyze the harvested cells using a flow cytometer. Quantify the mean fluorescence intensity (MFI) of GFP, which correlates directly with translational efficiency [10]. Expect a significant increase in MFI for m1Ψ-mRNA compared to the others.
- Immunogenicity (ELISA): Use the collected supernatant to perform an ELISA for human IFN-β. This quantitatively measures the innate immune activation triggered by each mRNA type [10]. Expect a drastic reduction in IFN-β for m1Ψ-mRNA.
Expected Outcome: The experiment should demonstrate that m1Ψ-modified mRNA yields the highest GFP expression while concurrently producing the lowest levels of IFN-β, confirming its dual advantage.
Frequently Asked Questions (FAQs) for Troubleshooting
Q1: I am still detecting a significant interferon response despite using m1Ψ-modified mRNA. What could be the cause?
- A: The interferon response can be multifaceted. Investigate these potential sources:
- Double-Stranded RNA (dsRNA) Impurities: The in vitro transcription (IVT) reaction can generate dsRNA byproducts, which are potent RIG-I and TLR3 agonists. Even with base modifications, these impurities can trigger an immune response. Ensure your mRNA is purified using methods like HPLC or FPLC to remove dsRNA contaminants [35].
- Cell Type-Specific Responses: Different cell types express varying levels and repertoires of PRRs. Plasmacytoid dendritic cells (pDCs), for instance, are exceptionally potent producers of IFN-α and may require a higher threshold of modification for complete evasion [39].
- Delivery Vehicle: The transfection reagent or lipid nanoparticle itself can have immunostimulatory properties. Test your delivery system with a non-immunostimulatory control to isolate the source of the response [16].
Q2: For repeated transfections required in cellular reprogramming, are nucleoside modifications sufficient to prevent cumulative interferon signaling?
- A: While nucleoside modifications are the most effective single intervention, they may not be entirely sufficient for long-term serial transfections. The cumulative exposure to even low-level IFN can be problematic [10]. A multi-pronged strategy is recommended:
- Use m1Ψ-modified mRNA: This is your first and most critical line of defense.
- Combine with IFN-Inhibiting Agents: Consider using supplements like B18R (a vaccinia virus-encoded type-I IFN binding protein) to neutralize secreted IFN, although small molecule inhibitors have shown limited success and potential toxicity in some models [10].
- Optimize Transfection Intervals: Allow the IFN response to subside between transfections by optimizing the timing and frequency of mRNA delivery.
Q3: Are there any known drawbacks or unintended effects of using m1Ψ?
- A: Recent evidence suggests a potential trade-off. While m1Ψ excellently suppresses immunogenicity, it may introduce a low level of translational infidelity. One study reported that m1Ψ can cause ribosomal stalling and +1 ribosomal frameshifting, potentially leading to the production of truncated or alternative protein variants [36]. For most applications, the benefit of high protein yield far outweighs this minor effect, but it is a critical consideration for therapies where exact protein sequence is paramount.
Q4: Beyond Ψ and m1Ψ, what other modifications are being explored?
- A: The field is actively developing new modifications for further refinement. Promising candidates include:
- 5-methylcytidine (m5C): Often used in combination with Ψ to further reduce immune sensing [34] [36].
- 2-thiouridine (s2U): Offers potential for immune modulation [34].
- Novel Cap Modifications: Alterations to the 5' cap structure can enhance stability and translation while reducing recognition by RIG-I, which senses 5'-triphosphates [36].
The Scientist's Toolkit: Key Research Reagents
Table 2: Essential Reagents for mRNA Research Involving Nucleoside Modifications
| Reagent / Material | Function / Description | Key Consideration |
|---|---|---|
| Modified NTPs (Ψ, m1Ψ) | Building blocks for IVT to produce immune-evasive mRNA [34]. | Critical for both research and GMP-grade therapeutic development. |
| T7 RNA Polymerase | Enzyme for in vitro transcription from a DNA template [36]. | Tolerates modified NTPs, essential for high-yield synthesis [35]. |
| mRNA Capping Enzyme | Adds a 5' cap (e.g., Cap 1) to enhance translation and stability [36] [35]. | A proper cap is non-negotiable for high protein expression. |
| Poly(A) Polymerase | Adds a poly(A) tail to the 3' end of mRNA to increase stability [36]. | Tail length can be optimized for desired expression duration. |
| dsRNA Removal Kit | Purification columns to remove immunostimulatory dsRNA impurities from IVT reactions [35]. | A crucial purification step to minimize residual immune activation. |
| mRNA-Specific Transfection Reagent | Lipid-based or polymer-based reagents optimized for mRNA delivery [38]. | More effective for mRNA than standard DNA transfection reagents. |
Double-stranded RNA (dsRNA) is a well-recognized byproduct of in vitro transcription (IVT) that poses significant challenges for the use of synthetic mRNA in research and therapeutic applications [40]. Even trace amounts of dsRNA can suppress protein translation and trigger unwanted innate immune responses, underscoring the critical importance of effective removal strategies [40].
During IVT, phage RNA polymerases like T7 RNA polymerase can generate dsRNA through several mechanisms. These include the production of short abortive RNA fragments during transcription initiation, and the enzyme's obscure RNA-dependent RNA polymerase activity, where short RNAs or the 3' end of full-length transcripts prime complementary RNA synthesis from primary transcripts [41]. A promoter-independent transcription of full-length anti-sense RNA has also been recently reported as a novel mechanism of dsRNA generation [41].
When introduced into cells, dsRNA is sensed as a viral invader, activating multiple defense pathways. Recognition by cytosolic sensors like RIG-I and MDA5, endosomal TLR3, and other pattern recognition receptors triggers signaling cascades that lead to the secretion of type I interferons and proinflammatory cytokines, including interleukin-6 (IL-6) and tumor necrosis factor-α (TNF-α) [41]. Additionally, dsRNA activates enzymes such as protein kinase R (PKR) and oligoadenylate synthetase (OAS), which inhibit protein synthesis and degrade cellular mRNA [41] [42]. This robust immune activation not only reduces translational yield but can also attenuate subsequent adaptive immune responses in vaccine applications [29].
dsRNA Sensing Pathways and Immune Activation
The following diagram illustrates the key cellular pathways that detect dsRNA contaminants and initiate innate immune responses.
dsRNA Purification Methods: Comparative Analysis
Several effective methods exist for removing dsRNA contaminants from IVT mRNA preparations. The table below summarizes the key techniques, their mechanisms, and performance characteristics.
| Method | Mechanism | dsRNA Reduction | mRNA Recovery | Key Advantages | Key Limitations |
|---|---|---|---|---|---|
| Cellulose-Based Purification [41] | Selective binding of dsRNA to cellulose in ethanol-containing buffer | ≥90% removal | ~70-80% | Simple, scalable, cost-effective; uses standard lab techniques | Less effective for dsRNAs <30 bp; requires optimization of ethanol concentration |
| Affinity Chromatography [43] | dsRNA-specific affinity resin selectively binds dsRNA | >100-fold reduction (to ~0.00007% w/w) | High with maintained integrity | Exceptional purity; compatible with standard nucleotides; scalable | Requires specialized resin; method development needed |
| Reverse-Phase HPLC [41] | Ion pair reversed-phase separation | Highly effective | Variable | Excellent purification; well-established | Not easily scalable; requires toxic acetonitrile; expensive equipment |
| RNase III Treatment [40] | Selective enzymatic digestion of dsRNA | Significant reduction | High (with optimized digestion) | Targeted approach; can be combined with other methods | Potential for mRNA degradation if not controlled; requires careful optimization |
Detailed Experimental Protocols
Principle: dsRNA selectively binds to cellulose in ethanol-containing buffer, while single-stranded mRNA remains in the flow-through.
Materials:
- Conventional cellulose powder
- Ethanol-containing chromatography buffer (16% ethanol final concentration)
- Microcentrifuge spin columns
- Nuclease-free water
- IVT mRNA sample
Procedure:
- Column Preparation: Fill spin columns with cellulose powder (approximately 0.14 g per column).
- Equilibration: Wash columns with ethanol-containing chromatography buffer.
- Sample Application: Dilute IVT mRNA in chromatography buffer and apply to the column.
- Binding Incubation: Incubate at room temperature for 10-30 minutes.
- Centrifugation: Collect flow-through fraction containing purified mRNA.
- Wash Step: Wash column with additional chromatography buffer and combine with flow-through.
- Elution (Optional): dsRNA-bound fraction can be eluted with nuclease-free water for analysis.
- Repeat Cycle: For higher purity, perform two consecutive purification cycles.
Critical Parameters:
- Ethanol Concentration: Optimize between 15-17% for different mRNA constructs
- Temperature: Perform at room temperature (higher temperatures reduce dsRNA binding efficiency)
- Incubation Time: 30 minutes provides more complete dsRNA removal than 10 minutes
- dsRNA Size: Effective for dsRNAs ≥30 bp; less effective for shorter species
Principle: dsRNA-specific affinity resin selectively captures dsRNA contaminants while allowing ssRNA to flow through.
Materials:
- dsRNA-specific affinity resin
- Appropriate chromatography column
- Binding and wash buffers (composition typically proprietary)
- Elution buffer (for resin regeneration)
Procedure:
- Column Packing: Pack affinity resin according to manufacturer's specifications.
- Equilibration: Equilibrate with appropriate binding buffer.
- Sample Loading: Apply IVT mRNA sample in binding buffer.
- Collection: Collect flow-through containing purified mRNA.
- Wash: Wash column with additional buffer to recover residual mRNA.
- Elution: Elute bound dsRNA with specific elution buffer for resin regeneration.
- Analysis: Verify dsRNA removal by dot blot with J2 antibody or functional assays.
Performance Characteristics:
- Reduces dsRNA to approximately 0.00007% w/w of total mRNA
- No negative impact on RNA integrity
- Compatible with standard nucleotides (unmodified)
- Purified RNA induces no inflammatory response in immune reporter assays
Troubleshooting Guide: Common dsRNA Removal Challenges
Q1: Despite purification, my mRNA still triggers significant immune responses in cells. What could be wrong?
A: Several factors could contribute to persistent immunogenicity:
- Incomplete dsRNA removal: Verify purification efficiency using dsRNA-specific detection methods like J2 antibody dot blot [41]. Consider combining multiple purification methods (e.g., cellulose followed by affinity purification).
- Short dsRNA contaminants: Standard cellulose purification may not effectively remove dsRNAs shorter than 30 bp [41]. For these, affinity chromatography or optimized RNase III digestion may be more effective.
- Other immune triggers: Ensure mRNA is properly capped and contains minimal DNA template contaminants. Consider incorporating nucleoside modifications (pseudouridine or N¹-methylpseudouridine) alongside purification [40].
- Cell-type specific responses: Some cell types (e.g., macrophages, dendritic cells) are exquisitely sensitive to nucleic acids. Test purified mRNA in reporter assays measuring IFN production [11].
Q2: I'm experiencing low mRNA recovery rates after cellulose purification. How can I improve yield?
A: To optimize recovery:
- Ethanol concentration: Precisely optimize ethanol concentration (typically 15-17%) as small variations significantly impact binding specificity [41].
- Column capacity: Do not exceed cellulose binding capacity (approximately 10 μg dsRNA per 0.14 g cellulose) [41].
- Temperature control: Perform purification at room temperature, as higher temperatures (45°C or 65°C) reduce dsRNA binding efficiency and specificity [41].
- Buffer composition: Ensure proper pH and ionic strength in chromatography buffer.
- Multiple cycles: Instead of a single prolonged incubation, use two shorter cycles (10-15 minutes each) for better recovery [41].
Q3: How do I validate successful dsRNA removal from my mRNA preparations?
A: Employ these validation methods:
- J2 antibody dot blot: The gold standard for detecting dsRNA contaminants ≥40 bp [41]. Provides semi-quantitative assessment of dsRNA content.
- Functional immune assays: Measure IFN-α/β production in primary immune cells or reporter cell lines after transfection with purified mRNA [41] [11].
- Translation efficiency: Compare protein expression levels from purified vs. unpurified mRNA in susceptible cell lines [41].
- Electrophoretic analysis: Use native PAGE to detect dsRNA species, particularly shorter contaminants (<30 bp) that may be missed by cellulose purification [41].
Q4: Should I use nucleoside modifications instead of dsRNA purification?
A: These approaches are complementary, not mutually exclusive:
- Nucleoside modifications (pseudouridine, N¹-methylpseudouridine) can reduce innate immune recognition but vary in effectiveness across cell types and may decrease translation efficiency in some contexts [44].
- dsRNA purification addresses a specific contaminant regardless of nucleoside composition.
- Combined approach: The most effective strategy combines nucleoside modifications with thorough dsRNA removal [40]. This approach produces high-quality, low-immunogenicity mRNA suitable for sensitive therapeutic applications.
Q5: How does dsRNA contamination affect repeated mRNA transfections in research?
A: dsRNA contamination poses particular challenges for repeated transfections:
- Priming effects: Initial exposure to dsRNA can prime cells for heightened immune responses to subsequent transfections, amplifying interferon and cytokine production [29].
- Translation shutdown: PKR activation from initial dsRNA exposure can inhibit protein synthesis in subsequent transfections, reducing experimental outcomes [42].
- Cellular toxicity: Repeated immune activation can lead to increased cell death or phenotypic changes that confound experimental results [11].
- Solution: Implement rigorous dsRNA removal and consider combining purification with nucleotide modifications to enable sustained gene expression in multi-transfection protocols [40].
Research Reagent Solutions
The following table outlines essential reagents and materials for effective dsRNA removal.
| Reagent/Material | Function/Application | Key Characteristics |
|---|---|---|
| Cellulose Powder [41] | Selective dsRNA binding in ethanol-containing buffer | Standard laboratory grade; cost-effective; scalable from μg to mg mRNA amounts |
| dsRNA-Specific Affinity Resin [43] | Selective dsRNA capture in affinity chromatography | High specificity; enables exceptional purity (<0.00007% dsRNA) |
| RNase III Enzyme [40] | Selective digestion of dsRNA contaminants | Requires careful titration to avoid mRNA degradation; can be combined with other methods |
| J2 Anti-dsRNA Antibody [41] | Detection and quantification of dsRNA contaminants | Specific for dsRNAs ≥40 bp; used in dot blot or ELISA formats |
| Modified Nucleotides [40] [44] | Reduce innate immune recognition when incorporated into IVT mRNA | Pseudouridine, N¹-methylpseudouridine; often used in combination with purification |
| Ionizable Lipids for LNP Formulation [29] | mRNA delivery with reduced immunogenicity | ALC-0315 commonly used; affects innate immune activation potential |
Effective dsRNA removal is essential for maximizing translational yield and minimizing unwanted immunogenicity in mRNA applications. The optimal purification strategy depends on specific research needs, balancing purity requirements with practical considerations of cost, scalability, and technical complexity.
For most research applications, cellulose-based purification offers an excellent balance of effectiveness, simplicity, and cost-efficiency [41]. For therapeutic applications or particularly sensitive experiments, affinity chromatography provides superior purity [43]. Combining rigorous dsRNA removal with nucleoside modifications represents the current gold standard for producing high-quality, low-immunogenicity mRNA suitable for even the most sensitive applications, including repeated transfections and in vivo use [40].
Regular validation of dsRNA removal through appropriate detection methods and functional assays ensures consistent results and reliable experimental outcomes. As mRNA technologies continue to evolve, ongoing optimization of purification processes remains crucial for advancing both basic research and therapeutic applications.
Core Concepts and Challenges
What is the fundamental challenge in balancing high translation and low immunogenicity?
The primary challenge lies in the fact that exogenous mRNA faces a dual recognition system in host cells. While the goal is to achieve efficient protein expression, the mRNA molecule itself is scrutinized by the cell's innate immune sensors. Pathogen recognition receptors (PRRs), such as RIG-I and TLR7, can detect foreign RNA features, triggering a Type I Interferon (IFN) response [45] [46]. This response, while potentially providing an adjuvant effect for vaccines, can also inhibit mRNA translation and lead to unwanted cellular toxicity, thereby reducing the overall efficacy of the mRNA therapeutic, especially in repeated administration or non-vaccine applications [45] [14].
Why does codon optimization impact Interferon induction?
Codon optimization influences the nucleotide sequence of the mRNA without changing the encoded amino acid sequence. Certain dinucleotide motifs (e.g., CpG or UpA) are over-represented in pathogen genomes and can be potent triggers of innate immune sensors [46]. Furthermore, the choice of synonymous codons can affect the secondary structure of the mRNA (often approximated by Minimum Free Energy, or MFE), which in turn influences its stability, accessibility to ribosomes, and visibility to cytoplasmic RNA sensors [47]. Therefore, an optimization strategy that considers only translation efficiency might inadvertently create sequences rich in immunostimulatory motifs.
Design and Optimization Strategies
What are the limitations of traditional codon optimization methods?
Traditional methods, such as those based solely on the Codon Adaptation Index (CAI), aim to mimic the codon usage of highly expressed endogenous genes [47]. However, these approaches have significant limitations:
- They rely on predefined sequence features (like CAI or GC-content) that often fail to correlate strongly with experimentally measured protein expression levels [47].
- They explore a limited sequence space due to computational constraints and predefined rules, potentially missing highly efficient and non-immunogenic sequences [47].
- They generally do not account for the cellular context, such as the availability of specific translational machinery or RNA-binding proteins in different tissues [47].
How do next-generation, data-driven approaches overcome these limitations?
Advanced computational frameworks, such as RiboDecode, represent a paradigm shift by using deep learning to directly learn the complex relationship between mRNA sequence features and their functional outputs [47]. These models are trained on large-scale experimental data, particularly Ribo-seq data, which provides a genome-wide snapshot of actively translating ribosomes [47]. This allows for:
- Direct learning from translational output: The model learns sequence features that directly correlate with high protein expression, moving beyond simplistic proxies like CAI [47].
- Exploration of a vast sequence space: Generative AI can explore a much wider array of possible codon sequences to find global optima, not just local improvements [47].
- Context-aware optimization: Models can incorporate additional inputs like mRNA abundance and cell-type-specific gene expression profiles to tailor mRNA design for a specific therapeutic context (e.g., different tissues or delivery formats) [47].
- Multi-objective optimization: These tools can jointly optimize for both high translation efficiency (via the translation prediction model) and high mRNA stability (via an MFE prediction model), allowing researchers to balance these competing demands effectively [47].
Detection and Validation
How do I detect and measure an Interferon response in my experiment?
It is crucial to include proper controls and assays to monitor unintended IFN activation. The table below summarizes key experimental readouts.
Table 1: Key Assays for Detecting Interferon Response to Transfected mRNA
| Assay Type | Target / Readout | Key Indicators of IFN Response |
|---|---|---|
| Gene Expression Analysis (qRT-PCR) | mRNA levels of IFN-stimulated genes (ISGs) and cytokines | Upregulation of ISG15, OAS1, IFIT1, IFIT3, CXCL9, CXCL10 [14] [48]. |
| Protein Analysis (ELISA/MSD) | Secreted IFN-β and other cytokines | Detection of IFN-β protein in cell culture supernatant [14]. |
| Immunofluorescence/ Western Blot | Protein levels of ISGs and signaling molecules | Increased ISG15 protein levels; phosphorylation of STAT1 [49]. |
| Single-Cell RNA-Seq | Transcriptomic landscape | Identification of cell-type-specific IFN responses and emergence of unique cell clusters (e.g., mDC_ISGs) characterized by high ISG expression [14]. |
What are the essential controls for a robust experiment?
Including a comprehensive set of controls is non-negotiable for interpreting IFN response data accurately [50].
Table 2: Essential Experimental Controls for mRNA Transfection Studies
| Control Type | Purpose | Examples |
|---|---|---|
| Positive Control (for IFN response) | To confirm the experimental system can detect a known IFN inducer. | Transfect with a known immunostimulatory RNA (e.g., non-modified RNA). |
| Negative Control (non-targeting RNA) | To establish the baseline level of non-specific effects and IFN induction from the delivery process. | A scrambled sequence or non-targeting siRNA/ASO with the same chemical modifications as your experimental RNA [50] [51]. |
| Untransfected Control | To measure normal gene expression and phenotype without any transfection reagent or RNA. | Cells-only sample [50]. |
| Delivery Vehicle Control | To isolate effects caused by the delivery vehicle (e.g., LNP) from those of the mRNA. | Empty LNP or transfection reagent complexed with a blank vector [14]. |
| Fluorescent Transfection Control | To monitor and calculate transfection efficiency. | BLOCK-iT Fluorescent Oligo; uptake by >80% of cells correlates with high efficiency [50]. |
Troubleshooting Guides and FAQs
I've confirmed a strong IFN response to my optimized mRNA. What can I do?
A confirmed IFN response requires a systematic troubleshooting approach. Follow the logic below to identify and address the most likely causes.
My mRNA shows excellent in vitro expression but fails in vivo. Why?
This common issue often stems from differences between simplified cell culture models and the complex in vivo environment.
- Biodistribution and Delivery: Most standard LNPs exhibit strong hepatic tropism (accumulation in the liver). If your target is an extrahepatic organ (e.g., lung, heart, brain), the mRNA may not be efficiently delivered to the correct cells [52].
- Solution: Investigate next-generation delivery systems designed for extrahepatic targeting, such as pKa-tuned LNPs, polymeric carriers, or peptide-based vesicles [52].
- Enhanced Immune Recognition In Vivo: The in vivo immune system is more complete. Fibroblasts at the injection site have been identified as key cells that take up mRNA and produce IFN-β [14]. This robust, localized innate response can limit protein expression before a systemic effect is achieved.
- Solution: Consider the use of IFN-modulating agents or further optimization of the mRNA sequence and delivery vehicle to evade recognition by specific cell types in the target tissue.
The protein expression from my mRNA is low, and I see no IFN response. What is wrong?
If an IFN response is absent and expression is low, the problem is likely related to mRNA integrity or delivery efficiency, not immunogenicity.
- Potential Cause 1: Poor mRNA Quality or Integrity. The mRNA itself might be degraded or improperly synthesized.
- Troubleshooting: Check the integrity of the mRNA by running a sample on a denaturing gel. Smearing indicates degradation. Ensure stringent RNase-free techniques during all steps: wear gloves, use RNase-free reagents and tips, and decontaminate work surfaces [50].
- Potential Cause 2: Low Transfection/Delivery Efficiency. The mRNA is not efficiently entering the cells.
- Troubleshooting: Always include a fluorescent control oligo (e.g., BLOCK-iT Fluorescent Oligo) to visually confirm cellular uptake under a fluorescence microscope [50]. For in vivo studies, verify that the LNPs are accumulating in the target tissue.
- Potential Cause 3: Suboptimal Codon Optimization. The sequence may be over-optimized for a single parameter, leading to unforeseen issues like rare tRNA bottlenecks or detrimental secondary structures that were not predicted by the algorithm.
- Troubleshooting: Try a different optimization algorithm, preferably one that is data-driven and context-aware like RiboDecode [47].
Advanced Experimental Protocols
Protocol: Evaluating IFN Response to mRNA Transfection In Vitro
This protocol provides a detailed methodology for assessing the innate immune response to transfected mRNA in cell culture, based on approaches used in recent literature [14].
Key Research Reagent Solutions:
- Lipid Nanoparticles (LNPs): For in vivo-mimicking delivery; consist of ionizable lipid, phospholipid, cholesterol, and PEG-lipid [14] [53].
- DMXAA: A murine STING agonist, used as a positive control for IFN induction [48].
- BLOCK-iT Fluorescent Oligo: A transfection efficiency control [50].
- Silencer Select Negative Control siRNAs: A non-targeting RNA negative control [50].
Methodology:
- Cell Seeding: Plate appropriate cells (e.g., primary macrophages, dendritic cells, or your target cell line) in multi-well plates.
- mRNA Transfection:
- Experimental Group: mRNA-LNP of interest.
- Critical Control Groups: Include empty LNP, a non-targeting RNA-LNP, and an untreated control.
- Positive Control Group: Transfert with a known immunostimulatory RNA or treat with DMXAA.
- Transfection Efficiency Control: Include a well transfected with a fluorescent oligo.
- Complex formation between transfection agents and mRNA should be performed in serum-free medium. Follow manufacturer's instructions for serum compatibility during the transfection itself [50].
- Sample Collection (Time-Course):
- Early Time Points (2-8 hours): Collect cell culture supernatant for * cytokine analysis (ELISA for IFN-β)* and cell pellets for early gene expression analysis.
- Late Time Points (8-24 hours): Collect cell pellets for transcriptomic analysis (RNA-seq or qPCR for ISGs). The IFN signature often peaks around 16 hours post-transfection [14].
- Analysis:
- qPCR Panel: Analyze expression of Ifnb1, Isg15, Oasl1, Cxcl10.
- Protein Measurement: Quantify IFN-β in supernatant via ELISA.
- Data Interpretation: Compare the experimental group to all controls. A specific mRNA-induced response will be显著 higher than the empty LNP and non-targeting RNA controls.
Protocol: In Vivo Assessment of mRNA Performance and Immunogenicity
This protocol outlines key steps for evaluating optimized mRNA constructs in animal models, reflecting methods that demonstrated success in recent studies [47].
Methodology:
- mRNA Formulation: Encapsulate the optimized and control mRNAs in LNPs. The LNP composition itself can be tuned for reduced immunogenicity or targeted delivery [52] [53].
- Animal Immunization/Administration:
- Administer mRNA via the intended route (e.g., intramuscular injection).
- Include groups for different mRNA doses to establish a dose-response relationship. Using the lowest effective dose can minimize potential off-target and cytotoxic effects [50].
- Sample Collection and Analysis:
- Injection Site Analysis (2-40 hours post-injection): Resect tissue for single-cell RNA sequencing or immunohistochemistry to characterize local cellular responses and identify which cells are producing IFN [14].
- Draining Lymph Node Analysis: Profile immune cell activation and antigen presentation.
- Functional Readouts (Weeks later): For vaccines, measure antigen-specific neutralizing antibodies (e.g., by PRNT assay) and T-cell responses (e.g., by IFN-γ ELISpot assay) [47] [14]. For protein replacement therapies, measure the specific protein levels and functional activity in the target organs.
The Scientist's Toolkit
Table 3: Key Research Reagent Solutions for mRNA Design and IFN Research
| Item / Reagent | Function / Application | Considerations |
|---|---|---|
| RiboDecode [47] | A deep learning framework for mRNA codon optimization that enhances translation and can consider cellular context. | Outperforms traditional rule-based methods (CAI). Demonstrated robust performance in vivo across different mRNA formats. |
| Advanced LNPs (e.g., AMG1541) [53] | Next-generation lipid nanoparticles for enhanced mRNA delivery efficiency. | Can achieve same immune response at ~1/100 the dose of standard LNPs, potentially reducing IFN-related side effects. |
| Ionizable Lipids | Key component of LNPs that enables endosomal escape and affects immunogenicity. | New designs with cyclic structures and esters can improve biodegradability and reduce toxicity [53]. |
| Nucleoside Modifications (e.g., m1Ψ) | Incorporated into mRNA to reduce innate immune recognition. | Can help dampen the IFN response, though context-dependent effects are possible [47] [14]. |
| BLOCK-iT Fluorescent Oligo [50] | A positive control to calculate and monitor transfection efficiency. | Uptake by >80% of cells correlates with high efficiency. Essential for troubleshooting delivery problems. |
| SP140/RESIST Pathway Reagents [48] | Tools to study a newly identified pathway that regulates Ifnb1 mRNA stability. | SP140 negatively regulates IFN-β by repressing RESIST, which stabilizes Ifnb1 mRNA. A potential target for immunomodulation. |
FAQs and Troubleshooting Guides
Frequently Asked Questions (FAQs)
1. What is the primary function of ionizable lipids in LNPs? Ionizable lipids are the cornerstone of functional Lipid Nanoparticles (LNPs). They are neutral at physiological pH (around 7.4) but become positively charged in the acidic environment of the endosome (after cellular uptake). This unique property serves three critical functions: (1) It allows for efficient encapsulation of negatively charged mRNA during the manufacturing process at low pH; (2) It facilitates the escape of the mRNA from the endosome into the cell cytoplasm by destabilizing the endosomal membrane; and (3) It reduces overall nanoparticle toxicity compared to permanently cationic lipids by remaining neutral in the bloodstream [54].
2. Why do my mRNA-LNP transfections trigger a strong interferon response, and how can I mitigate it? An interferon response can be triggered by both the mRNA payload and the LNP delivery system itself. The ionizable lipid component of LNPs has been identified as a key activator of innate immune signaling, specifically through the Toll-like Receptor 4 (TLR4) pathway, leading to the activation of transcription factors like NF-κB and IRF which drive interferon and cytokine production [55]. To mitigate this:
- Consider Nucleoside Modifications: Use mRNA where uridine is replaced with modified nucleosides like N1-methylpseudouridine (m1Ψ). This can reduce recognition by cellular RNA sensors [56].
- Optimize LNP Composition: The choice of ionizable lipid significantly impacts immune activation. Screen different ionizable lipids, as some formulations (e.g., those with OF-02) may induce a stronger antiviral signature than others (e.g., cKK-E10) [56].
- Purify mRNA: Ensure your mRNA preparation has minimal double-stranded RNA (dsRNA) impurities, which are potent inducers of interferon pathways [55] [56].
3. How does LNP composition influence organ-selective mRNA delivery? The structure of the ionizable lipid is a major determinant of organ selectivity. By chemically engineering the ionizable head group, linker, and hydrophobic tail, researchers can create LNPs that preferentially deliver mRNA to specific organs such as the liver, spleen, or lungs [57]. For instance, ionizable lipids with specific structural elements can facilitate mRNA delivery to muscle and immune cells, or enable targeting to the lungs via mucosal administration [57]. The administration route (e.g., intravenous, intramuscular, intranasal) also works in concert with the LNP composition to determine final biodistribution [57].
4. My LNP formulations show low protein expression. What factors should I investigate? Low protein expression can result from several factors related to the mRNA and the LNP:
- Check mRNA Integrity and Purity: Ensure the mRNA is not degraded and has low levels of dsRNA contaminants.
- Evaluate Ionizable Lipid Performance: The efficiency of endosomal escape is highly dependent on the ionizable lipid. A poor-performing lipid will trap mRNA in the endosome, preventing translation. Screen alternative ionizable lipids known for high delivery efficiency [57].
- Assess Global Translational Repression: Transfection with mRNA-LNPs can sometimes trigger a global shutdown of cellular translation. Using modified nucleosides (m1Ψ) can help alleviate this repression compared to unmodified mRNA (UNR) [56].
- Verify LNP Characteristics: Ensure your LNPs have a size typically between 50-200 nm and a high encapsulation efficiency (>90%) to protect the mRNA and facilitate cellular uptake [54].
Troubleshooting Common Experimental Issues
Issue 1: High Innate Immune Activation and Reactogenicity in In Vivo Models
- Potential Cause: The ionizable lipid in your LNP formulation is a potent activator of the TLR4 pathway [55].
- Solution:
- Re-formulate with Low-Immunogenicity Lipids: Switch to ionizable lipids specifically designed or screened for lower immunostimulatory profiles. For example, some novel lipids identified via combinatorial chemistry (e.g., Ugi-4CR) show promising efficacy with reduced side effects [57].
- Employ Modified Nucleosides: Consistently use m1Ψ-modified mRNA to minimize immune activation from the RNA payload itself [56].
- Characterize the Pathway: Confirm the mechanism using knockout cell lines (e.g., TLR4 knockout) or inhibitory compounds to verify TLR4 involvement [55].
Issue 2: Inconsistent or Poor In Vivo Efficacy Across Different Administration Routes
- Potential Cause: The LNP formulation is not optimized for the specific administration route (e.g., intramuscular vs. intranasal).
- Solution:
- Select Route-Specific Lipids: Develop or source ionizable lipids tailored for your target route. For example, the ionizable lipid R2U2 has demonstrated efficacy in eliciting both systemic and mucosal immunity when administered via intramuscular, intranasal, or intratracheal routes [57].
- Re-optimize Formulation Ratios: The optimal molar ratios of ionizable lipid, phospholipid, cholesterol, and PEG-lipid may differ for each route and target tissue. Perform a new Design of Experiments (DoE) for the new route.
Issue 3: Low Encapsulation Efficiency or Unstable LNPs
- Potential Cause: Suboptimal formulation method or incorrect lipid composition.
- Solution:
- Adopt Microfluidics: Use microfluidic mixing for LNP preparation instead of manual methods like thin-film hydration or pipette mixing. Microfluidics offers superior control over mixing, leading to highly reproducible, monodisperse nanoparticles with encapsulation efficiency often exceeding 90% [54].
- Adjust Lipid Ratios: Ensure the ionizable lipid is present at a sufficient molar percentage (typically around 50%) for effective RNA complexation. Optimize the percentage of PEG-lipid (e.g., 1.5-3%) to control particle size and stability without hindering cellular uptake [54] [57].
Table 1: Impact of mRNA Modification and Ionizable Lipid on Protein Expression and Immune Response
| mRNA Type | Ionizable Lipid | Protein Expression (Relative to UNR) | Global Translation Repression | Antiviral Gene Signature | Key Findings |
|---|---|---|---|---|---|
| Unmodified (UNR) | OF-02 / cKK-E10 | Lower | Higher (~58% at low dose) | Stronger (OF-02, early time point) | Potent innate immune activation [56] |
| m1Ψ-Modified (MNR) | OF-02 / cKK-E10 | Higher | Lower (40-46% higher than UNR) | Weaker | Enhanced translation, reduced immunogenicity [56] |
| UNR / MNR | SM-102 | Cell-type dependent | Not Specified | Delayed (peaked at 24h) | Delivery efficiency varies by cell type [56] |
| Empty LNP | ALC-0315 (BNT162b2) | N/A | N/A | Activated NF-κB & IRF | Innate activation is mRNA-independent, mediated via TLR4 [55] |
Table 2: Performance of Select Ugi-4CR Ionizable Lipids for Vaccine Development
| Ionizable Lipid (Structure) | Hydrophobic Tail | In Vivo Model | Administration Route | Key Immune Outcomes |
|---|---|---|---|---|
| R2U2 | (9Z,12Z)-9,12-octadecadienoic (U2) | Mice & Cynomolgus Macaques | I.M., I.N., I.T. | Elicited robust humoral/cellular immunity; stimulated mucosal immunity via I.N./I.T. [57] |
| Benchmark (ALC-0315) | Not Specified | Mice | I.M. | Standard for comparison; R2U2 performed comparably or better [57] |
| DLin-MC3-DMA | Not Specified | (Reference) | I.V. | Historical benchmark; newer Ugi-4CR lipids showed higher delivery efficiency [57] |
Detailed Experimental Protocols
Protocol 1: Assessing Innate Immune Activation by LNPs Using Reporter Cell Lines
Objective: To quantify the activation of NF-κB and IRF pathways induced by empty or mRNA-loaded LNPs.
Materials:
- THP-1 monocyte cell line engineered with NF-κB (e.g., alkaline phosphatase) and IRF (e.g., luciferase) reporters.
- Test LNP formulations (empty and mRNA-loaded).
- Positive controls: R848 (TLR7/8 agonist), MPLA (TLR4 agonist).
- Cell culture plates and media.
Method:
- Cell Seeding: Seed THP-1 reporter cells in a multi-well plate.
- Stimulation: Treat cells with a dose range of your test LNPs and positive controls. Include an unstimulated control.
- Incubation: Incubate cells for 24-120 hours, as immune activation from LNPs can peak later than classic TLR agonists [55].
- Reporter Assay: At designated time points (e.g., 24, 48, 72h), measure reporter signals (alkaline phosphatase for NF-κB, luciferase for IRF) according to standard protocols.
- Viability Assessment: Perform a parallel cell viability assay (e.g., MTT, CellTiter-Glo) to ensure immune activation is not confounded by cytotoxicity.
Key Analysis: Compare the fold-change in reporter signal relative to the unstimulated control. LNPs with high innate immunogenicity will show strong, dose-dependent NF-κB and/or IRF activation [55].
Protocol 2: Evaluating the Impact of mRNA-LNPs on Global Cellular Translation
Objective: To determine if mRNA-LNP transfection induces global translational shutdown, a key interferon response.
Materials:
- Primary human skeletal myoblasts (HSKM) or other relevant cell type.
- UNR and m1Ψ MNR mRNA-LNPs (e.g., formulated with OF-02, cKK-E10).
- Puromycin.
- Cycloheximide (translation inhibitor).
- SDS-PAGE and Western blot equipment.
- Anti-puromycin antibody.
Method:
- Transfection: Transfect cells with a dose range of UNR and MNR mRNA-LNPs.
- Puromycin Labeling: 20 hours post-transfection, treat cells with puromycin for a short period (e.g., 30 minutes) to label newly synthesized polypeptides.
- Control Setup: Include untreated cells (high translation control) and cells pre-treated with cycloheximide (no translation control).
- Sample Collection: Lyse cells and separate proteins by SDS-PAGE.
- Western Blot: Transfer proteins to a membrane and probe with an anti-puromycin antibody.
- Quantification: Measure total puromycin incorporation to assess the level of active global translation.
Key Analysis: UNR mRNA-LNPs typically cause more severe translational repression. MNR mRNA-LNPs should show higher puromycin incorporation, indicating they are better able to circumvent this antiviral cellular mechanism [56].
Signaling Pathways and Experimental Workflows
Innate Immune Signaling by Ionizable LNPs
Diagram 1: Ionizable LNP Immune Activation Pathway. This diagram illustrates how ionizable lipids in LNPs can activate the innate immune system via the TLR4 pathway, leading to the production of pro-inflammatory cytokines and type I interferons [55].
Screening Ionizable Lipids for Efficacy and Reduced Immunogenicity
Diagram 2: Ionizable Lipid Screening Workflow. A strategic workflow for screening novel ionizable lipids to identify leads with high mRNA delivery efficiency and low undesirable immune activation [56] [57].
The Scientist's Toolkit: Research Reagent Solutions
Table 3: Essential Reagents for LNP and Interferon Response Research
| Reagent / Material | Function / Application | Key Considerations |
|---|---|---|
| Ionizable Lipids (e.g., ALC-0315, SM-102, cKK-E10, OF-02, novel Ugi-4CR lipids) | Key component for mRNA encapsulation, endosomal escape, and determining tropism/immunogenicity. | Screen multiple options; structure affects efficacy, targeting, and immune activation [55] [56] [57]. |
| m1Ψ-Modified mRNA | mRNA payload with reduced immunogenicity and enhanced translational efficiency. | Compared to unmodified uridine (UNR), it can lessen innate immune sensing and increase protein yield [56]. |
| THP-1 NF-κB/IRF Reporter Cell Line | In vitro model to quantify innate immune pathway activation by LNPs. | Crucial for dissecting the immunostimulatory role of the LNP itself versus the mRNA [55]. |
| Anti-Puromycin Antibody | Detects puromycin incorporation in Western blot assays to measure global translation. | Essential for evaluating interferon-mediated translational repression in transfected cells [56]. |
| Microfluidic Mixer (e.g., NanoAssemblr) | Enables reproducible, scalable production of monodisperse LNPs with high encapsulation efficiency. | Superior to manual mixing methods for consistent, high-quality LNP batches [54]. |
Core Mechanisms: How PRR Inhibition and Endosomal Escape Enhance mRNA Translation
What are the primary biological barriers that mRNA translation boosters aim to overcome? mRNA therapeutics face two major cellular barriers: the innate immune system's pattern recognition receptors (PRRs) and entrapment within endosomes. PRRs detect exogenous mRNA as a foreign invader, triggering interferon (IFN) release that phosphorylates protein kinase R (PKR). Activated PKR globally suppresses protein translation, drastically reducing therapeutic protein yield [10] [58]. Simultaneously, most internalized mRNA remains trapped in endosomes and is degraded by lysosomes without ever reaching the ribosome-filled cytoplasm for translation [58]. Effective booster strategies must therefore both suppress immune detection and facilitate endosomal escape.
Why is suppressing the interferon response particularly crucial for repeated mRNA transfections? Repeated transfections compound the interferon response problem. Initial mRNA transfection primes the antiviral state through IFN secretion, making cells increasingly resistant to subsequent transfections [10]. This progressively diminishes protein expression in multi-dose regimens essential for sustained protein production. Furthermore, chronic IFN activation can exacerbate pathological burdens and cause cytotoxic effects, undermining therapeutic safety [25] [10].
Quantitative Data: Efficacy of Different Booster Strategies
Table 1: Comparative Analysis of mRNA Translation Booster Approaches
| Strategy Category | Specific Agent/Approach | Reported Efficacy | Key Findings | Limitations/Challenges |
|---|---|---|---|---|
| Nucleotide Modification | N1-methylpseudouridine (m1Ψ) | Standard for approved vaccines | Reduces TLR7/8 activation; significantly improves translation efficiency vs. unmodified mRNA [36] | May cause ribosomal frameshifting, producing off-target proteins [36] |
| Small Molecule PRR Inhibitors | TLR3 inhibitors (Sertraline, Fluphenazine) | Inhibits IFN-β production | Statistically significant IFN-β reduction in human fibroblasts [10] | Did not enhance GFP expression; some showed inhibition despite lower IFN [10] |
| Small Molecule PRR Inhibitors | PKR inhibitors (C16, 7DG) | Inhibits IFN-β production | Efficiently reduced IFN-β production in transfected cells [10] | No enhancement (C16) or inhibition (7DG) of reporter GFP expression observed [10] |
| tRNA Co-Delivery | Chemically modified tRNA (tRNA-plus) | ~4-fold higher decoding efficacy | Boosts protein levels up to 4.7-fold; enhances mRNA stability & translation [59] | Specific to mRNA with cognate codons; requires optimization of tRNA-mRNA pairs [59] |
Experimental Protocols for Validating Booster Efficacy
Protocol 1: Evaluating Interferon Response Suppression
This protocol assesses the efficacy of potential booster compounds in reducing the innate immune response to transfected mRNA.
- Cell Culture: Plate human fibroblasts (e.g., BJ fibroblasts) at 60-80% confluency in standard growth medium [10].
- Treatment Groups: Include cells transfected with (a) unmodified mRNA, (b) nucleoside-modified mRNA (e.g., m1Ψ-modified), and (c) unmodified mRNA co-delivered with the candidate booster compound.
- Transfection: Complex GFP-encoding IVT mRNA with a standard transfection reagent (e.g., lipid nanoparticles or commercial transfection reagents). For booster groups, add the small molecule inhibitor to the culture medium at the time of transfection. A typical treatment duration is 4 hours before replacing with fresh medium, though this requires optimization for toxicity [10].
- IFN-β Quantification: At 24 hours post-transfection, collect cell culture supernatant. Quantify secreted IFN-β levels using a commercial enzyme-linked immunosorbent assay (ELISA) kit [10].
- Analysis: Compare IFN-β concentrations across treatment groups to determine the relative suppression of the immune response.
Protocol 2: Measuring Functional Translation Enhancement
This protocol directly measures the increase in protein output, which is the ultimate goal of a translation booster.
- Transfection: Follow the same transfection and treatment scheme as in Protocol 1, using mRNA encoding a reporter protein like GFP or luciferase.
- Flow Cytometry: At 24-48 hours post-transfection, harvest cells and analyze via flow cytometry. The key metric is the mean fluorescence intensity (MFI) of the live cell population, which reflects the amount of GFP protein produced per cell [10].
- Alternative Analysis: For luciferase or other non-fluorescent reporters, perform a Western blot or a functional enzymatic assay to quantify protein expression levels.
- Critical Interpretation: Correlate the results with IFN-β data from Protocol 1. A successful booster should show both reduced IFN-β and increased MFI. Note that some compounds may inhibit IFN but fail to enhance—or even suppress—translation, highlighting the need for multi-parameter assessment [10].
Protocol 3: Assessing Endosomal Escape Efficiency
This protocol evaluates the ability of booster systems to facilitate the release of mRNA from endosomes.
- mRNA Labeling: Use dye-labeled mRNA (e.g., Cy5) or a reporter mRNA encoding an endosomal escape-activated fluorophore.
- Live-Cell Imaging: Transfert cells and perform live-cell confocal microscopy at various time points (e.g., 1, 4, 8, 24 hours).
- Colocalization Analysis: Stain endosomes/lysosomes with specific markers (e.g., LysoTracker). Analyze images to determine the percentage of mRNA signal that does not colocalize with endosomal compartments over time. A higher rate of colocalization loss indicates more efficient endosomal escape.
Troubleshooting Guide: Addressing Common Experimental Challenges
FAQ 1: I found a compound that effectively suppresses IFN-β, but my target protein expression does not improve. What could be wrong?
This is a common discrepancy. As observed in a systematic screen, many small molecule IFN inhibitors (e.g., sertraline, C16) successfully reduced IFN-β but did not enhance—and sometimes even inhibited—reporter GFP expression [10]. Potential causes include:
- Compound Toxicity: The inhibitor may have off-target cytotoxic effects that generally impair cellular health and the translation machinery, independent of the IFN pathway.
- Insufficient Pathway Blockade: The inhibitor might not fully suppress the IFN response, leaving residual PKR activity enough to suppress translation.
- Disruption of Essential Processes: The compound could interfere with critical steps in the mRNA translation process itself, such as ribosome loading or elongation.
- Solution: Always couple IFN measurement with direct quantification of your target protein. Prioritize boosters that show a clear correlation between reduced IFN and increased protein yield. Consider combining different strategies, such as using nucleoside-modified mRNA alongside a delivery-optimizing booster [25] [36] [10].
FAQ 2: How can I improve booster efficiency in hard-to-transfect primary cells?
Primary cells are notoriously difficult to transfect and highly sensitive to immune activation.
- Use Multifaceted Approaches: Relying on a single booster may be insufficient. Combine chemical modification (m1Ψ), immune-suppressive reagents (like B18R, a decoy IFN receptor), and delivery vehicles optimized for primary cells [10] [26].
- Optimize Transfection Conditions: Use reagents specifically validated for primary cells. Optimize cell confluency (often 60-80%), reduce serum concentration during transfection if possible, and minimize complex exposure time to 4-6 hours to limit toxicity [26].
- Consider Delivery Method: For particularly resistant primary cells, electroporation might be more effective than lipid-based methods, though it requires specialized equipment [26].
FAQ 3: My booster works in a single dose, but efficiency drops sharply in repeated transfections. How can I maintain efficacy?
This directly relates to the cumulative interferon response.
- Pre-condition with Low-Level Immune Suppression: Utilize low-dose nucleoside-modified mRNA for initial transfections to minimize the initial IFN spike that primes the antiviral state [25] [10].
- Employ Non-Immunogenic Vectors: Ensure your delivery system (e.g., certain LNPs) itself does not act as a DAMP (Damage-Associated Molecular Pattern) and trigger innate immunity [58].
- Rotate or Combine Boosters: Using a single inhibitor repeatedly may lead to adaptive responses or toxicity. A cocktail of boosters with different mechanisms (e.g., a PRR inhibitor plus a tRNA) may provide more sustained effects [25] [59].
The Scientist's Toolkit: Key Research Reagents
Table 2: Essential Reagents for mRNA Translation Enhancement Research
| Reagent / Material | Function & Utility | Example Application |
|---|---|---|
| N1-methylpseudouridine (m1Ψ) | Nucleoside triphosphate for IVT; reduces immunogenicity by evading PRR recognition [36]. | Baseline modification for all in vitro and in vivo mRNA to lower innate immune activation. |
| Lipid Nanoparticles (LNPs) | Primary delivery vector; protects mRNA, enhances cellular uptake, and facilitates endosomal escape [60] [58]. | The standard vehicle for efficient in vivo delivery of mRNA and co-delivered booster agents. |
| Chemically Modified tRNA | Translation enhancer; augments stability and decoding efficiency of cognate-codon-rich mRNA [59]. | Co-delivery with target mRNA to boost protein expression levels, as in the "tRNA-plus" strategy. |
| B18R Protein | Recombinant decoy receptor that binds and neutralizes extracellular type I IFN [10]. | Added to cell culture medium to break the cycle of paracrine IFN signaling in repeated transfections. |
| GFP/Luciferase Reporter mRNA | Unmodified and nucleoside-modified versions; enables rapid quantification of translation efficiency [10]. | Essential control and experimental tool for screening and validating booster efficacy via flow cytometry or luminescence. |
| IFN-β ELISA Kit | Quantifies secretion of IFN-β, a key marker of innate immune activation [10]. | Critical for confirming that booster agents are effectively suppressing the PRR-driven immune response. |
A major hurdle in the application of RNA-based technologies, particularly in protocols requiring repeated transfections, is the innate immune response. Mammalian cells are equipped with pattern recognition receptors (PRRs), such as Toll-like receptors (TLR3, TLR7, TLR8) and retinoic acid-inducible gene-I (RIG-I), that detect foreign RNA as a viral invader [61] [10] [11]. This recognition triggers a signaling cascade that results in the production of type I interferons (IFN-α, IFN-β) and pro-inflammatory cytokines [11]. The ensuing interferon response activates effector proteins like protein kinase R (PKR), which phosphorylates elongation factor eIF2α, leading to a global shutdown of cellular protein synthesis and the specific degradation of mRNA [10]. Consequently, the translation of the transfected therapeutic or experimental RNA is drastically reduced, undermining the efficacy of the procedure. This is especially problematic for repeated mRNA transfection, where the initial dose can prime the cellular defense systems, leading to progressively lower protein yields in subsequent transfections and increased cytotoxicity [10] [23]. This technical brief explores the potential of two novel RNA platforms—self-amplifying RNA (saRNA) and circular RNA (circRNA)—to overcome these limitations, providing troubleshooting guidance for researchers.
Self-Amplifying RNA (saRNA) Troubleshooting Guide
Frequently Asked Questions (FAQs)
Q1: What is the core advantage of saRNA that could help mitigate issues with repeated transfections? saRNA is an engineered RNA platform derived from the genome of positive-strand RNA viruses (e.g., alphaviruses) [62]. Its key advantage is efficient intracellular amplification. The saRNA construct retains the viral non-structural proteins (nsP1-4) that form the replication machinery but replaces the viral structural genes with the antigen or protein of interest. After delivery and translation, this replicase complex amplifies the saRNA template exponentially within the cytoplasm [62]. This means a much lower initial dose of RNA is required to achieve high levels of protein expression, potentially reducing the stimulus for a potent interferon response compared to conventional mRNA that cannot self-amplify.
Q2: My saRNA experiment shows poor protein expression. What could be the cause? Poor expression from saRNA can stem from several factors. The large size of the saRNA construct (typically 9-12 kb) poses a significant challenge for packaging into delivery vehicles like lipid nanoparticles (LNPs) and can hinder cellular uptake and endosomal escape [62]. Furthermore, the viral replication machinery itself, particularly double-stranded RNA (dsRNA) intermediates formed during amplification, are potent ligands for RIG-I and other PRRs, potentially triggering a strong interferon response that halts translation [62]. It is critical to ensure your delivery system is optimized for large RNA molecules and to consider strategies to dampen the immune recognition of the replicative intermediates.
Q3: How can I improve the performance and safety of my saRNA system?
- Optimize the Replicon: Consider using engineered replicons with point mutations in the nsP proteins that reduce the innate immune activation while maintaining robust replication [62].
- Employ Modified Nucleotides: Incorporating naturally modified nucleotides such as N1-methylpseudouridine and 5-methylcytidine during in vitro transcription has been shown to reduce immunogenicity by evading recognition by PRRs, thereby enhancing translation [62].
- Sequence Optimization: Codon optimization of the gene of interest and ensuring robust secondary structures at the 5' and 3' ends can significantly enhance translation efficiency and RNA stability [62].
Experimental Protocol: Assessing Innate Immune Activation by saRNA
This protocol helps quantify the interferon response triggered by your saRNA construct, a critical parameter for optimization.
Materials:
- Cells: Primary human monocytes or macrophages are highly sensitive and recommended for this assay [11]. HEK-293 reporter cell lines stably expressing IFN-beta promoter-driven luciferase are a convenient alternative.
- Reagents: saRNA (modified and unmodified), transfection reagent (e.g., liposomal-based Lipofectamine MessengerMAX), ELISA kits for human IFN-β and TNF-α.
Method:
- Cell Seeding: Seed cells in a 24-well plate.
- Transfection: Transfect cells with a range of saRNA doses (e.g., 50-500 ng/well). Always include a control group transfected with conventional mRNA and a mock-transfected control.
- Sample Collection:
- 6 Hours Post-Transfection: Collect cell culture supernatant to analyze for early innate immune cytokines (IFN-β, TNF-α) by ELISA [11].
- 24 Hours Post-Transfection: Harvest cells to analyze reporter gene expression (e.g., by flow cytometry) and surface activation markers like CD80 via flow cytometry [11].
- Data Analysis: Compare cytokine levels and activation marker expression between saRNA, mRNA, and control groups. Successful saRNA platforms should show a favorable profile with high protein expression and lower cytokine levels.
Table 1: Key Reagents for saRNA Research
| Reagent / Material | Function | Example & Notes |
|---|---|---|
| Capped & Tailed saRNA | Template for intracellular amplification and protein expression. | Ensure synthesis includes a Cap-1 structure and a long poly(A) tail for stability and efficient translation [62]. |
| Modified Nucleotides | Reduces immunogenicity of the RNA. | Use N1-methylpseudouridine and 5-methylcytidine triphosphates during IVT to evade innate immune sensors [62]. |
| Lipid Nanoparticles (LNPs) | Delivery vehicle for protecting and delivering saRNA into cells. | Crucial for in vivo applications. Must be optimized for large saRNA size [62]. |
| Type I IFN ELISA Kits | Quantifies interferon response to the saRNA platform. | Essential for benchmarking and comparing different saRNA designs [11]. |
Circular RNA (circRNA) Troubleshooting Guide
Frequently Asked Questions (FAQs)
Q1: How is circRNA different, and why is it relevant to interferon response? Circular RNAs are a class of single-stranded, covalently closed RNA molecules produced by a process called backsplicing [61]. They lack the 5' cap and 3' poly(A) tail of linear mRNAs. This closed structure makes them highly resistant to degradation by cellular exonucleases, granting them exceptional molecular stability and a significantly longer half-life than their linear counterparts [61]. This intrinsic stability means that a single transfection of circRNA could sustain protein expression for a prolonged period, potentially eliminating the need for repeated transfections and thus reducing cumulative interferon activation.
Q2: I've heard circRNA can be immunogenic. Is this a concern? Yes, this is a critical consideration. While endogenous self-circRNAs are not immunogenic, exogenously produced and delivered circRNAs can be recognized by cellular PRRs [61]. RIG-I, in particular, has been shown to sense foreign circRNAs and activate the interferon pathway [61] [63]. The immunogenicity appears to depend on the purity of the preparation and the specific sequence/structure of the circRNA. Impure circRNA formulas containing linear RNA contaminants or double-stranded structures are potent inducers of interferon [61].
Q3: How can I minimize the immunogenicity of my circRNA preparation?
- Purification is Paramount: Rigorous purification after in vitro circularization is essential to remove any residual linear RNA or misfolded intermediates that act as PAMPs (Pathogen-Associated Molecular Patterns) [61].
- Sequence and Structure Engineering: Design circRNAs with optimized sequences that avoid motifs known to trigger RIG-I/MDA5. Some studies suggest that specific endogenous circRNAs, like circCsnk1g3 and circAnkib1, can even act as negative regulators of RIG-I signaling, providing design inspiration [63].
- Utilize Modified Nucleotides: Similar to saRNA and conventional mRNA, incorporating modified nucleotides like pseudouridine can help shield the circRNA from immune recognition [61].
Experimental Protocol: Testing circRNA Stability and Immune Profile
This protocol outlines how to verify the circular nature of your RNA and assess its stability and immunogenicity.
Materials:
- RNA: Your in vitro synthesized circRNA and a control linear mRNA encoding the same protein.
- Enzymes: RNase R (an exonuclease that degrades linear RNA but not circRNAs) [63].
- Reagents: Actinomycin D (a transcription inhibitor), transfection reagents, ELISA kits for cytokines.
Method:
- Verification of Circularity:
- Treat 1-2 µg of your RNA sample with RNase R.
- Incubate according to the manufacturer's protocol.
- Analyze the RNA by gel electrophoresis or RT-qPCR. A bonafide circRNA will be resistant to degradation, showing a clear band and high qPCR signal post-treatment, while linear RNA will be degraded [63].
- Stability Assay:
- Transfect cells with circRNA and linear mRNA.
- Add Actinomycin D to block new RNA transcription.
- Harvest cells at various time points (e.g., 0, 8, 24, 48 hours) and measure the remaining levels of the expressed protein or the RNA itself (using divergent primers for circRNA). circRNA should show a significantly longer half-life [61] [63].
- Immune Profiling:
- Follow a similar cytokine profiling protocol as described for saRNA (see Section 2.2), transfecting cells with an equal mass of circRNA and linear mRNA and measuring IFN-β and other cytokines in the supernatant [11].
Table 2: Key Reagents for circRNA Research
| Reagent / Material | Function | Example & Notes |
|---|---|---|
| RNase R | Validates successful circularization of RNA. | Digests linear RNA contaminants; true circRNAs will persist after treatment [63]. |
| Divergent Primers | Specifically detects the backsplice junction of circRNA via RT-qPCR. | Essential for distinguishing circRNA from its linear cognate mRNA [61] [63]. |
| Actinomycin D | Inhibits cellular transcription to measure RNA half-life. | Used in stability assays to demonstrate the superior longevity of circRNA [63]. |
| In Vitro Transcription & Ligation Kit | Synthesizes circRNA from a DNA template. | Specialized kits are required for the efficient production of covalently closed circRNAs. |
The Scientist's Toolkit: Research Reagent Solutions
The following table consolidates key reagents essential for working with saRNA and circRNA platforms.
Table 3: Essential Research Reagents for Novel RNA Platforms
| Category | Reagent | Specific Function |
|---|---|---|
| Nucleotide Modifications | N1-methylpseudouridine, 5-methylcytidine | Reduces immunogenicity by evading detection by PRRs (TLRs, RIG-I), leading to enhanced translation efficiency [62]. |
| Delivery Systems | Liposomal Reagents (e.g., Lipofectamine MessengerMAX), Lipid Nanoparticles (LNPs) | Form complexes with RNA, protect it, facilitate cellular uptake, and enable endosomal escape. Choice is critical for efficiency [11]. |
| Immune Monitoring | ELISA Kits (e.g., for IFN-β, TNF-α) | Quantifies the activation of the innate immune system in response to transfected RNA, a key metric for platform optimization [11]. |
| circRNA Validation | RNase R, Divergent Primers | Confirms the circular structure and allows specific quantification of circRNA, distinct from linear RNA [61] [63]. |
| Cell Models | Primary Human Monocytes/Macrophages, HEK-293 IFN-promoter reporter cells | Sensitive and biologically relevant systems for assessing RNA immunogenicity and performance [11]. |
Comparative Pathways and Workflow
The diagram below illustrates the different cellular fates of saRNA and circRNA compared to conventional mRNA, and how they interact with the innate immune system.
The following workflow provides a generalized protocol for testing a novel RNA construct's performance and immune activation.
Optimizing Repeated Dosing Regimens: From Transient IFNAR Blockade to Personalized Schedules
Frequently Asked Questions (FAQs)
Q1: Why does the protein expression from a second mRNA dose often appear diminished? This is frequently due to the innate immune system's interferon (IFN) response triggered by the initial dose. Transfected mRNA can be recognized by cytosolic sensors (like RIG-I/MDA5) and endosomal Toll-like receptors (TLR-7/8), leading to IFN release. This IFN-stimulated state upregulates various antiviral effectors that can degrade subsequent mRNA doses and broadly inhibit cellular translation, reducing protein yield from repeated administrations [64] [15].
Q2: What are the key strategies to overcome interferon responses in sequential dosing? Researchers can employ a multi-pronged approach:
- mRNA Sequence Engineering: Using nucleoside modifications, such as N1-methylpseudouridine, to cloak the mRNA from innate immune recognition [25] [65].
- Incorporating Translation Boosters: Co-delivering small-molecule compounds that specifically inhibit pattern recognition receptors or downstream inflammatory cascades [16].
- Optimizing Dosing Intervals: Allowing the IFN response to subside before the next administration. The optimal window must balance immune activation decay and the persistence of the desired therapeutic effect [64] [25].
- Advanced Delivery Systems: Using refined lipid nanoparticles (LNPs) that enhance delivery efficiency and can be tuned for specific tissue tropism, potentially reducing off-target immune activation [52] [64].
Q3: How can the timing between sequential mRNA doses be optimized experimentally? Optimal timing is context-dependent but can be determined by monitoring the kinetics of the interferon response relative to protein expression decay. A typical experimental workflow involves:
- Administering a primary mRNA dose.
- Measuring protein expression (e.g., via luminescence) and IFN-related biomarkers (e.g., serum cytokines, expression of IFN-stimulated genes) over several days.
- Administering a second dose at various time points (e.g., day 3, 5, 7, 10) after the first.
- Comparing the protein expression level from the second dose to the first to identify the time point where the response is no longer blunted. The goal is to find the interval where IFN signaling has sufficiently resolved but therapeutic protein levels are still relevant [64] [25].
Q4: Does the dosage amount affect the interferon response in repeated administrations? Yes, there is a strong correlation. Higher initial doses are more likely to provoke a robust and sustained interferon response, which can more significantly inhibit the efficacy of subsequent doses. Finding the minimum efficacious dose for the primary administration is a key strategy to mitigate this interference [25] [15].
Troubleshooting Guides
Problem: Greatly Reduced Protein Expression After Second mRNA Dose
| Potential Cause | Investigation Methods | Recommended Solutions |
|---|---|---|
| Active Interferon Response | - Measure mRNA & protein levels of IFN-β and ISGs (e.g., OAS1, MX1) via qPCR/Western Blot pre- & post-boost [64]. | - Extend the interval between doses (e.g., from 3 weeks to 6 weeks).- Use immune-silent mRNA (N1-methylpseudouridine-modified) [25] [65]. |
| Antiviral State in Target Cells | - Test cellular translation capacity with a control reporter mRNA. | - Employ mRNA translation boosters (e.g., kinase inhibitors of the IFN pathway) [16].- Switch LNP formulations to one with different tropism, targeting a less-activated cell population [52]. |
| Anti-Nanoparticle Immunity | - Detect anti-PEG or anti-LNP antibodies in serum via ELISA. | - Use alternative non-PEGylated or biomimetic delivery systems (e.g., extracellular vesicles) [52] [15]. |
Problem: Inconsistent Results in Repeat-Dosing Animal Studies
| Potential Cause | Investigation Methods | Recommended Solutions |
|---|---|---|
| Variable mRNA/LNP Batch Quality | - Characterize LNP size, PDI, and encapsulation efficiency for each batch. | - Implement strict Quality Control (QC) measures for mRNA and LNP manufacturing [64].- Use a single, large GMP-grade batch for a full study series. |
| Host-Specific Variations | - Stratify animals by age, sex, and baseline immune status. | - Pre-screen animals for baseline inflammation.- Increase group sizes to account for biological variability [25]. |
| Suboptimal Dosing Interval | - Conduct a pilot kinetics study to map protein expression and IFN response over time. | - Empirically determine the optimal re-dosing window for your specific mRNA, LNP, and disease model [25]. |
Experimental Data and Protocols
The table below summarizes key quantitative findings from recent research relevant to optimizing sequential mRNA administration.
Table 1: Experimental Data on mRNA Expression Kinetics and Optimization Strategies
| mRNA / LNP Construct | Model System | Primary Dose Expression Peak & Duration | Key Finding for Sequential Dosing | Reference |
|---|---|---|---|---|
| Luciferase mRNA with A50L50LO poly(A) tail | C57BL/6 mice (IM) | Peak at 6h, sustained at 24h. | A stabilized poly(A) tail with a loop structure maintained higher expression at 24h, which is critical for robust initial response. | [66] |
| Standard Unmodified Luciferase mRNA | In vivo (general) | Peaks at 12-24h, declines sharply by 48-72h, near baseline by ~1 week. | The short expression window may necessitate more frequent re-dosing, potentially exacerbating IFN responses. | [64] |
| N1-methylpseudouridine Modified mRNA | In vivo & Clinical | Similar peak but potentially higher yield due to reduced immunogenicity. | The modified base is critical for evading innate sensing, allowing for more effective repeated administration. | [25] [65] |
| Self-Amplifying mRNA (saRNA) | Preclinical models | Lower peak but can extend expression for weeks. | May enable longer intervals between doses due to prolonged antigen production, potentially avoiding IFN-primed windows. | [64] [25] |
| Circular RNA (circRNA) | Preclinical models | Lower amplitude but can persist for months. | Exceptional stability avoids exonuclease degradation, ideal for applications requiring sustained expression with minimal re-dosing. | [25] [15] |
Detailed Protocol: Evaluating Interferon Response Kinetics for Dosing Optimization
This protocol outlines the key steps for determining the optimal timing between two mRNA doses.
I. Materials and Reagents
- Experimental mRNA: N1-methylpseudouridine-modified, encoding your target antigen and a reporter (e.g., Luciferase).
- Control mRNA: Unmodified mRNA, or mock formulation (PBS).
- LNP Delivery System: A well-characterized, sterile LNP formulation.
- Animal Model: C57BL/6 mice (or model relevant to your research).
- Equipment: In vivo imaging system (IVIS) for bioluminescence, ELISA plate reader, qPCR machine.
- Assay Kits: ELISA kits for mouse IFN-β, Luminescence assay kit, RNA extraction kit, cDNA synthesis kit.
II. Procedure
- Primary Dosing and Initial Kinetics:
- Divide mice into several cohorts.
- Administer the primary dose of mRNA-LNP to all mice in the experimental groups via the intended route (e.g., intramuscular, intravenous).
- Monitor protein expression kinetics:
- Image mice using IVIS at 6, 12, 24, 48, and 72 hours post-injection. Quantify total flux or radiance.
- Monitor interferon response kinetics:
- At the same time points, collect serum from a subset of mice via retro-orbital bleeding for IFN-β measurement by ELISA.
- Sacrifice a subset of mice at each time point, harvest relevant tissues (e.g., muscle at injection site, spleen, liver), and isolate RNA.
- Perform qPCR to analyze the expression of interferon-stimulated genes (ISGs) like
Oas1,Mx1, andIfit1.
Data Analysis and Interval Selection:
- Plot the curves for protein expression and ISG mRNA levels over time.
- Identify the time point when the protein expression from the first dose has significantly declined but, crucially, the ISG levels have returned to near-baseline. This is your hypothesized optimal re-dosing window.
Secondary Dosing and Efficacy Assessment:
- Based on the kinetics data, establish new experimental groups for the second dose. Example groups:
- Group A: Second dose at Day 4 (peak IFN period).
- Group B: Second dose at Day 7 (IFN resolving).
- Group C: Second dose at Day 14 (baseline IFN).
- Control Group: Primary dose only.
- Administer the second mRNA dose (identical construct and amount) to the groups at their designated times.
- Measure protein expression (via IVIS) at 6, 12, and 24 hours after the second dose.
- Based on the kinetics data, establish new experimental groups for the second dose. Example groups:
Comparison and Conclusion:
- Compare the peak protein expression after the second dose across all groups. The group with the highest expression without a resurgence of a strong IFN response indicates the most effective dosing interval.
Signaling Pathways and Experimental Workflows
Diagram 1: Interferon Signaling Pathway in Repeated mRNA Transfection
Diagram 2: Experimental Workflow for Optimal Timing
The Scientist's Toolkit: Research Reagent Solutions
Table 2: Essential Reagents for Investigating Sequential mRNA Administration
| Category | Reagent / Tool | Function & Utility in Research |
|---|---|---|
| mRNA Engineering | N1-methylpseudouridine | Modified nucleoside; reduces immunogenicity by evading innate immune sensors, crucial for repeated dosing [25] [65]. |
| Stabilized Cap Analogue (CleanCap) | Enhances translation initiation efficiency and mRNA stability, maximizing protein yield per dose [64]. | |
| Optimized poly(A) tail (e.g., A50L50LO) | A loop-structured poly(A) tail improves mRNA stability and duration of protein expression, as demonstrated in [66]. | |
| Delivery Systems | Ionizable Lipid NPs | The core delivery vehicle; modern lipids can be tuned for specific organ tropism (e.g., lung) and reduced reactogenicity [52] [64]. |
| Polymer-based Nanoparticles | Alternative to LNPs; can offer different biodistribution and release profiles (e.g., PEG-PLL, PEI derivatives) [15]. | |
| Translation Boosters | Small-molecule PKR inhibitors | Blocks the double-stranded RNA-dependent protein kinase R, a key effector of the IFN-mediated translation blockade [16]. |
| TLR Antagonists | Inhibits endosomal TLR-7/8 activation, preventing the initial IFN response cascade upon mRNA delivery [16]. | |
| Analysis & Validation | ISG-Specific qPCR Panels | Pre-designed assays to quantitatively monitor the interferon response in tissues (e.g., for OAS1, MX1, ISG15) [64]. |
| In vivo Imaging System (IVIS) | Allows non-invasive, longitudinal tracking of reporter protein (e.g., luciferase) expression in live animals [66]. |
Frequently Asked Questions (FAQs)
Q1: What is the core principle behind using transient IFNAR blockade to enhance adaptive immunity? The core principle is to temporarily inhibit the type I interferon (IFN-α/β) signaling pathway during the initial phase of immunization. While type I interferon (IFN-I) is a potent antiviral cytokine, its signaling in the early stages of vaccination can paradoxically attenuate the subsequent adaptive immune response. Transiently blocking its receptor (IFNAR) shifts the immune environment to favor the development of robust and long-lived T cell memory and enhances antibody production [67] [29].
Q2: When is the critical window for administering IFNAR blocking antibodies? Research indicates that the most effective timing for IFNAR blockade is very early in the immune response. For a model like lymphocytic choriomeningitis virus (LCMV) Armstrong infection, blocking IFNAR at the time of infection and the following day (days 0 and 1) yielded the highest increase in stem-like memory T (TSCM) cells [67]. Another study on mRNA vaccination administered the blocking antibody 24 hours before and 24 hours after immunization [29].
Q3: Why does inhibiting an antiviral pathway improve vaccine efficacy? Although essential for controlling viral infections, a strong early type I interferon response can have suppressive effects on adaptive immunity. It can inhibit the translation of the antigen encoded by mRNA vaccines, potentially limiting antigen availability [29]. Furthermore, IFNAR blockade alters chemokine gradients, promoting the retention of activated T cells in lymph nodes. This change in location provides a microenvironment conducive to their differentiation into long-lived stem cell-like memory T (TSCM) cells, which are crucial for durable protection [67].
Q4: What are the key experimental readouts to measure the success of this strategy? Successful transient IFNAR blockade should be evidenced by:
- Enhanced Cellular Immunity: Increased frequency and number of antigen-specific CD8+ T cells, particularly the TCF-1+ SLAMF6+ stem-like memory (TSCM) population [67] [29].
- Improved Humoral Immunity: Elevated titers of antigen-specific antibodies [29].
- Superior Protection: Enhanced defense against subsequent pathogen challenge or, in oncology contexts, improved tumor control [67].
Q5: Are the effects of IFNAR blockade different between mRNA vaccines and viral vector-based approaches? The fundamental mechanism—modulating early innate signaling to enhance adaptive immunity—is broadly applicable. However, the specific outcomes may vary because different vaccine platforms (e.g., mRNA-LNP vs. viral vectors) engage the innate immune system in distinct ways. The mRNA component itself in LNP-mRNA vaccines has been identified as a key trigger of IFNAR-dependent innate activation, making it a particularly relevant platform for this strategy [14] [29].
Troubleshooting Guide
Problem: No Observed Enhancement of T Cell Responses
- Potential Cause 1: Incorrect timing of antibody administration.
- Solution: The blockade must be applied during a narrow window at the initiation of the immune response. Ensure the antibody is administered prior to or simultaneously with the vaccine/antigen. Optimize the schedule based on your model; a common effective regimen is one dose before and one dose after immunization [67] [29].
- Potential Cause 2: Insufficient dose of the blocking antibody.
- Potential Cause 3: The vaccine platform or pathogen model may not be highly dependent on early IFN-I signaling for its immunomodulatory effects.
- Solution: Include a positive control, such as an LNP-mRNA vaccine, which is known to induce a strong IFNAR-dependent response [29].
Problem: Excessive Viral Load or Loss of Infection Control
- Potential Cause: The transient blockade may have compromised the innate antiviral defense too severely in your infection model.
- Solution: Carefully monitor pathogen levels. This strategy is best suited for vaccine/challenge models where the challenge pathogen is controllable or for non-infectious vaccine platforms like mRNA. The use of a "transiently immunocompromised" model via antibody treatment, as opposed to genetic knockout, helps mitigate this risk [68].
Problem: High Variability in Results Between Experiments
- Potential Cause 1: Inconsistent biodistribution or activity of the blocking antibody between animals.
- Solution: Use antibodies from a reliable commercial source, ensure proper storage, and confirm the blocking efficacy in a pilot experiment, for instance, by measuring the inhibition of interferon-stimulated gene (ISG) expression.
- Potential Cause 2: Differences in the baseline immune status of animals or microbial flora.
- Solution: Use age- and sex-matched animals from a single source and house them under consistent specific-pathogen-free (SPF) conditions [68].
The table below summarizes key quantitative findings from foundational studies on transient IFNAR blockade.
Table 1: Summary of Experimental Findings from Transient IFNAR Blockade Studies
| Study Model | Intervention | Key Quantitative Findings | Reference |
|---|---|---|---|
| LCMV Armstrong Infection | Anti-IFNAR Ab (d0-1) | Highest increase in frequency and number of TCF-1+ SLAMF6+ stem-like CD8+ T cells at peak response (day 8). | [67] |
| LNP-mRNA Vaccination | Anti-IFNAR Ab (-24h, +24h) | Significantly enhanced frequencies of antigen-specific CD8+ T cells and elevated titers of antigen-specific antibodies. | [29] |
| Dengue Virus (D2Y98P) Challenge | MAR1-5A3 Ab (1 day prior to infection) | No infectious virus detected in sera/organs, but high levels of viral RNA indicated productive replication. Model showed no signs of illness. | [68] |
Essential Signaling Pathways and Workflows
Diagram 1: Mechanism of Enhanced T Cell Memory via Early IFNAR Blockade
This diagram illustrates the mechanism by which early, transient IFNAR blockade promotes the formation of stem cell-like memory T cells (TSCM) by altering T cell positioning within the lymph node.
Diagram 2: Experimental Workflow for mRNA Vaccination Studies
This diagram outlines a standard experimental workflow for evaluating the effect of transient IFNAR blockade on mRNA vaccine-induced immunity.
The Scientist's Toolkit: Key Research Reagents
Table 2: Essential Reagents for Investigating Transient IFNAR Blockade
| Reagent / Resource | Function / Description | Example Product / Model |
|---|---|---|
| IFNAR1-blocking Antibody | Monoclonal antibody that binds to and blocks the IFN-α/β receptor 1 (IFNAR1), inhibiting downstream signaling. | Clone MAR1-5A3 (mouse) [68] [67] [29] |
| Isotype Control Antibody | A critical control antibody with the same IgG isotype but without specificity for IFNAR, used to confirm the specific effect of blockade. | Mouse IgG1 isotype control (e.g., clone GIR-208) [68] |
| LNP-mRNA Vaccine | A potent vaccine platform known to induce strong IFNAR-dependent innate immunity, making it an ideal model for this strategy. | In-house formulated or commercial LNP-mRNA [14] [29] |
| IFNAR1-Deficient Mice | Genetically modified mice lacking the Ifnar1 gene. Used as a full knockout control to compare against the transient blockade model. | Ifnar1-/- mice [68] |
| Flow Cytometry Panels | Antibody panels for identifying T cell subsets, particularly stem-like memory T cells (TSCM: CD44+ CD62L+ TCF-1+ SLAMF6+). | Antibodies against CD8, CD44, CD62L, TCF-1, SLAMF6 [67] |
Frequently Asked Questions (FAQs)
Q1: Why do my cells show reduced protein expression and signs of stress after multiple mRNA transfections, and how can I mitigate this?
Repeated transfections of in vitro transcribed (IVT) mRNA can trigger a cumulative antiviral response in cells. This occurs because the transfected mRNA is recognized by pattern recognition receptors (e.g., TLRs, RLRs), leading to a sustained interferon (IFN) release [10] [11]. The resulting IFN signaling induces an antiviral state in the cells, primarily through the upregulation of proteins like protein kinase R (PKR), which acts to inhibit the translation of both foreign and cellular mRNA, thereby reducing the yield of your desired protein [10] [69]. This state of "transfection inhibition" can be managed by using nucleotide-modified mRNA. Incorporating pseudouridine (ψ) and 5-methyl-cytidine (m5C) during IVT synthesis has been shown to significantly reduce the recognition of mRNA by innate immune sensors, leading to lower IFN production and higher translation efficiency [10] [11].
Q2: What are the critical factors to optimize in my transfection protocol to minimize innate immune activation, especially in sensitive cells like macrophages?
The key factors are the choice of carrier system, mRNA nucleotide modification, and mRNA dose. Sensitive primary cells, such as human monocytes and macrophages, are particularly adept at mounting a strong inflammatory response to exogenous nucleic acids [11]. The table below summarizes the performance of different carrier types in these cells:
| Carrier Type | Example Product | Transfection Efficiency | Impact on Cell Viability | Immune Activation (with modified mRNA) |
|---|---|---|---|---|
| Liposomal | Lipofectamine MessengerMax | High | Moderate (dose-dependent) [11] | Moderate [11] |
| Liposomal | ScreenFect mRNA | Moderate | Moderate (dose-dependent) [11] | Moderate [11] |
| Polymeric | Viromer RED | Moderate | Moderate (dose-dependent) [11] | Moderate [11] |
Furthermore, mRNA dosage is critical. High mRNA doses (e.g., >500 ng/well for macrophages in a 96-well plate) can cause a significant drop in cell viability, even when using modified nucleotides [11]. It is essential to titrate the mRNA to the lowest effective concentration. Using modified mRNA (ψ and m5C) is essential to lower the activation of endosomal TLRs and other cytosolic sensors, thereby reducing the secretion of cytokines like TNF-α and IFN-β [11].
Q3: I've read about using small molecule inhibitors to block the interferon pathway. Is this a reliable strategy?
Based on current research, this strategy has significant limitations. A systematic screen of commercially available small molecules, including published IFN inhibitors, found that none enhanced mRNA transfection efficiency in human fibroblasts within non-toxic concentration ranges [10]. Although some compounds (e.g., certain PKR inhibitors and natural compounds) successfully reduced IFN-β production, this did not correlate with improved translation of the transfected mRNA; in many cases, protein expression was unexpectedly inhibited [10]. Therefore, while small molecules can suppress IFN output, they may introduce unintended cytotoxicity or disrupt other cellular processes essential for translation, making them an unreliable standalone solution for improving transfection efficiency.
Q4: How does the cumulative toxicity from repeated transfection differ from acute toxicity, and why is it a concern for therapeutic development?
Cumulative toxicity refers to the aggregation of adverse events over multiple treatment cycles, which is a recognized challenge in the development of molecularly targeted agents [70]. In the context of mRNA transfection, acute toxicity might result from a single, high dose of transfection reagent or mRNA, quickly impacting cell viability. In contrast, cumulative toxicity from repeated transfections is driven by the prolonged and repeated activation of innate immune pathways, even at low doses per transaction. This can lead to chronic inflammatory stress on the cells, resulting in progressive organ dysfunction or failure in vivo, a state analogous to multiple organ dysfunction syndrome (MODS) described in systemic inflammatory response syndrome (SIRS) [71]. This is a major concern for therapeutic applications that require serial dosing, as the cumulative inflammatory response could compromise both safety and efficacy.
Experimental Protocols & Troubleshooting Guides
Protocol 1: Assessing and Minimizing Immune Activation in Primary Human Macrophages
This protocol is adapted from a systematic study optimizing mRNA transfection in hard-to-transfect primary immune cells [11].
Objective: To transfert primary human monocyte-derived macrophages with high efficiency while minimizing immune activation and cytotoxicity.
Key Reagent Solutions:
- Cells: CD14+ monocytes isolated from human peripheral blood mononuclear cells (PBMCs), differentiated into macrophages with M-CSF for 7 days.
- mRNA: IVT-mRNA encoding a reporter protein (e.g., EGFP), synthesized with pseudouridine and 5-methyl-cytidine modifications.
- Carrier Systems: Lipofectamine MessengerMAX, ScreenFect mRNA, or Viromer RED.
- Assay Kits: ELISA kits for human TNF-α and IFN-β.
Workflow:
- Cell Preparation: Differentiate monocytes into macrophages in appropriate culture vessels.
- Complex Formation: Complex 125 ng of modified mRNA with the chosen transfection reagent according to the manufacturer's instructions. Note: Always include a non-transfected control and a control transfected with non-modified mRNA for comparison.
- Transfection: Apply the complexes to the macrophages.
- Post-Transfection Analysis:
- At 6 hours: Collect cell culture supernatant and analyze for TNF-α and IFN-β secretion by ELISA as markers of early immune activation.
- At 24 hours: Harvest cells.
- Analyze transfection efficiency by measuring EGFP-positive cells via flow cytometry.
- Assess cell viability using a dye like DAPI and flow cytometry.
Troubleshooting:
- Low Transfection Efficiency: Titrate the mRNA-to-reagent ratio. Ensure complexes are formed in serum-free medium as per instructions [50].
- High Cell Death: Reduce the mRNA dose. For sensitive cells, consider removing the transfection mixture and replenishing with fresh growth medium after 4-8 hours [50] [11].
- High Cytokine Secretion: Confirm the use of modified nucleotides. Ensure mRNA is pure and free of double-stranded RNA contaminants, which are potent inducers of interferon [50].
Protocol 2: Systematic Evaluation of Transfection Parameters for Minimizing Cumulative Stress
Objective: To identify the optimal conditions that maintain high transfection efficiency and cell health over multiple rounds of transfection.
Key Reagent Solutions:
- Cells: Relevant cell line for your research (e.g., BJ fibroblasts, HEK-293).
- mRNA: Modified and non-modified EGFP mRNA.
- Transfection Reagent: A well-tolerated, high-efficiency reagent like jetMESSENGER, designed for difficult-to-transfect cells [72].
- Assays: Flow cytometry for EGFP and viability dye, qPCR for ISG expression (e.g., PKR, OAS).
Workflow:
- Initial Setup: Plate cells at a recommended density (e.g., 50-70% confluence).
- Transfection Cycles: Perform transfections at a fixed interval (e.g., every 48 or 72 hours) for 3-5 cycles.
- Test Groups:
- Group 1: Modified mRNA at low dose (e.g., 50 ng/well)
- Group 2: Modified mRNA at medium dose (e.g., 250 ng/well)
- Group 3: Non-modified mRNA at medium dose (e.g., 250 ng/well)
- Test Groups:
- Monitoring: After each transfection cycle, analyze:
- Transfection Efficiency: Mean fluorescence intensity (MFI) of EGFP.
- Cell Health: Viability and metabolic activity assays.
- Immune Activation: Expression of interferon-stimulated genes (ISGs) via qPCR.
Expected Outcomes: The group transfected with a low dose of modified mRNA should show the most stable EGFP expression and viability over multiple cycles, while the group with non-modified mRNA will likely show a steep decline in protein output and an increase in ISG expression due to cumulative interferon response.
Table 1: Impact of Small Molecule Inhibitors on mRNA Transfection in Human Fibroblasts Summary of a screen assessing the effect of various small molecules on GFP expression and IFN-β production [10].
| Small Molecule Category | Example Compounds | Effect on GFP Expression | Effect on IFN-β Production |
|---|---|---|---|
| Cardiac Glycosides | Ouabain, Gitoxigenin | Significant inhibition | Not shown |
| Natural Compounds | Tetrandrine, Parthenolide | No enhancement or inhibition | Inhibited (Tetrandrine) |
| TLR3 Inhibitors | Sertraline, Fluphenazine | No enhancement | Significantly inhibited (except Amlodipine) |
| PKR Inhibitors | C16, 7-Desacetoxy-6,7-dehydrogedunin (7DG) | No effect (C16) or inhibition (7DG) | Efficiently inhibited |
Table 2: Performance of Transfection Reagents in Primary Human Monocytes and Macrophages Data adapted from a study comparing carrier systems, showing the interplay between efficiency, viability, and immune activation [11].
| Transfection Reagent | Nucleotide Modification | EGFP+ Macrophages | Cell Viability | TNF-α/IFN-β Secretion |
|---|---|---|---|---|
| Lipofectamine MessengerMAX | Non-modified | High | Moderate (dose-dependent) | High |
| Lipofectamine MessengerMAX | Pseudouridine/5-methyl-cytidine | High | Moderate (dose-dependent) | Low |
| ScreenFect mRNA | Non-modified | Moderate | Moderate (dose-dependent) | High |
| ScreenFect mRNA | Pseudouridine/5-methyl-cytidine | Moderate | Moderate (dose-dependent) | Low |
| Viromer RED | Non-modified | Moderate | Moderate (dose-dependent) | High |
| Viromer RED | Pseudouridine/5-methyl-cytidine | Moderate | Moderate (dose-dependent) | Low |
The Scientist's Toolkit: Research Reagent Solutions
| Reagent / Material | Function & Rationale |
|---|---|
| Nucleotide-Modified IVT-mRNA | Incorporation of pseudouridine (ψ) and 5-methyl-cytidine (m5C) passively evades recognition by Pattern Recognition Receptors (TLRs, RIG-I), thereby blunting the IFN response and enhancing protein translation [10] [11]. |
| Liposomal Transfection Carriers (e.g., Lipofectamine MessengerMAX) | Cationic lipid formulations condense mRNA, facilitate cellular uptake via endocytosis, and promote endosomal escape. Selected liposomal reagents provide high gene transfer rates with only moderate immune activation in primary cells [11]. |
| Polymer-Based Transfection Carriers (e.g., Viromer RED) | Cationic polymers form polyplexes with mRNA. They represent an alternative carrier system with different physicochemical properties that may be optimal for specific cell types or applications [11]. |
| Viability Assay Dyes (e.g., DAPI) | A membrane-impermeant dye used to discriminate live from dead/apoptotic cells in flow cytometry analysis post-transfection, a critical metric for assessing cytotoxicity [11]. |
| ELISA Kits for Cytokines (TNF-α, IFN-β) | Used to quantitatively measure the secretion of key pro-inflammatory cytokines into the cell culture supernatant, providing a direct readout of innate immune activation [11]. |
| Positive Control siRNAs/mRNAs | Reagents known to achieve high levels of knockdown or expression are used to validate delivery system performance and optimize experimental conditions in each cell type [50]. |
| Negative Control siRNAs (Non-targeting) | Scrambled sequence controls that account for non-specific effects of the transfection process and are crucial for establishing a baseline for evaluating experimental results [50]. |
Signaling Pathways and Experimental Workflows
Interferon Induction Pathway by IVT-mRNA
mRNA Transfection Optimization Workflow
Core Mechanisms: How Does the Innate Immune System Recognize and Respond to Exogenous mRNA?
What is the primary mechanism by which exogenous mRNA triggers an interferon (IFN) response? The interferon response to exogenous mRNA is primarily initiated when the delivered mRNA is recognized by cytosolic pattern recognition receptors (PRRs) as a foreign molecular pattern. Key sensors include RIG-I and MDA5, which detect viral-like RNA structures. This recognition activates a downstream signaling cascade that culminates in the production of type I interferons (IFN-α and IFN-β) [29] [28]. This process is integral to the platform's built-in adjuvanticity but can also suppress the translation of the encoded antigen, presenting a challenge for gene expression [29].
How do lipid nanoparticles (LNPs) contribute to this immune activation? While the mRNA component is identified as the essential trigger for a potent type I IFN response, the LNP component acts as a strong adjuvant that drives a separate, pro-inflammatory axis. Research shows that empty LNPs (without mRNA) can promote dendritic cell maturation and induce a stromal inflammatory response at the injection site, characterized by the production of cytokines like IL-6, TNF, and CCL2 [29] [14]. However, the specific, robust type I IFN signature is uniquely dependent on the mRNA [14].
The Critical Role of Age in IFN Signaling and Experimental Outcomes
What are the key age-related differences in IFN signaling? Age induces a fundamental rewiring of the type I interferon signaling pathway. In young individuals, immune cells respond to IFN stimulation primarily through the STAT1 transcription factor, leading to a strong antiviral gene profile. With advancing age, this signaling shifts toward a greater reliance on STAT3, which is associated with pro-inflammatory responses [73].
Table: Age-Dependent Shift in Interferon Signaling Pathways
| Age Group | Dominant Signaling Pathway | Associated Immune Cell Phenotypes | Functional Outcome |
|---|---|---|---|
| Children/Young | STAT1-driven | Strong ISG profiles; Follicular helper T cells; Germinal center B cells [73] | Targeted antiviral defense; efficient viral control [73] [74] |
| Adults/Older Adults | STAT3-driven | HLA-DRlow monocytes; Peripheral helper T cells; CD69+ atypical B cells [73] | Inflammation-prone response; delayed development of adaptive immunity [73] |
How does this "rewired" signaling impact the response to infection and vaccination? This STAT1-to-STAT3 shift has significant functional consequences. The inflammatory state in older adults is linked to delayed contraction of infection-induced T cells and a shift from follicular to extrafollicular B cell activation, which can impair the quality and kinetics of the adaptive immune response [73]. This may explain why excessive or sustained IFN signaling during COVID-19 was associated with delayed development of SARS-CoV-2-specific antibodies and T cells [75]. Furthermore, computational models indicate that the IFN-induced cellular response is 8 to 16-fold stronger in mice than in humans for the same weight-normalized dose, a critical consideration for translating preclinical findings [76] [77].
Troubleshooting Guide: Addressing IFN-Mediated Suppression of Transgene Expression
We observe high IFN response and low protein yield in our mRNA transfection experiments. What strategies can we employ? Your challenge is a common hurdle in mRNA-based research and therapy development. Below is a troubleshooting guide to help you identify the cause and implement solutions.
Table: Troubleshooting Guide for IFN-Mediated Suppression of Transgene Expression
| Problem Phenomenon | Potential Root Cause | Recommended Solution | Supporting Evidence |
|---|---|---|---|
| Low protein expression after transfection | Activation of cGAS-STING and subsequent RNA-sensing pathways (MDA5, RIG-I) leading to mRNA degradation and translation inhibition [28] | Knockdown/Inhibition: Deplete key innate immune sensors (e.g., STING, MDA5, IRF3/7). Greatest effect was seen in STING and MDA5 double-knockdown [28]. | [28] |
| Strong innate immune activation attenuating adaptive immunity | mRNA component triggering IFNAR-dependent signaling that can dampen subsequent CD8+ T cell and antibody responses [29] | Transient IFNAR blockade: Administer anti-IFNAR monoclonal antibodies 24hr pre- and post-immunization to enhance adaptive immune responses [29]. | [29] |
| In vitro data not translating to in vivo models | Missing drug clearance in vitro and species-specific differences in IFN signaling efficiency [76] | Use QSP Modeling: Employ Quantitative Systems Pharmacology models to simulate in vivo conditions and bridge the gap between in vitro and in vivo studies [76]. | [76] [77] |
| Age-dependent variability in experimental results | Rewired IFN signaling (STAT1 to STAT3) in cells from older donors [73] | Stratify by Age: Account for donor age as an experimental variable. Use age-matched controls and consider the inflammatory bias in cells from older donors [73]. | [73] |
Essential Experimental Protocols for IFN Pathway Modulation
Protocol 1: Transient Blockade of Type I IFN Signaling In Vivo
This protocol is adapted from a study demonstrating that blocking IFNAR signaling enhances LNP-mRNA vaccine immunogenicity [29].
- Objective: To transiently inhibit the type I interferon receptor to study its role in adaptive immune priming.
- Reagents: Anti-IFNAR monoclonal antibody (e.g., I-401-100, Leinco Technologies) or an appropriate isotype control.
- Procedure:
- Administer an intraperitoneal (IP) injection of the anti-IFNAR antibody (e.g., 2.5mg per mouse) 24 hours prior to immunization with the LNP-mRNA construct.
- Deliver a second IP injection of the antibody (e.g., 2.5mg per mouse) 24 hours after immunization.
- Proceed with the standard schedule for analyzing immune responses (e.g., antigen-specific T cells and antibodies).
- Key Readout: Increased frequencies of antigen-specific CD8+ T cells and elevated titers of antigen-specific antibodies in the anti-IFNAR treated group compared to the control [29].
Protocol 2: Targeting the cGAS-STING-IRF Axis to Improve Transfection Efficiency
This protocol is based on research identifying the interconnected DNA and RNA-sensing mechanisms that suppress transgene expression [28].
- Objective: To enhance transfection efficiency by inhibiting the innate immune sensors that suppress transgene expression.
- Reagents: siRNAs or chemical inhibitors targeting cGAS, STING, MDA5, RIG-I, or IRF3/7.
- Procedure:
- Culture the target cells (e.g., HEK293) according to standard protocols.
- Transfect the cells with siRNA targeting the genes of interest (e.g., STING, MDA5) to deplete their protein levels. The study found the most pronounced increase in transfection efficiency in the STING and MDA5 double-knockdown group [28].
- 24-48 hours post-siRNA transfection, perform the primary transfection with your DNA or mRNA construct of interest.
- Assess transfection efficiency via flow cytometry (for reporter genes) or quantify protein yield.
- Key Readout: Significant increase in the percentage of transfected cells and/or the amount of expressed transgene protein in the knockdown groups compared to non-targeting siRNA controls [28].
Visualizing Key Signaling Pathways
Diagram 1: IFN Response to Exogenous Nucleic Acids
This diagram illustrates the core cellular defense mechanisms activated by introduced mRNA and DNA, leading to interferon release and suppression of transgene expression.
Diagram 2: Age-Dependent Rewiring of IFN Signaling
This diagram shows the fundamental shift in interferon signaling that occurs with aging, from an antiviral to an inflammatory profile.
The Scientist's Toolkit: Key Research Reagents and Models
Table: Essential Reagents and Models for Studying IFN Response in mRNA Transfection
| Reagent / Model | Specific Example | Function / Application | Reference |
|---|---|---|---|
| IFNAR Blocking Antibody | Anti-IFNAR mAb (I-401-100, Leinco Technologies) | For transient blockade of type I IFN signaling in vivo to study its role in adaptive immunity. | [29] |
| siRNA for Innate Sensors | siRNAs targeting STING, MDA5, IRF3/7 | To knock down key innate immune receptors/transcription factors and improve transfection efficiency. | [28] |
| IFNAR-Deficient Mouse Model | IFNAR-/- mice (e.g., Jackson Laboratory #032045) | To study the functions of type I IFN signaling in a constitutive knockout model. | [29] |
| Reporter Mouse Model | Mx2Luc transgenic mouse strain | Enables in vivo bioluminescence imaging to monitor the IFN-induced Mx2 promoter activity as a biomarker for antiviral response. | [76] |
| Computational QSP Model | Mouse and Human IFN-α QSP Models | For cross-species comparison of IFN pharmacokinetics and pharmacodynamics, and to predict in vivo responses from in vitro data. | [76] [77] |
Technical Support Center: Troubleshooting Interferon Response in Repeated mRNA Transfections
Frequently Asked Questions (FAQs)
Q1: Our data shows a sharp decline in protein expression after the second mRNA transfection. What is the primary cause? A1: A primary cause is the activation of the innate immune system, specifically the induction of type I interferons (IFN) by the initial transfection [16]. This creates an antiviral state in the cells, characterized by upregulation of proteins like Protein Kinase R (PKR) which can inhibit the translation of mRNA from subsequent transfections [78].
Q2: What are the key sequence modifications that can reduce mRNA immunogenicity? A2: Key modifications include [78]:
- Nucleotide Modification: Incorporation of modified nucleotides like pseudouridine (Ψ) to help evade recognition by pattern recognition receptors (PRRs).
- 5' Cap Optimization: Using advanced cap analogs like CleanCap or Cap-1 structures, which reduce detection by RIG-I and IFIT1, thereby minimizing interferon signaling [78].
- UTR Engineering: Selecting 5' and 3' untranslated regions (UTRs) that are known to have low immunogenicity and high translational efficiency.
Q3: How can we experimentally monitor interferon response in our in vitro models? A3: You can employ several methods:
- qPCR: Measure the expression levels of interferon-stimulated genes (ISGs) such as MX1, OAS1, or IFIT1.
- ELISA: Quantify the secretion of interferon-beta (IFN-β) into the cell culture supernatant.
- Reporter Assays: Use cell lines stably transfected with an interferon-sensitive promoter (e.g., ISRE) driving a luciferase or GFP reporter gene.
Q4: Are there specific reagents that can be co-delivered with mRNA to boost expression in multi-dose regimens? A4: Yes. Small-molecule compounds known as "mRNA translation boosters" can be used [16]. These include:
- PKR Inhibitors: To prevent translational shutdown.
- IRF3/NF-κB Inhibitors: To block downstream interferon signaling pathways.
- Endosomal Escape Enhancers: To increase mRNA delivery efficiency and reduce endosomal TLR activation.
Q5: Why is the quality of mRNA critical for repeated transfections, and how is it assessed? A5: Impure mRNA preparations often contain double-stranded RNA (dsRNA) contaminants, which are potent inducers of interferon response [78]. Quality is assessed by:
- Spectrophotometry: An A260/A280 ratio between 1.8-2.1 indicates pure RNA [27].
- Gel Electrophoresis: To check for a single, intact band of the correct size and the absence of dsRNA smears [27].
Troubleshooting Guides
Problem: Low Protein Expression in Sequential Transfection
| Potential Cause | Verification Method | Recommended Solution |
|---|---|---|
| High IFN-β secretion from 1st transfection | ELISA of cell supernatant post-transfection. | Pre-treat cells with a low-dose interferon signaling inhibitor 2 hours before the second transfection [16]. |
| Suboptimal mRNA cap structure | Analyze mRNA preparation via LC-MS. | Use mRNAs synthesized with CleanCap or enzymatically capped to ensure >94% Cap-1 structure [78]. |
| Accumulation of dsRNA contaminants | HPLC or dsRNA-specific ELISA. | Implement high-performance liquid chromatography (HPLC) purification for mRNA to remove dsRNA impurities [78]. |
| Insufficient delivery efficiency | Use a fluorescently-labeled control mRNA and measure uptake via flow cytometry. | Optimize the lipid nanoparticle (LNP) formulation or transfection reagent ratio to enhance delivery for your specific cell type [26]. |
Problem: High Cell Toxicity Following Repeated Transfection
| Potential Cause | Verification Method | Recommended Solution |
|---|---|---|
| Excessive immune activation | Check for increased expression of ISGs (e.g., MX1) via qPCR. | Incorporate pseudouridine (Ψ) in the mRNA and ensure high purity to minimize PRR activation [78] [27]. |
| Reagent toxicity | Perform a cell viability assay with reagent alone (no mRNA). | Titrate the transfection reagent to the lowest effective dose or switch to a lower-toxicity polymer-based reagent [26]. |
| Poor cell health pre-transfection | Check cell confluency and passage number. | Use low-passage cells (5-20 passages) and ensure they are 70-90% confluent at the time of transfection [27]. |
| Impure mRNA preparation | Check A260/A280 ratio and run an agarose gel. | Repurify mRNA to ensure an A260/A280 ratio of 1.8-2.1 and no degradation [27]. |
The Scientist's Toolkit: Research Reagent Solutions
| Item | Function/Benefit |
|---|---|
| CleanCap AG Reagent | A co-transcriptional capping reagent that produces a Cap-1 structure, significantly reducing immunogenicity and boosting protein yield [78]. |
| Pseudouridine-5'-TP | A modified nucleotide for IVT mRNA synthesis. Incorporation into mRNA evades innate immune sensing, decreasing IFN response [78]. |
| Lipid Nanoparticles (LNPs) | A delivery system for encapsulating and protecting mRNA, facilitating endosomal escape, and improving cellular uptake [78]. |
| HPLC-Purified mRNA | The gold standard for mRNA purification, effectively removing immunostimulatory dsRNA contaminants [78]. |
| Interferon Signaling Inhibitors | Small molecules (e.g., PKR or IRF3 inhibitors) used as "translation boosters" to transiently suppress the IFN pathway in multi-dose studies [16]. |
| Anti-Human IFN-β ELISA Kit | For quantitatively measuring IFN-β protein levels in cell culture media to confirm and monitor interferon response. |
Experimental Protocol: Assessing and Mitigating Interferon Response in a Two-Dose mRNA Transfection Model
Objective: To evaluate the impact of consensus antigen mRNA, with and without immune-evasive modifications, on protein expression and interferon response over two sequential transfections.
Materials:
- Cell line of interest (e.g., HEK-293 or dendritic cells)
- Two mRNA constructs: unmodified (Control-mRNA) and modified with pseudouridine and CleanCap (Mod-mRNA)
- Optimized transfection reagent (e.g., lipid-based)
- qPCR reagents for ISGs (MX1, OAS1)
- IFN-β ELISA kit
- Flow cytometer or Western blot equipment for protein detection
Methodology:
- Day 0: Seed cells in multiple plates to achieve 70% confluency at transfection.
- Day 1: First Transfection.
- Transfert cells with three conditions:
- Condition A: Control-mRNA
- Condition B: Mod-mRNA
- Condition C: Mock Transfection (reagent only)
- Harvest supernatant and a subset of cells 24 hours post-transfection.
- Transfert cells with three conditions:
- Day 1: Analysis.
- Use supernatant from Step 2 for IFN-β ELISA.
- Use cells from Step 2 for RNA extraction and subsequent qPCR analysis of ISGs.
- Day 2: Second Transfection.
- On the remaining cells, perform a second transfection using the same mRNA construct as the first dose (i.e., Condition A gets Control-mRNA again, Condition B gets Mod-mRNA).
- Day 3: Final Analysis.
- 24 hours after the second transfection, harvest cells and supernatant.
- Analyze protein expression of the target antigen via flow cytometry or Western blot.
- Repeat IFN-β ELISA and qPCR for ISGs.
Expected Outcome: Cells transfected with Mod-mRNA should demonstrate significantly higher antigen expression and lower levels of IFN-β and ISGs after the second dose compared to cells receiving the Control-mRNA, demonstrating successful mitigation of the interferon response.
Signaling Pathways and Experimental Workflow
Innate Immune Sensing of Repeated mRNA Transfection
Strategy for Boosting Repeated Transfection
Bench to Bedside: Preclinical and Clinical Validation of Next-Generation mRNA Platforms
FAQs: Addressing Common Experimental Challenges
Q1: What are the key advantages and disadvantages of using IFNAR-KO mice over other immunodeficient models for viral pathogenesis studies?
IFNAR-KO mice possess a specific defect in the type I interferon (IFN) receptor, rendering them highly susceptible to a wide range of viruses while largely maintaining an intact adaptive immune system. A significant advantage is that these mice do not typically show overt abnormalities and are fertile, allowing for the maintenance of breeding colonies [79]. Their key benefit is the ability to study viruses that wild-type mice are resistant to, including many from the Flaviviridae, Filoviridae, and Arenaviridae families [79] [80]. A major disadvantage is their profoundly heightened susceptibility, which can lead to rapid, lethal disease that may not accurately reflect the more balanced host-pathogen interaction in immunocompetent hosts or humans. This can complicate the evaluation of therapeutics and vaccines [79].
Q2: My hACE2 transgenic mice show variable susceptibility to SARS-CoV-2 infection. What factors could be contributing to this?
Variability in hACE2 transgenic models is a common challenge and can be attributed to several factors:
- Promoter-driven expression patterns: Different promoters (e.g., K18, CAG, HFH4) lead to distinct spatial expression profiles of the hACE2 receptor. The K18 promoter, for instance, drives expression in epithelial cells, including those in the respiratory tract [81], while a CAG promoter can lead to more widespread expression, including the brain, liver, and kidney [82]. This affects viral tropism and disease presentation.
- Copy number and integration site: The level of hACE2 transgene expression is critical. Studies in hACE2-transgenic pigs have demonstrated a direct correlation between hACE2 mRNA levels and viral replication efficiency in vitro [83]. Low or variable expression can result in reduced susceptibility.
- Genetic background: The mouse strain (e.g., C57BL/6) onto which the transgene is bred can influence the overall immune response and disease outcomes [82] [84].
Q3: How does the choice of viral challenge dose impact the interpretation of vaccine efficacy studies in these models?
The challenge dose is a critical determinant. A high lethal dose can overwhelm even a potent immune response, making it difficult to differentiate between vaccine candidates. Conversely, a very low dose might not cause disease in controls, preventing assessment of efficacy. For example, in K18-hACE2 mice, infection with a dose of 10^4 PFU of a SARS-CoV-2 clinical isolate was established as a lethal challenge for vaccine studies [81]. Using a dose that invalidates a known effective treatment (like an anti-RBD antibody) can be a stringent test to uncover enhanced efficacy of a new candidate, such as a CD24-conjugated antibody [82]. The dose should be calibrated to produce a clear, measurable disease phenotype in control animals while allowing for the demonstration of protection in treated groups.
Q4: What are the essential validation steps for a newly generated conditional IFNAR-KO mouse model before an infection study?
Before initiating infection studies, rigorous validation is required:
- Genotype Confirmation: Verify the presence of the Cre recombinase and the floxed Ifnar alleles via PCR [84].
- Functional Knockout Validation: Confirm the absence of IFNAR protein or signaling in the target cell population (e.g., astrocytes, neurons). This can be done by stimulating cells with type I interferon and measuring the lack of phosphorylation of STAT proteins or the absence of induction of interferon-stimulated genes (ISGs) [84].
- Phenotypic Baseline Characterization: Compare uninfected conditional KO mice to wild-type littermates for any baseline differences in health, immune cell populations, or histology of relevant organs.
- Infection Pilot Study: Challenge a small cohort with a low dose of the pathogen of interest to confirm the expected heightened susceptibility phenotype, such as increased viral load and mortality, as seen in studies where IFNAR was deleted in neuroectodermal cells or astrocytes [84].
Troubleshooting Guides
Issue: Unexpected Survival or Lack of Disease Phenotype in IFNAR-KO Mice
| Possible Cause | Diagnostic Steps | Solution |
|---|---|---|
| Incorrect Genetic Background | Re-genotype the mouse line to confirm the knockout allele. | Ensure use of properly validated and genetically pure breeding stock [85]. |
| Sub-optimal Viral Inoculum | Titrate the viral stock on permissive cells to confirm infectious titer. Re-isolate virus from a reference stock to confirm pathogenicity. | Re-prepare the viral challenge stock, use a known positive control virus from a published study, and confirm the challenge dose and route (e.g., footpad, intranasal) [79]. |
| Inadequate Animal Monitoring | Review the timing of observation. Some models show rapid onset of symptoms and death within 3-4 days post-infection [79]. | Increase the frequency of monitoring post-challenge (e.g., twice daily) and use defined humane endpoints (e.g., >20% weight loss) [81] [82]. |
Issue: High Variability in Viral Load Measurements in hACE2 Transgenic Mice
| Possible Cause | Diagnostic Steps | Solution |
|---|---|---|
| Inconsistent Tissue Sampling | Standardize the dissection and collection protocol. The same lung lobe or intestinal segment should be sampled across all animals. | Create a detailed anatomical guide for sample collection and homogenize tissues in a consistent weight/volume ratio [82]. |
| Variable Transgene Expression | Measure hACE2 mRNA or protein levels in the target tissue (e.g., lung) from a sample of the cohort. | Use mice from a founder line with known high and stable hACE2 expression. For breeding, select animals with confirmed high transgene expression to establish a consistent colony [83]. |
| Non-uniform Infection | For intranasal inoculation, ensure proper anesthesia and a consistent technique for droplet administration. | Practice the inoculation procedure, use a calibrated micropipette, and allow the animal to fully inhale the dose before recovery [81] [82]. |
The table below summarizes key quantitative findings from challenge studies in IFNAR-KO and hACE2 transgenic mouse models.
Table 1: Quantitative Outcomes from Viral Challenge Studies in Murine Models
| Virus | Mouse Model | Challenge Dose & Route | Key Outcome Measures | Citation |
|---|---|---|---|---|
| West Nile Virus (WNV) | Ifnar-/- (129Sv/Ev) | 10² PFU, SC (footpad) | 100% mortality; Mean time to death: 3.8 ± 0.5 days; Symptoms by 3 dpi. | [79] |
| Dengue Virus (DENV-2) | Ifnar-/- (129Sv/Ev) | 10⁸ PFU, IV | 0% mortality; Virus detected in serum, liver, spleen, lymph nodes, and brain at 3 and 7 dpi. | [79] |
| SARS-CoV-2 | K18-hACE2 | 10⁴ PFU, IN | Lethal infection; Vaccination with RBD-cVLP induced sterilizing immunity and prevented weight loss/death. | [81] |
| SARS-CoV-2 | CAG-hACE2 (C57BL/6) | 3x10⁴ TCID₅₀, IN | High susceptibility, severe disease, lethality; Viral replication in respiratory system, small intestine, and brain. | [82] |
| TMEV | NesCre±IFNARfl/fl (CNS-specific KO) | 1.63x10⁶ PFU, IC | Lethal disease in most mice; Associated with unrestricted viral replication and elevated cytokine levels. | [84] |
Experimental Protocol: Assessing Susceptibility to SARS-CoV-2 in hACE2 Transgenic Mice
Objective: To determine the pathogenicity of a SARS-CoV-2 isolate and evaluate the efficacy of a candidate vaccine in a K18-hACE2 transgenic mouse model.
Materials:
- Mice: 8-12 week old male and female K18-hACE2 transgenic mice (e.g., B6.Cg-Tg(K18-ACE2)2Prlmn/J) [81].
- Virus: SARS-CoV-2 isolate (e.g., SARS-CoV-2/Leiden_008, GenBank MT705206.1) [81].
- Vaccine: Candidate immunogen (e.g., RBD-cVLP vaccine formulated with AddaVax adjuvant) [81].
- Cells: VeroE6 cells for virus titration.
Methodology:
- Vaccination:
- Randomize mice into control (PBS or vehicle) and vaccinated groups.
- Administer vaccine (e.g., 2 µg of RBD-cVLP in 50 µL PBS) via intramuscular (IM) injection.
- Prime and boost with a 2-week interval [81].
- Serum Collection:
- Collect blood via tail vein or other method at weeks 0 (pre-immune), 2, and 4.
- Isolate serum for binding antibody ELISA and neutralization assays.
- Viral Challenge:
- At 4 weeks post-prime, anesthetize mice with isoflurane.
- Infect intranasally (i.n.) with a pre-determined lethal dose of SARS-CoV-2 (e.g., 10^4 PFU in 50 µL DMEM) [81].
- Post-Challenge Monitoring:
- Sample Collection and Analysis:
- At designated endpoints, euthanize mice and collect tissues (lung, nasal turbinates, trachea, brain).
- Viral Titration: Homogenize tissues and determine viral load by plaque assay or TCID₅₀ on VeroE6 cells.
- Histopathology: Fix lung lobes in formalin, section, and stain with H&E to score inflammation and pathology [81].
Key Signaling Pathways and Experimental Workflows
Interferon Signaling Disruption in IFNAR-KO Models
hACE2 Transgenic Mouse Model Workflow
Research Reagent Solutions
Table 2: Essential Materials for IFN and hACE2 Model Research
| Reagent / Model | Key Function / Characteristic | Example & Specification |
|---|---|---|
| IFNAR1-KO Mouse | Lacks the alpha/beta interferon receptor subunit 1, enabling infection with viruses that are normally restricted by the IFN-I response. | C57BL/6NCya-Ifnar1em1/Cya; Deletion of exon 2 leads to functional receptor deficiency [85]. |
| K18-hACE2 Mouse | Expresses human ACE2 under the keratin 18 promoter, primarily in epithelial cells, conferring susceptibility to SARS-CoV-2 infection. | B6.Cg-Tg(K18-ACE2)2Prlmn/J; Develops severe, lethal respiratory and neurological disease upon infection [81]. |
| CAG-hACE2 Mouse | Expresses human ACE2 under a strong synthetic promoter, leading to widespread expression and high susceptibility. | C57BL/6 background; Shows viral replication in lung, intestine, and brain [82]. |
| Conditional IFNARfl/fl | Allows cell-type specific deletion of IFNAR when crossed with Cre-driver lines, enabling cell-specific role analysis. | Used with Nes-Cre (neuroectodermal), GFAP-Cre (astrocytes), Syn1-Cre (neurons) [84]. |
| SARS-CoV-2 Clinical Isolate | A genetically defined virus stock for challenge studies, reflecting authentic viral pathogenicity. | SARS-CoV-2/Leiden_008 (MT705206.1); Contains D614G spike mutation and other non-silent mutations [81]. |
| RBD-cVLP Vaccine | A capsid virus-like particle vaccine displaying the receptor-binding domain (RBD), highly immunogenic. | ABNCoV2/MOSDEN platform; Induces strong neutralizing antibodies and sterilizing immunity in mice [81]. |
Trans-amplifying (TA) mRNA is an advanced vaccine platform designed to overcome key limitations of both conventional mRNA and self-amplifying mRNA (saRNA) technologies. This innovative system separates the genetic components of the vaccine into two distinct mRNA strands: one encoding the replicase enzyme (derived from the Venezuelan equine encephalitis virus (VEEV)) and a separate strand encoding the antigen of interest (e.g., a consensus spike protein) [86] [87]. This separation creates a modular system where the replicase can amplify the antigen-encoding mRNA inside host cells, leading to robust and sustained antigen production while requiring significantly lower doses of the antigen-encoding component [86].
Recent preclinical studies demonstrate the remarkable dose-sparing potential of this technology. Mice receiving a TA mRNA vaccine encoding a consensus SARS-CoV-2 spike protein produced neutralizing antibody levels comparable to a conventional mRNA vaccine while using 40 times less antigen-encoding mRNA [86] [88]. The vaccine also reduced lung viral titers by over 10-fold in hACE2 transgenic mice challenged with the Omicron BA.1 variant and induced broadly cross-neutralizing antibodies against multiple variants [86]. These findings occur within the broader research context of overcoming interferon response in repeated mRNA transfections, as the modular design of TA mRNA systems offers unique advantages in managing innate immune recognition.
Technical Support & Troubleshooting Guide
Common Experimental Challenges and Solutions
Problem: Low Transfection Efficiency or Protein Expression
- Potential Cause and Solution 1: Suboptimal ratio between replicase mRNA and antigen-encoding mRNA.
- Troubleshooting: Perform a titration experiment to determine the optimal ratio. Co-transfect cells with a constant amount of antigen-mRNA while varying the amount of replicase mRNA [86].
- Potential Cause and Solution 2: Poor quality of transfecting mRNA.
- Potential Cause and Solution 3: High cytotoxicity from transfection reagents.
Problem: Inconsistent In Vivo Immunogenicity
- Potential Cause and Solution 1: Unoptimized mRNA formulation and delivery.
- Potential Cause and Solution 2: Inadequate innate immune evasion leading to reduced protein translation.
Problem: Activation of Interferon (IFN) Response
- Potential Cause and Solution 1: Unmodified mRNA sequences triggering pathogen recognition receptors.
- Potential Cause and Solution 2: Double-stranded RNA (dsRNA) byproducts formed during amplification.
- Troubleshooting: The modular TA system allows for independent codon optimization of the two mRNA components. Optimize codons to minimize the formation of secondary structures that could be recognized as dsRNA [86]. Note that small molecule inhibitors of IFN have shown limited success in enhancing mRNA transfection and are not a recommended primary strategy [10].
Frequently Asked Questions (FAQs)
Q1: What is the core difference between self-amplifying (saRNA) and trans-amplifying (TA) mRNA vaccines? A1: The key difference lies in the configuration of the genetic material. saRNA delivers the replicase and the antigen gene on a single, long mRNA molecule. In contrast, TA mRNA delivers two separate, shorter strands: one for the replicase and another for the antigen [86] [87]. This separation offers superior manufacturing flexibility and the ability to selectively modify the nucleosides in the replicase mRNA.
Q2: Why is the TA mRNA system considered advantageous for managing interferon responses? A2: The two-component design provides unique flexibility. Researchers can selectively incorporate stability-enhancing and immune-silencing modifications (like pseudouridine) into the replicase mRNA without inhibiting its function—a limitation in saRNA where the replicase and antigen are fused [86] [62]. This leads to more efficient translation and less innate immune activation, a critical consideration in research on repeated transfections.
Q3: How do I validate that the TA mRNA system is functioning correctly in my in vitro experiments? A3: A standard method is to use a reporter gene. Transfert cells with the replicase mRNA and an antigen mRNA encoding a quantifiable protein like nano-luciferase. A significant increase in luciferase output (e.g., a log2 fold increase of 1.62 ± 0.08) in co-transfected cells versus those receiving the reporter mRNA alone confirms successful amplification [86]. Western blot analysis for the antigen protein (e.g., consensus spike at 180 kDa) and the replicase (e.g., VEEV replicase at 53 kDa) further validates the system [86].
Q4: What are critical factors for successful co-transfection of the two mRNA components? A4:
- Ratio Optimization: The molar ratio of replicase mRNA to antigen mRNA is critical and must be determined empirically [86].
- Reagent Choice: Use transfection reagents capable of efficiently co-delivering multiple RNA molecules. Ensure the reagent is suitable for mRNA delivery, as some are optimized only for DNA [89].
- mRNA Quality: Both mRNAs must be of high purity and integrity. Confirm the absence of RNA degradation by checking RNA quality post-isolation [91].
Experimental Data & Protocols
Key Quantitative Findings from Preclinical Studies
Table 1: Summary of Key Efficacy Metrics for TA mRNA Vaccines
| Metric | Result | Experimental Model | Comparison to Conventional mRNA |
|---|---|---|---|
| Dose-Sparing Effect | Achieved comparable neutralization using 40-fold less antigen-encoding mRNA [86] [88] | Mouse immunization model | Direct, side-by-side comparison |
| Viral Challenge | Reduced lung viral titers by >10-fold [86] | hACE2 transgenic mice challenged with Omicron BA.1 | Not specified |
| Immune Breadth | Induced broadly cross-neutralizing antibodies against multiple variants [86] | Serum analysis post-immunization | Demonstrated broader neutralization |
| Projected Dose-Sparing | Potential for up to 100 times less antigen-encoded RNA per dose [87] | Platform assessment (CEPI) | Theoretical maximum based on platform features |
Detailed Protocol: In Vitro Validation of TA mRNA Function
This protocol outlines the steps to confirm the functionality of a TA mRNA system using a luciferase reporter, as described in the foundational research [86].
Objective: To validate the design of TA mRNA constructs by demonstrating enhanced protein expression via replicase-mediated amplification.
Materials:
- TA mRNA constructs: (1) mRNA encoding VEEV replicase, (2) mRNA encoding nano-luciferase (as the gene of interest).
- Appropriate cell line (e.g., 293T or A549 cells).
- Transfection reagent optimized for mRNA (e.g., TransIT-mRNA).
- Opti-MEM I Reduced-Serum Medium.
- Luciferase assay kit and luminometer.
- Lysis buffer for Western blot (if performing).
- Antibodies for replicase and antigen detection.
Method:
- Cell Seeding: Seed cells in a multi-well plate to reach 80-90% confluency at the time of transfection.
- Complex Formation:
- Prepare two main transfection mixtures in separate tubes using Opti-MEM:
- Test Group: Replicase mRNA + nano-luciferase mRNA.
- Control Group: Nano-luciferase mRNA alone.
- Add the transfection reagent to each tube at the manufacturer's recommended ratio (e.g., 3:1 reagent-to-RNA ratio) and incubate to form complexes.
- Prepare two main transfection mixtures in separate tubes using Opti-MEM:
- Transfection: Add the complexes to the cells. Maintain the cells in complete culture medium.
- Incubation and Harvest: Incubate cells for a predetermined period (e.g., 4-48 hours). For a time course, harvest cell lysates at multiple time points (e.g., 4h, 24h, 48h).
- Analysis:
- Luciferase Assay: Measure the luciferase activity in the cell lysates using a luminometer. A statistically significant increase (e.g., p=0.0033, t-test) in the test group versus the control confirms successful amplification [86].
- Western Blot (Optional): Analyze lysates to detect the expression of the replicase protein (~53 kDa for VEEV) and the full-length or cleaved antigen [86].
Signaling Pathways and Workflows
Diagram 1: Intracellular Mechanism of a Trans-Amplifying mRNA Vaccine. The vaccine delivers two mRNA strands via LNPs. After endosomal escape, the replicase mRNA is translated, and the enzyme then amplifies the separate antigen-encoding mRNA. This cycle leads to sustained, high-level antigen production from a minimal initial dose, driving a potent immune response.
The Scientist's Toolkit: Essential Research Reagents
Table 2: Key Reagents for TA mRNA Vaccine Research
| Reagent / Material | Critical Function | Application Notes |
|---|---|---|
| VEEV Replicase mRNA | Engineers the amplification machinery within the cell. Must be co-delivered with the antigen mRNA. | Can be nucleoside-modified to enhance translation and reduce immune activation [86]. |
| Antigen-Encoding mRNA | Contains the gene for the target immunogen (e.g., consensus spike protein). The component whose dose is spared. | Designed with consensus sequences for broad protection. Can be modified independently of the replicase [86]. |
| Lipid Nanoparticles (LNPs) | Delivery system to protect mRNA and facilitate cellular uptake in vitro and in vivo. | Formulation must be optimized for co-encapsulating and delivering two different mRNA strands [87] [92]. |
| Transfection Reagents | For in vitro delivery of mRNA into cells to test system functionality. | Choose reagents validated for mRNA and compatible with your cell type (e.g., TransIT-mRNA) [89]. |
| Consensus Spike Antigen | A designed immunogen that incorporates conserved amino acids across variants to elicit broad immunity. | In the cited study, it included stabilizing proline mutations (e.g., K986P, V987P) to maintain the pre-fusion conformation [86]. |
The table below synthesizes key quantitative findings from a systematic review of prospective therapeutic anti-cancer vaccine trials for hematological malignancies, providing a landscape overview of clinical efficacy and endpoint achievement [93].
Table 1: Clinical Endpoint Achievement in Hematological Malignancy Vaccine Trials
| Metric | Result |
|---|---|
| Total Included Prospective Studies | 187 |
| Median Sample Size (IQR) | 18 (IQR = 20) |
| Studies with a Randomized Design | 33/187 (18%) |
| Primary Endpoint: Translational/Immunogenicity | Met in 65/81 (80%) of studies |
| Primary Endpoint: Safety | Met in 51/74 (69%) of studies |
| Primary Endpoint: Clinical Efficacy (PFS, OS, etc.) | Met in 11/35 (31%) of studies |
| Improvement in Overall Survival (OS) | 0 instances in randomized trials |
The data demonstrates that while most trials successfully meet translational and safety goals, a significant efficacy gap exists when clinical endpoints are assessed [93].
Troubleshooting Guides & FAQs
FAQ 1: How can we mitigate innate immune responses triggered by repeated mRNA vaccine administration?
Challenge: Repeated transfections with mRNA-based vaccines can trigger undesirable interferon (IFN) responses, leading to increased mRNA degradation, reduced translation efficiency, and potential heightened reactogenicity.
Solutions:
- Nucleotide Modification: Utilize modified nucleotides (e.g., pseudouridine) during in vitro transcription to reduce activation of pattern recognition receptors (PRRs) like Toll-like receptors (TLRs) [15].
- mRNA Translation Boosters: Co-deliver small-molecule or macromolecular adjuvant drugs that act as "mRNA translation boosters." These compounds can block PRRs, modulate inflammatory cascades, and facilitate endosomal escape, thereby improving protein yield and reducing immunogenicity [16].
- Purification: Implement high-performance liquid chromatography (HPLC) purification to remove double-stranded RNA (dsRNA) contaminants, a major trigger of IFN pathways.
- Sequence Engineering: Optimize coding and untranslated regions (UTRs) to avoid specific sequence motifs that potently activate innate immunity.
- Circular RNA (circRNA) Exploration: Investigate the use of synthetic circRNAs. Their covalently closed structure lacks ends that are recognized by exonucleases and certain PRRs (e.g., RIG-I), conferring greater stability and reduced immunogenicity without requiring nucleotide modification [15].
FAQ 2: What are the critical parameters to characterize our mRNA-LNP formulation for a multi-dose trial?
Challenge: Inconsistent particle characteristics between batches can lead to variable performance, immunogenicity, and tolerability in a multi-dose regimen.
Solutions & Key Tests:
- Particle Size & Distribution: Analyze using Dynamic Light Scattering (DLS). The size distribution (PDI) should be narrow to ensure consistent biodistribution and cellular uptake [94].
- Zeta Potential (ZP): Measure surface charge using DLS. This influences particle stability, cellular interactions, and potential toxicity.
- Encapsulation Efficiency: Quantify using the Quant-iT RiboGreen assay. Compare fluorescence readings with and without a destabilizing detergent (e.g., Triton X-100). High encapsulation (>90%) is crucial for protecting mRNA and reducing nonspecific immune activation [94].
- mRNA Integrity/Purity: Assess via capillary electrophoresis or gel analysis to ensure the mRNA is intact and free of degradation products.
FAQ 3: Our vaccine shows immunogenicity in preclinical models but not in the clinic. What could be the cause?
Challenge: A common disconnect exists between demonstrated immunogenicity in animal models and a lack of clinical efficacy in human trials.
Potential Causes & Investigations:
- Immunosuppressive Tumor Microenvironment (TME): The human TME may be more profoundly immunosuppressive, neutralizing the vaccine-induced T-cells. Consider combination therapies or vaccines that directly target the TME. A recent mRNA-LNP vaccine targeting multiple immunosuppressive factors (CCL22, TGF-β, CTLA-4, etc.) showed promise in a spontaneous canine model by reprogramming the TME [94].
- Insufficient T-cell Priming or Persistence: Ensure your vaccine platform and regimen are optimized to generate a robust, durable, and functional T-cell response, not just a transient one.
- Trial Population and Endpoint Selection: Many early-phase trials are small (median n=18) and use translational endpoints as primary outcomes. Clinical efficacy is less frequently achieved, highlighting a need for larger trials powered for clinical endpoints [93].
Detailed Experimental Protocols
Protocol 1: mRNA-Lipid Nanoparticle (LNP) Formulation and Characterization
This protocol is adapted from a study demonstrating an immunomodulatory mRNA-LNP vaccine [94].
I. mRNA Synthesis and Preparation
- Plasmid Template: Use a linearized plasmid DNA template (e.g., pUC57) containing the gene of interest under a T7 promoter and a poly(A) tail sequence.
- In Vitro Transcription (IVT):
- Use the MEGAscript T7 Transcription Kit with a modified protocol.
- Include the trinucleotide cap1 analog CleanCap for 5' capping co-transcriptionally.
- Incubate the reaction for 6 hours.
- Purification: Precipitate the transcribed mRNA using Lithium Chloride (LiCl). Dissolve the pellet in nuclease-free water.
- Quality Control: Determine concentration via nanodrop and assess purity using capillary electrophoresis.
II. LNP Formulation via Microfluidics
- Lipid Preparation: Dissolve lipids at a molar ratio of 50:10:38.5:1.5 (ionizable lipid: DSPC: Cholesterol: DMG-PEG2000) in ethanol.
- mRNA Preparation: Dilute mRNA in 20 mM sodium acetate buffer, pH 5.5, to a concentration of 0.1 mg/mL.
- Mixing: Use a microfluidic device. Mix the lipid (organic) and mRNA (aqueous) solutions at a total flow rate of 12 mL/min with a 3:1 ratio (aqueous:organic). This controls the self-assembly of LNPs.
- Dialysis: Dialyze the formulated mRNA-LNP against a large volume of 20 mM Tris-HCl buffer, pH 7.4, using a 3.5 kDa MWCO dialysis cassette to remove ethanol and exchange the buffer.
- Final Formulation: Adjust the final concentration with 10% sucrose (w/v) as a cryoprotectant, then aliquot and store at -80°C.
III. LNP Characterization
- Encapsulation Efficiency:
- Use the Quant-iT RiboGreen RNA assay.
- Prepare two sets of samples: one with Tris-HCl buffer (A) and another with Tris-HCl buffer containing 0.1% Triton X-100 (B).
- Add the RiboGreen dye to both and measure fluorescence (λex/em = 485/528 nm).
- Calculate encapsulation: %EE = [1 - (Fluorescence A / Fluorescence B)] * 100.
- Size and Zeta Potential: Analyze the final mRNA-LNP preparation diluted in PBS using Dynamic Light Scattering (DLS) to determine hydrodynamic diameter, polydispersity index (PDI), and zeta potential.
Protocol 2: Evaluating Immunogenicity and Interferon ResponseIn Vivo
I. Animal Vaccination and Sampling
- Study Design: Use appropriate animal models (e.g., murine models or spontaneous canine cancer models [94]). Include groups for multi-dose regimens (e.g., prime-boost schedules).
- Administration: Administer the mRNA-LNP vaccine via a clinically relevant route (e.g., subcutaneous).
- Blood Collection: Collect serum/plasma at multiple time points post-injection (e.g., 6, 24, 48 hours) to monitor kinetic immune responses.
II. Analysis of Innate Immune Activation
- Cytokine Profiling:
- Analyze serum/plasma using ELISA or multiplex immunoassays.
- Key targets: Type I Interferons (IFN-α, IFN-β) and inflammatory cytokines (IL-6, TNF-α).
- Elevated levels indicate activation of the innate immune system.
- Protein Expression Analysis:
- Assess the expression level of the vaccine-encoded antigen (e.g., via Western Blot or flow cytometry of transfected cells ex vivo) at 24-48 hours.
- High IFN levels often correlate with reduced antigen expression, as IFN signaling can globally inhibit cellular translation.
Signaling Pathways and Workflows
Interferon Induction Pathway
Mitigation Strategy Workflow
The Scientist's Toolkit: Research Reagent Solutions
Table 2: Essential Materials for mRNA Cancer Vaccine Development
| Item / Reagent | Function / Explanation |
|---|---|
| Ionizable Lipid (e.g., SM102) | The key component of LNPs that enables encapsulation, endosomal escape, and mRNA release into the cytoplasm. Its positive charge at low pH facilitates membrane fusion [94]. |
| CleanCap Cap Analog | Used in co-transcriptional capping to produce a 5' Cap1 structure, which is essential for efficient translation initiation and reduces recognition by innate immune sensors [94]. |
| Microfluidic Device | Enables reproducible, rapid mixing of lipid and aqueous phases to form homogeneous, stable mRNA-LNPs with high encapsulation efficiency and controlled size [94]. |
| Quant-iT RiboGreen Assay | A sensitive fluorescence-based assay used to accurately determine the percentage of mRNA encapsulated within LNPs versus free mRNA, a critical quality attribute [94]. |
| mRNA Translation Boosters | A class of small-molecule or macromolecular adjuvants that improve translational fidelity and protein yield by mechanisms such as blocking PRRs or facilitating endosomal escape [16]. |
| Dynamic Light Scattering (DLS) Instrument | Used to characterize the hydrodynamic diameter, polydispersity (uniformity), and zeta potential (surface charge) of nanoparticle formulations [94]. |
This section provides a high-level comparison of the three major RNA platforms and addresses the most common challenges researchers face when working with them.
Table 1: Core Platform Characteristics and Common Challenges
| Platform Feature | Nucleoside-Modified mRNA | Self-Amplifying RNA (saRNA) | Circular RNA (circRNA) |
|---|---|---|---|
| Basic Definition | Synthetic, non-replicating mRNA with modified nucleosides (e.g., N1-methylpseudouridine, pseudouridine) to reduce immunogenicity [95] [96]. | Derived from alphavirus genomes; retains viral replication machinery but replaces structural genes with antigen of interest [62] [97]. | Covalently closed, single-stranded RNA molecule with no 5' cap or 3' poly(A) tail [25] [98]. |
| Primary Advantage | Reduced innate immune recognition, enabling high translational fidelity for protein production [25] [95]. | High and prolonged antigen expression from a lower dose due to intracellular amplification [62] [96]. | Exceptional biochemical stability and extended half-life due to resistance to exonuclease degradation [25] [98]. |
| Key Challenge | Transient expression window may be insufficient for some therapeutic applications [25]. | Innate immune activation and reactogenicity due to double-stranded RNA replication intermediates [62] [96]. | Relatively early-stage technology; efficient and specific delivery remains a significant hurdle [25] [98]. |
| Impact on Interferon Response | Minimized but not eliminated; repeated transfections can still trigger a detectable response. | Can be potent; the replicase complex and dsRNA intermediates are strong inducers of innate immunity [62]. | Inherently low immunogenicity; its closed structure avoids recognition by many innate immune sensors [98]. |
Frequently Asked Questions (FAQs)
Q1: For my repeated transfections, which platform is least likely to establish a refractory state due to interferon (IFN) signaling? While nucleoside-modified mRNA is designed to be stealthy, circRNA currently holds the most promise for repeated dosing. Its covalently closed structure confers high stability and significantly lower immunogenicity, potentially allowing for persistent expression without triggering a robust IFN response that would shut down subsequent translation [98]. saRNA, by contrast, is a potent IFN inducer, and nucleoside-modified mRNA can still activate pathways upon repeated administration.
Q2: I am seeing poor protein expression with my saRNA construct. What is the first thing I should check? The most common issue is innate immune activation aborting translation. First, verify the sequence and functionality of the replicase genes (nsP1-4) and ensure the subgenomic promoter is correctly placed to drive your gene of interest [62]. High IFN levels can halt replication, so measuring IFN-beta in your supernatant can be a key diagnostic.
Q3: My circRNA translation efficiency is low. How can I improve it? Unlike linear mRNA, circRNA translation relies on Internal Ribosome Entry Site (IRES) elements. Ensure your IRES is highly active in your target cell type. Optimization of the circularization junction and the sequence flanking the IRES is also critical for efficient ribosome loading and initiation [25] [98].
Troubleshooting Interferon Response in Repeated Transfections
A central challenge in mRNA research is managing the innate immune response, which is particularly critical for experiments involving repeated transfections. Below is a logical workflow for diagnosing and mitigating interferon-related issues.
Diagnostic Protocol: Confirming Interferon Pathway Activation
Objective: To quantitatively assess the activation of the innate immune system in your cell culture model following single and repeated RNA transfections.
Materials:
- qPCR system and reagents
- Primers for human/mouse IFNB1, MX1, OAS1
- Housekeeping gene primers (e.g., GAPDH, HPRT1)
- RNA extraction kit
- Cell culture system and transfection reagents
Method:
- Experimental Groups: Set up the following conditions in a 24-well plate:
- Group 1: Untransfected cells (baseline control).
- Group 2: Cells transfected with empty LNP or buffer (vehicle control).
- Group 3: Cells transfected with your nucleoside-modified mRNA construct.
- Group 4: Cells transfected with your saRNA construct.
- Group 5: Cells subjected to a second transfection (repeat of Group 3 or 4) 24-48 hours after the first.
- Time Point: Harvest total RNA from all groups 6-8 hours post-final transfection. This time point is optimal for capturing peak IFN and ISG mRNA induction.
- RNA Extraction & qRT-PCR: Extract total RNA according to your kit's protocol. Synthesize cDNA and perform qPCR using your primer sets for interferon-stimulated genes (ISGs) like MX1 and OAS1, and for IFNB1 itself.
- Data Analysis: Calculate fold-change in gene expression for each group relative to the untransfected control (Group 1) using the 2^(-ΔΔCt) method. A significant increase (e.g., >10-fold) in ISGs in the repeatedly transfected group (Group 5) confirms a compounded interferon response.
Frequently Asked Questions (FAQs)
Q4: After confirming a strong IFN response, what are my best options for mitigation? Your strategy depends on your platform:
- For Nucleoside-Modified mRNA: Implement HPLC purification to remove double-stranded RNA (dsRNA) impurities, a major contaminant that triggers IFN [95]. Also, ensure you are using the most effective nucleoside modifications (e.g., N1-methylpseudouridine).
- For saRNA: The response is often intrinsic. Consider lowering the dose or increasing the interval between transfections. For critical experiments, using small-molecule inhibitors of key IFN pathway nodes (e.g., JAK inhibitors) can be explored, but with appropriate controls for their potential effects on your phenotype.
- Platform Switch: If flexibility exists, transitioning to a circRNA construct can circumvent these issues due to its low immunogenicity and sustained expression, reducing the need for frequent re-transfection [98].
Q5: How does the type of cell I'm using affect the IFN response? Immune cells (e.g., macrophages, dendritic cells) are professional IFN producers and are exquisitely sensitive to RNA, often responding more robustly than standard cell lines (e.g., HEK-293, HeLa). Always characterize the IFN response in your specific primary cell or cell line of interest, as baseline levels of pathogen recognition receptors (PRRs) like RIG-I and MDA5 vary significantly.
This section lists key reagents and tools essential for developing and troubleshooting experiments with these RNA platforms.
Table 2: Key Research Reagent Solutions
| Reagent / Tool | Function & Utility | Key Considerations for Interferon Response |
|---|---|---|
| N1-methylpseudouridine (m1Ψ) | Modified nucleoside for IVT; reduces innate immune activation and enhances translation efficiency of mRNA [95]. | Critical for minimizing RIG-I recognition. Superior to pseudouridine for some applications. Essential for all platforms to reduce dsRNA byproducts. |
| HPLC Purification | Purification method for IVT RNA to remove aberrant transcripts and double-stranded RNA (dsRNA) impurities [95]. | Removal of dsRNA contaminants is one of the most effective steps to reduce IFN induction. |
| Cap 1 Structure | 5' cap structure (m7GpppNmN) added co-transcriptionally or enzymatically post-IVT. | Essential for evading detection by the innate immune sensor RIG-I, which recognizes uncapped or Cap 0 RNA [95]. |
| IRES Elements | Internal Ribosome Entry Site; drives cap-independent translation initiation, required for circRNA and often used in saRNA [25] [98]. | IRES activity is cell-type dependent. Testing multiple IRESs is crucial for achieving high circRNA translation. |
| Lipid Nanoparticles (LNPs) | The dominant delivery system for in vivo RNA delivery; encapsulates and protects RNA, facilitating cellular uptake and endosomal escape [25] [99]. | LNP composition itself can be immunogenic. The ionizable lipid can influence reactogenicity and potency, impacting experimental outcomes. |
| siRNA Design Algorithms (e.g., BLOCK-iT, IDT) | In silico tools for designing highly specific and effective siRNAs, minimizing off-target effects [99]. | Poorly designed siRNAs can activate the IFN pathway (e.g., via PKR). These tools help ensure specificity and reduce false positives in experiments involving RNAi. |
Frequently Asked Questions (FAQs)
Q6: I have purified my mRNA via HPLC, but I'm still detecting an IFN response. What else could be the cause? Even with purification, the primary sequence of the RNA itself can form complex secondary structures that are recognized by innate immune sensors like PKR or OAS. Use in-silico folding tools (e.g., mFold, RNAfold) to predict secondary structure. Re-codon optimize your sequence to avoid GC-rich regions and long stretches of perfect symmetry that can form stable dsRNA regions internally. Furthermore, confirm that your LNP formulation is not contributing to the immune activation.
Q7: Are there specific controls I should include when testing these platforms for IFN response? Yes, a robust experimental design is crucial. Key controls include:
- Positive Control for IFN Induction: Transfect a known ligand, such as high-molecular-weight poly(I:C).
- Negative Control for Transfection: Use an LNP formulation loaded with a non-immunogenic, nucleoside-modified non-coding RNA.
- Benchmarking Control: Compare your novel construct against a well-characterized standard, like the commercially available SARS-CoV-2 mRNA vaccine sequence.
While mRNA vaccines have revolutionized immunology, the true potential of mRNA and gene-editing technologies extends far into the realm of therapeutic protein replacement and precise genetic corrections. A significant barrier to the repeated administration required for many therapies is the innate immune system's interferon (IFN) response, which can degrade therapeutic RNA and inhibit protein translation. This technical support center provides targeted guidance for researchers navigating these challenges, offering proven strategies to suppress IFN activation and enhance therapeutic efficacy.
Troubleshooting Guides & FAQs
Why does transfection efficiency drop significantly after repeated administrations in my mammalian cell lines, and how can I mitigate this?
Root Cause: The cyclic GMP-AMP synthase (cGAS)-stimulator of interferon genes (STING) pathway senses foreign DNA and initiates a potent innate immune response. This activation leads to the upregulation of interferon regulatory factors (IRF3/7), which in turn activate downstream RNA-sensing pathways (e.g., MDA5, RIG-I), OAS family genes (promoting mRNA degradation), and IFIT family genes (inhibiting translation) [28].
Solutions:
- Genetic Knockdown: Co-depletion of STING and MDA5 has been shown to yield the most significant increase in transfection efficiency [28].
- Experimental Validation: In the cited study, researchers used siRNA or CRISPR-based methods to knock down target genes. Transfection efficiency was quantified using flow cytometry for a reporter gene (e.g., GFP) and by measuring protein yield via ELISA [28].
How can I reduce the innate immune response triggered by self-amplifying RNA (saRNA) to improve its potency?
Root Cause: saRNA is highly potent at triggering an early interferon response upon cellular entry, leading to its degradation and translational inhibition [100].
Solutions:
- Nucleotide Modification: Complete substitution of standard nucleotides with modified nucleotides (modNTPs), such as N1-methylpseudouridine (N1mΨ), can confer immune evasion [100].
- Experimental Protocol:
- Synthesis: Perform in vitro transcription (IVT) of saRNA using a nucleotide mix where 100% of uridine is replaced with N1mΨ.
- Delivery: Transfert cells (e.g., difficult-to-transfect cell types or PBMCs) with the modified saRNA.
- Validation: Assess interferon levels via ELISA (e.g., IFN-β) and measure expression of the encoded antigen [100].
What is a practical method to block the interferon signaling pathway during long-term mRNA transfections?
Root Cause: Repeated transfections lead to the secretion of type I interferons (IFNα/β), which bind to interferon receptors in an autocrine/paracrine manner, activating JAK-STAT signaling and upregulating interferon-stimulated genes (ISGs) that create an antiviral state [101].
Solutions:
- Co-delivery of Inhibitor mRNA: Simultaneously deliver mRNA encoding the vaccinia virus-derived B18R protein, a soluble high-affinity inhibitor of type I IFNs [101].
- Experimental Workflow:
- mRNA Preparation: Synthesize modified mRNA (using ARCA cap, m5C, and Ψ) for both your protein of interest (e.g., eGFP) and B18R.
- Co-transfection: Transfect cells with both mRNAs over the required duration (e.g., 7 days).
- Analysis: Monitor cell viability (e.g., via MTT assay), measure protein expression, and quantify ISG expression (e.g., Mx1) via qRT-PCR to confirm reduction of IFN response [101].
Table 1: Strategies for Mitigating Interferon Response in Nucleic Acid Therapies
| Strategy | Key Reagent / Method | Primary Mechanism | Reported Efficacy |
|---|---|---|---|
| Innate Immune Pathway Knockdown [28] | siRNA/CRISPR vs. STING & MDA5 | Blocks DNA & RNA sensing pathways | "Most pronounced" increase in transfection efficiency |
| Nucleotide Modification [100] | 100% N1-methylpseudouridine (N1mΨ) substitution | Evades detection by cytoplasmic PRRs | >8-fold reduction in IFN production; ~10x enhanced potency in difficult cells |
| Soluble IFN Receptor [101] | Co-delivery of B18R encoding mRNA | Binds and neutralizes extracellular IFNα/β | Significantly improved cell viability & sustained protein expression over 7-day repeated transfections |
The Scientist's Toolkit: Research Reagent Solutions
Table 2: Essential Reagents for Overcoming Interferon Response
| Reagent / Material | Function / Application | Key Feature / Consideration |
|---|---|---|
| N1-methylpseudouridine (N1mΨ) [100] | Modified nucleotide for IVT; reduces immunogenicity of saRNA and mRNA. | Replaces 100% of uridine to suppress early interferon response. |
| B18R Protein / Encoding mRNA [101] | Recombinant protein or mRNA that functions as a soluble type I IFN receptor. | Blocks autocrine/paracrine IFN signaling; crucial for long-term experiments. |
| Anti-reverse cap analog (ARCA) [101] | Cap analog for IVT; ensures proper 5' cap orientation. | Enhances mRNA stability and translation; reduces immune activation. |
| CleanCap AG [78] | Co-transcriptional capping system (Trinucleotide Cap Analog). | Achieves >94% Cap-1 structure; minimizes RIG-I and IFIT1 recognition. |
| Lipid Nanoparticles (LNPs) [102] | Leading delivery system for mRNA/saRNA in vivo. | Protects RNA, facilitates cellular uptake; composition can influence immunogenicity. |
Experimental Protocols & Data Analysis
Detailed Protocol: Co-transfection with B18R mRNA for Sustained Expression
This protocol is adapted from a study demonstrating reduced IFN-response cell death over a 7-day transfection period [101].
Materials:
- Cells: BJ human foreskin fibroblasts (or your relevant cell line).
- mRNAs: In vitro transcribed (IVT) mRNA for:
- Protein of Interest: e.g., eGFP mRNA (with ARCA cap, m5C, Ψ).
- B18R: IVT mRNA encoding the B18R protein (with ARCA cap, m5C, Ψ).
- Transfection Reagent: A suitable transfection reagent for your cell type.
Method:
- Cell Seeding: Seed 1 × 10^5 fibroblasts per well of a 6-well plate and incubate overnight.
- mRNA Complex Formation:
- For the test condition, prepare a mix containing both eGFP mRNA and B18R mRNA.
- For the control condition, prepare a mix with eGFP mRNA only.
- Complex the mRNAs with the transfection reagent according to the manufacturer's instructions.
- Transfection: Add the complexes to the cells. Repeat the transfection every 24-48 hours as required for your long-term expression protocol.
- Analysis:
- Cell Viability: Assess daily using a viability assay (e.g., Trypan Blue exclusion or MTT assay).
- Protein Expression: Quantify eGFP expression via flow cytometry or fluorescence microscopy.
- IFN Response: Measure the expression level of the interferon-stimulated gene Mx1 using qRT-PCR.
Key Signaling Pathways & Workflows
Interferon Response to Foreign Nucleic Acids
This diagram visualizes the interconnected DNA and RNA sensing pathways that trigger the interferon response, a major hurdle in gene therapy and transfection, and highlights key intervention points [28] [48] [101].
Workflow for Evaluating Interferon Suppression Strategies
This diagram outlines a general experimental workflow for testing the efficacy of different interferon suppression methods in cell culture [28] [100] [101].
Table 3: Quantitative Data from Key Studies on Interferon Suppression
| Experimental Approach | Key Measured Outcome | Result vs. Control | Citation |
|---|---|---|---|
| STING & MDA5 double-knockdown | Transfection efficiency | "Most pronounced" increase | [28] |
| 100% N1mΨ modified saRNA | Interferon production in PBMCs | >8-fold reduction | [100] |
| 100% N1mΨ modified saRNA | Transfection potency in difficult cells | Roughly order of magnitude increase | [100] |
| B18R mRNA co-delivery | Cell viability over 7-day repeated transfection | Significant improvement | [101] |
| B18R mRNA co-delivery | Mx1 (ISG) expression | Significantly reduced | [101] |
Conclusion
Overcoming the interferon response in repeated mRNA transfections is no longer an insurmountable challenge but a manageable parameter in therapeutic design. The convergence of mRNA engineering, advanced delivery systems, and strategic immunomodulation provides a robust toolkit for sustaining high-level protein expression across multiple doses. Key takeaways include the critical role of nucleoside modifications and purification in reducing innate immune activation, the promise of transient IFNAR blockade in enhancing adaptive immunity, and the dose-sparing potential of novel platforms like trans-amplifying mRNA. Future directions must focus on developing personalized dosing schedules that account for patient-specific immune status, creating next-generation LNPs with improved tissue targeting, and integrating these strategies into clinical protocols for chronic diseases requiring long-term mRNA treatment. By systematically addressing the interferon barrier, the full therapeutic potential of mRNA technology across oncology, infectious diseases, and protein replacement therapies can be realized.
References
- 1. Molecular mechanisms of viral inhibitors of RIG-I-like receptors [https://pmc.ncbi.nlm.nih.gov/articles/PMC3299846/]
- 2. RIG-I-like receptors: their regulation and roles in RNA ... [https://www.nature.com/articles/s41577-020-0288-3]
- 3. Master sensors of pathogenic RNA – RIG-I like receptors - PMC [https://pmc.ncbi.nlm.nih.gov/articles/PMC7114584/]
- 4. Crosstalk between TLR8 and RIG-I-like receptors ... [https://pmc.ncbi.nlm.nih.gov/articles/PMC10227620/]
- 5. Regulation of RIG-I-like receptor-mediated signaling [https://www.nature.com/articles/s41423-020-00602-7]
- 6. Induction of IFN -β and the Innate Antiviral Response in Myeloid Cells... [https://pmc.ncbi.nlm.nih.gov/articles/PMC2747008/]
- 7. A Way Forward for Therapeutics and Vaccine Design - PMC [https://pmc.ncbi.nlm.nih.gov/articles/PMC4148647/]
- 8. Proteolysis of MDA and IPS-1 is not required for 5 of the type... inhibition [https://virologyj.biomedcentral.com/articles/10.1186/s12985-015-0393-2]
- 9. Alpha/Beta Interferon Inhibits Cap-Dependent Translation ... [https://pmc.ncbi.nlm.nih.gov/articles/PMC2259014/]
- 10. Suppression of mRNA Nanoparticle Transfection in Human ... [https://pmc.ncbi.nlm.nih.gov/articles/PMC5618237/]
- 11. mRNA Transfection-Induced Activation of Primary Human ... [https://www.nature.com/articles/s41598-020-60506-4]
- 12. Mechanisms of type-I- and type-II-interferon-mediated ... [https://www.nature.com/articles/nri1604]
- 13. Interferon [https://en.wikipedia.org/wiki/Interferon]
- 14. Innate immune responses against mRNA vaccine promote ... [https://www.nature.com/articles/s41467-024-51411-9]
- 15. Unleashing the potential of mRNA: Overcoming delivery ... [https://pmc.ncbi.nlm.nih.gov/articles/PMC11883111/]
- 16. The Strategies and Advances of mRNA Translation Booster [https://www.sciencedirect.com/science/article/pii/S1818087625000741]
- 17. Ex vivo model of functioning human lymph node reveals role ... [https://pmc.ncbi.nlm.nih.gov/articles/PMC12284374/]
- 18. The advances of adjuvants in mRNA vaccines - PMC [https://pmc.ncbi.nlm.nih.gov/articles/PMC10603121/]
- 19. Technological breakthroughs and advancements in the ... [https://www.frontiersin.org/journals/immunology/articles/10.3389/fimmu.2025.1524317/full]
- 20. Strategies for controlling the innate immune activity of ... [https://www.sciencedirect.com/science/article/abs/pii/S0169409X21002933]
- 21. Controlling reactogenicity while preserving immunogenicity ... [https://www.nature.com/articles/s41541-025-01135-8]
- 22. Innate Inhibiting Proteins Enhance Expression and ... [https://pmc.ncbi.nlm.nih.gov/articles/PMC7935664/]
- 23. Reduced Cytotoxicity by Repetitive mRNA Transfection in ... [https://pmc.ncbi.nlm.nih.gov/articles/PMC9978836/]
- 24. Formulation and Delivery Technologies for mRNA Vaccines [https://pmc.ncbi.nlm.nih.gov/articles/PMC8195316/]
- 25. Progress and prospects of mRNA-based drugs in pre- ... [https://www.nature.com/articles/s41392-024-02002-z]
- 26. Troubleshooting Transfection: Common Problems and Solutions [https://www.yeasenbio.com/blogs/cell/troubleshooting-transfection-common-problems-and-solutions]
- 27. Lipid-Based Transfection—Troubleshooting [https://www.thermofisher.com/us/en/home/technical-resources/technical-reference-library/transfection-support-center/lipid-transfection-support/lipid-transfection-support-troubleshooting.html]
- 28. The Role of the RNA-sensing-Mediated Interferon ... [https://pubmed.ncbi.nlm.nih.gov/40607250/]
- 29. The mRNA component of LNP-mRNA vaccines triggers ... [https://www.frontiersin.org/journals/immunology/articles/10.3389/fimmu.2025.1670350/full]
- 30. 肾细胞癌中Jak-Stat 激活缺陷与α干扰素耐药相关。 [https://suppr.wilddata.cn/browses/detail/pubmed/17573897]
- 31. Interferon Priming. Effects on Interferon Messenger RNA [https://pubmed.ncbi.nlm.nih.gov/438179/]
- 32. Type I IFN Counteracts the Induction of Antigen-Specific ... [https://www.sciencedirect.com/science/article/pii/S1525001616305810]
- 33. Delivering the Message: Translating mRNA Therapy for Liver ... [https://pmc.ncbi.nlm.nih.gov/articles/PMC12361847/]
- 34. Modified Nucleotides for mRNA Therapeutics [https://areterna.com/modified-nucleotides-for-mrna-therapeutics-pseudouridine-m1%CF%88-and-beyond/]
- 35. The Role of N1-Methylpseudouridine in COVID-19 Vaccines [https://pmc.ncbi.nlm.nih.gov/articles/PMC8043204/]
- 36. mRNA medicine: Recent progresses in chemical ... [https://pmc.ncbi.nlm.nih.gov/articles/PMC12311907/]
- 37. Alpha and beta type 1 interferon signaling [https://pmc.ncbi.nlm.nih.gov/articles/PMC4733246/]
- 38. Why mRNA Transfection Is Transforming Transient ... [https://www.promegaconnections.com/why-mrna-transfection-is-transforming-transient-expression-workflows/]
- 39. Interferon type I [https://en.wikipedia.org/wiki/Interferon_type_I]
- 40. Optimizing dsRNA Removal in IVT mRNA [https://www.labroots.com/webinar/optimizing-dsrna-removal-ivt-mrna-strategies-enhanced-translation-reduced-immunogenicity?srsltid=AfmBOoqAXZcV_nLDOfWa4npWFSrQXN-oARnaYdsbTw1Lr5SGQVsq-Dda]
- 41. A Facile Method for the Removal of dsRNA Contaminant ... [https://pmc.ncbi.nlm.nih.gov/articles/PMC6444222/]
- 42. Cap-independent co-expression of dsRNA-sensing and NF ... [https://pmc.ncbi.nlm.nih.gov/articles/PMC12396818/]
- 43. Removal of dsRNA byproducts using affinity chromatography [https://www.sciencedirect.com/science/article/pii/S2162253125001039]
- 44. Screening of mRNA Chemical Modification to Maximize ... [https://pmc.ncbi.nlm.nih.gov/articles/PMC4588190/]
- 45. Induction of an IFN-Mediated Antiviral Response by a Self ... [https://pmc.ncbi.nlm.nih.gov/articles/PMC5421303/]
- 46. Viral interferon antagonism shapes host tropism - PMC [https://pmc.ncbi.nlm.nih.gov/articles/PMC12503246/]
- 47. Deep generative optimization of mRNA codon sequences ... [https://www.nature.com/articles/s41467-025-64894-x]
- 48. SP140–RESIST pathway regulates interferon mRNA ... [https://www.nature.com/articles/s41586-025-09152-2]
- 49. IFN-γ-Driven macrophage responses in the immunity to ... [https://www.frontiersin.org/journals/cellular-and-infection-microbiology/articles/10.3389/fcimb.2025.1679691/full]
- 50. Guidelines for RNA Transfection [https://www.thermofisher.com/us/en/home/references/gibco-cell-culture-basics/transfection-basics/guidelines-for-rna-transfection.html]
- 51. Resources - AUM Biotech [https://www.aumbiotech.com/resources]
- 52. mRNA Delivery Systems 2.0: Engineering Extrahepatic ... [https://www.sciencedirect.com/science/article/pii/S259000642501155X]
- 53. Particles that enhance mRNA delivery could reduce ... [https://news.mit.edu/2025/particles-enhance-mrna-delivery-could-reduce-vaccine-dosage-costs-1107]
- 54. A complete guide to understanding Lipid nanoparticles (LNP) [https://insidetx.com/resources/reviews/complete-guide-to-understanding-lipid-nanoparticles-lnp/]
- 55. Ionizable lipid nanoparticles of mRNA vaccines elicit NF-κB ... [https://pmc.ncbi.nlm.nih.gov/articles/PMC12006303/]
- 56. Synergistic effect of nucleoside modification and ionizable ... [https://www.nature.com/articles/s41541-025-01263-1]
- 57. Cost-effective yet high-performance ionizable lipids for ... [https://www.sciencedirect.com/science/article/abs/pii/S0142961225003400]
- 58. Scope and challenges of nanoparticle-based mRNA ... [https://pmc.ncbi.nlm.nih.gov/articles/PMC9686230/]
- 59. Chemically modified tRNA enhances the translation ... [https://www.nature.com/articles/s41467-025-62981-7]
- 60. Unlocking mRNA-driven CRISPR-Cas9 gene therapy via ... [https://pmc.ncbi.nlm.nih.gov/articles/PMC12594903/]
- 61. Functional Involvement of circRNAs in the Innate Immune ... [https://pmc.ncbi.nlm.nih.gov/articles/PMC10458642/]
- 62. Self-Amplifying RNA: Advantages and Challenges of a Versatile Platform for Vaccine Development - PMC [https://pmc.ncbi.nlm.nih.gov/articles/PMC12031284/]
- 63. circCsnk1g3- and circAnkib1-regulated interferon ... [https://www.nature.com/articles/s41467-022-34872-8]
- 64. Advancing Lung Cancer Treatment: mRNA Therapeutics ... [https://pmc.ncbi.nlm.nih.gov/articles/PMC12593380/]
- 65. Precision-engineered mRNA vaccines: antigen design ... [https://animaldiseases.biomedcentral.com/articles/10.1186/s44149-025-00186-7]
- 66. Loop structure in poly(A) tail of mRNA vaccine enhances ... [https://pmc.ncbi.nlm.nih.gov/articles/PMC12623927/]
- 67. Transient inhibition of type I interferon enhances CD8+ T cell ... [https://pmc.ncbi.nlm.nih.gov/articles/PMC11893171/]
- 68. Transient Blockade of Type I Interferon Signalling Promotes ... [https://pmc.ncbi.nlm.nih.gov/articles/PMC10142689/]
- 69. Translational regulation of viral RNA in the type I interferon ... [https://www.sciencedirect.com/science/article/pii/S2666478X21000064]
- 70. Cumulative Toxicity in Targeted Therapies: What to Expect at ... [https://pmc.ncbi.nlm.nih.gov/articles/PMC6855968/]
- 71. Systemic Inflammatory Response Syndrome (SIRS) [https://emedicine.medscape.com/article/168943-overview]
- 72. FAQ Transfection Reagents [https://www.sartorius.com/en/products/nucleic-acid-delivery-solutions/transfection-reagents/faq-transfection-reagents]
- 73. Rewired type I IFN signaling is linked to age-dependent ... [https://pmc.ncbi.nlm.nih.gov/articles/PMC12432374/]
- 74. dynamics of type 1 interferon signaling across the lifespan [https://pmc.ncbi.nlm.nih.gov/articles/PMC12571846/]
- 75. Sustained IFN signaling is associated with delayed ... [https://www.nature.com/articles/s41467-024-48556-y]
- 76. A comparative computational analysis of IFN-alpha ... [https://journals.plos.org/ploscompbiol/article?id=10.1371/journal.pcbi.1013509]
- 77. A comparative computational analysis of IFN-alpha ... [https://pubmed.ncbi.nlm.nih.gov/40997098/]
- 78. mRNA therapeutics: Transforming medicine through ... [https://pmc.ncbi.nlm.nih.gov/articles/PMC12590236/]
- 79. Type I interferon receptor knockout mice as models for ... [https://pmc.ncbi.nlm.nih.gov/articles/PMC5869239/]
- 80. Type I interferon receptor knockout mice as models for ... [https://pubmed.ncbi.nlm.nih.gov/29511140/]
- 81. Protection of K18-hACE2 Mice against SARS-CoV-2 ... [https://pmc.ncbi.nlm.nih.gov/articles/PMC11281552/]
- 82. A highly susceptible hACE2-transgenic mouse model for ... [https://www.frontiersin.org/journals/microbiology/articles/10.3389/fmicb.2024.1348405/full]
- 83. Human ACE2 transgenic pigs are susceptible to SARS ... [https://www.nature.com/articles/s41467-024-54615-1]
- 84. IFNAR signaling of neuroectodermal cells is essential for the ... [https://jneuroinflammation.biomedcentral.com/articles/10.1186/s12974-023-02737-6]
- 85. Ifnar1 Knockout Mouse Model | C001268 [https://www.cyagen.com/mouseatlas/C001268]
- 86. Trans amplifying mRNA vaccine expressing consensus ... [https://www.nature.com/articles/s41541-025-01166-1]
- 87. New research to investigate next generation 'trans- ... - CEPI [https://cepi.net/new-research-investigate-next-generation-trans-amplifying-mrna-vaccines]
- 88. Trans amplifying mRNA vaccine expressing consensus ... [https://pubmed.ncbi.nlm.nih.gov/40461576/]
- 89. TransIT®-LT1 Transfection Reagent [https://www.mirusbio.com/faqs-transfection/?srsltid=AfmBOoqW2EI8_6wIiteuSe2PGg4fphhZlIBOqZ-32La981-Oh1kdGmcl]
- 90. Troubleshooting Transfection: Common Problems and Solutions [https://www.yeasenbio.com/da/blogs/cell/troubleshooting-transfection-common-problems-and-solutions]
- 91. RNAi Synthetics Support—Troubleshooting [https://www.thermofisher.com/us/en/home/technical-resources/technical-reference-library/rnai-support-center/rnai-synthetics-support/rnai-synthetics-support-troubleshooting.html]
- 92. Advances in the design and delivery of RNA vaccines for ... [https://www.sciencedirect.com/science/article/pii/S0169409X24002412]
- 93. Therapeutic anti-cancer vaccines: a systematic review of ... [https://pmc.ncbi.nlm.nih.gov/articles/PMC12305733/]
- 94. Immunomodulatory vaccine demonstrates therapeutic ... [https://www.nature.com/articles/s41598-025-21924-4]
- 95. mRNA-based vaccines and therapeutics: an in-depth survey ... [https://jbiomedsci.biomedcentral.com/articles/10.1186/s12929-023-00977-5]
- 96. Session 4: mRNA and Self-Amplifying RNA (saRNA) [https://pmc.ncbi.nlm.nih.gov/articles/PMC11673298/]
- 97. Review The advent of clinical self-amplifying RNA vaccines [https://www.sciencedirect.com/science/article/pii/S1525001625002692]
- 98. The potential and challenges of circular RNA in ... [https://pmc.ncbi.nlm.nih.gov/articles/PMC12423345/]
- 99. RNA Therapeutics: Delivery Problems and Solutions—A Review [https://pmc.ncbi.nlm.nih.gov/articles/PMC12567017/]
- 100. Complete substitution with modified nucleotides suppresses the early... [https://pubmed.ncbi.nlm.nih.gov/37745375/]
- 101. Efficient reduction of synthetic mRNA induced immune activation by... [https://jbioleng.biomedcentral.com/articles/10.1186/s13036-019-0172-5]
- 102. Pioneering next-generation mRNA therapeutics through ... [https://www.sciencedirect.com/science/article/abs/pii/S1369702125003608]