Preserving Cellular Identity: Strategies for Maintaining Tissue-Specific Function After Reprogramming
This article explores the pivotal challenge of maintaining tissue-specific function following cellular reprogramming, a central concern for researchers and drug development professionals in regenerative medicine.
Preserving Cellular Identity: Strategies for Maintaining Tissue-Specific Function After Reprogramming
Abstract
This article explores the pivotal challenge of maintaining tissue-specific function following cellular reprogramming, a central concern for researchers and drug development professionals in regenerative medicine. It synthesizes current scientific understanding by first establishing the fundamental importance of cellular identity and the consequences of its loss. The piece then details advanced methodological approaches—from partial reprogramming to novel non-viral delivery systems—designed to achieve functional rejuvenation without dedifferentiation. Furthermore, it addresses key troubleshooting aspects, including safety profiles and overcoming microenvironmental barriers, and concludes with a rigorous analysis of validation frameworks and comparative efficacy of different reprogramming modalities. This comprehensive review serves as a strategic guide for developing safe and effective reprogramming-based therapies that preserve essential tissue function.
The Cellular Identity Imperative: Why Tissue-Specific Function Matters in Reprogramming
Defining Cellular Identity and Functional Maturity in Differentiated Tissues
FAQs and Troubleshooting Guides
FAQ 1: What defines a cell's identity and how can we confirm it after reprogramming?
A cell's identity is defined by its specific gene expression patterns, epigenetic landscape, and functional characteristics [1]. After reprogramming, you should confirm identity using a multi-omics approach:
- Transcriptomic Analysis: Use single-cell RNA sequencing to profile gene expression. Do not rely solely on a few marker genes; instead, employ computational methods like the Index of Cell Identity (ICI) that utilize large sets of informative markers to quantify identity against reference datasets [1] [2].
- Epigenetic Profiling: Assess the chromatin state and DNA methylation patterns, as these are crucial for maintaining cell identity [3] [4].
- Functional Assays: The ultimate validation is whether the cell performs its expected specialized function (e.g., electrophysiological activity in neurons, contractility in cardiomyocytes, glycogen storage in hepatocytes) [3].
FAQ 2: Our reprogrammed cells show mixed or unstable identities. What are the primary causes and solutions?
This is a common challenge often stemming from incomplete epigenetic reprogramming or persistent expression of genes from the cell of origin [5].
- Cause: Incomplete Erasure of Somatic Memory. The original cell's gene expression signature can resist full reprogramming, leading to partially reprogrammed cells or aberrant cell types [5].
- Solution: Optimize reprogramming factor delivery for transient expression. For direct reprogramming, ensure your transcription factor cocktail is robust and specific. Recent studies show that actively knocking down or reducing the expression of key genes specific to the starting cell type can significantly improve the fidelity of the new identity [5].
FAQ 3: How can we assess the functional maturity of differentiated cells in vitro?
Functional maturity is context-dependent but generally involves:
- Physiological Function: Test cells for specialized tasks. For neurons, measure action potentials and synaptic activity; for beta-cells, measure glucose-stimulated insulin secretion; for cardiomyocytes, assess contractile force and calcium handling [3].
- Metabolic Maturation: Evaluate a shift from glycolytic to oxidative phosphorylation, a hallmark of many mature cell types [6].
- Molecular Profiling: Compare your cells' transcriptomic and epigenetic signatures to those of primary adult cells (not fetal cells) to assess maturity [2].
FAQ 4: What are the key differences between full, partial, and direct reprogramming for achieving functional maturity?
The choice of strategy involves a trade-off between rejuvenation potential and the risk of losing cell identity.
Table 1: Comparison of Reprogramming Strategies for Functional Maturity
| Strategy | Process | Pros | Cons | Best for Applications Involving |
|---|---|---|---|---|
| Full Reprogramming | Conversion to induced pluripotent stem cells (iPSCs) [7]. | High expandability; can differentiate into any cell type. | Time-consuming; risk of teratoma formation; epigenetic reset may create fetal-like rather than adult cells [8]. | Disease modeling requiring large cell numbers; generating a wide variety of cell types from one source. |
| Direct Reprogramming (Transdifferentiation) | Direct conversion from one somatic cell type to another [6]. | Faster; bypasses pluripotent state, reducing tumor risk; can preserve age-related epigenetics. | Often lower efficiency; maturity can be limited; may retain epigenetic memory of donor cell [5]. | Rapid generation of specific cell types; modeling age-related diseases. |
| Partial Reprogramming | Transient induction of reprogramming factors to reverse aging without changing cell identity [8]. | Rejuvenates aged cells (resets epigenetic age, improves mitochondrial function); maintains original cell identity. | Precise control of the "partial" state is critical and challenging; risk of over-reprogramming [4]. | Rejuvenating aged patient-specific cells for therapy or disease modeling; treating age-related functional decline. |
Troubleshooting Common Experimental Issues
Issue 1: Low Efficiency in Direct Lineage Conversion
Problem: Only a small percentage of starting cells convert to the desired target cell type.
Possible Causes and Solutions:
- Cause A: Inefficient delivery of reprogramming factors.
- Solution: Consider switching from viral vectors to non-viral methods like Tissue Nanotransfection (TNT), which uses nanoelectroporation for highly efficient, localized delivery of plasmids or mRNA, reducing off-target effects [6].
- Cause B: The epigenetic landscape of the starting cell is a barrier.
- Solution: Include small molecules in your protocol that modulate chromatin state, such as histone deacetylase inhibitors (e.g., valproic acid) or DNA methyltransferase inhibitors (e.g., 5-aza-2'-deoxycytidine) [7].
Issue 2: Differentiated Cells Lack Adult-like Functional Maturity
Problem: Reprogrammed neurons or cardiomyocytes exhibit immature, fetal-like properties.
Possible Causes and Solutions:
- Cause A: The in vitro culture environment lacks necessary biophysical and biochemical cues.
- Solution: Engineer the microenvironment. Use 3D scaffolds instead of 2D plastic, incorporate relevant extracellular matrix (ECM) proteins (e.g., Matrigel, collagen), and apply appropriate biophysical forces (e.g., mechanical stretching for cardiomyocytes) [7].
- Cause B: The cells are not being maintained long-term or are missing systemic signals.
- Solution: Extend the time in culture and use advanced media formulations with stage-specific growth factors and hormones to promote maturation.
Issue 3: Teratoma Formation or Uncontrolled Proliferation After Transplantation
Problem: Upon in vivo transplantation, cells form tumors.
Possible Causes and Solutions:
- Cause A: Contamination with undifferentiated pluripotent cells from an iPSC-based protocol.
- Solution: Implement rigorous purification strategies before transplantation, such as fluorescence-activated or magnetic-activated cell sorting (FACS/MACS) using specific surface markers to select for the desired differentiated cells and eliminate Tra-1-60+/SSEA4+ pluripotent cells.
- Cause B: Use of oncogenic reprogramming factors like c-Myc.
Experimental Protocols for Key Assays
Protocol 1: Quantifying Cell Identity from Single-Cell RNA-seq Data
Purpose: To objectively assign identity to single cells, especially during dynamic transitions like reprogramming.
Methodology [2]:
- Generate a Reference Dataset: Compile bulk or single-cell RNA-seq profiles from highly purified, well-defined cell types relevant to your system.
- Select Informative Markers: Use an information-theory-based approach (e.g.,
scDD) to select a panel of genes that are robustly and informatively expressed across the reference cell types. These genes do not need to be unique to one cell type. - Calculate an Index of Cell Identity (ICI): For each single cell in your test dataset, compute a score that represents the relative contribution of each reference cell identity based on the expression of the selected marker panel.
- Interpretation: A high ICI score for a specific identity indicates the cell is firmly in that state. Intermediate or mixed scores can reveal transitional or aberrant identities.
Protocol 2: In Vivo Partial Reprogramming in a Mouse Model
Purpose: To rejuvenate aged cells within a living organism without altering their identity [8] [4].
Methodology:
- Model Selection: Use a transgenic mouse model with a doxycycline (dox)-inducible polycistronic cassette for OSKM or OSK factors (e.g., "LAKI" mouse).
- Cyclic Induction Protocol: Administer dox cyclically to induce transient reprogramming. A common regimen is a 2-day pulse of dox followed by a 5-day chase without dox. This cycle is repeated multiple times.
- Monitoring: Continuously monitor for teratoma formation. Assess rejuvenation using biomarkers like DNA methylation clocks, transcriptomic age, and tissue-specific functional assays.
- Key Control: Always include non-induced control mice from the same genetic background.
Key Signaling Pathways and Workflows
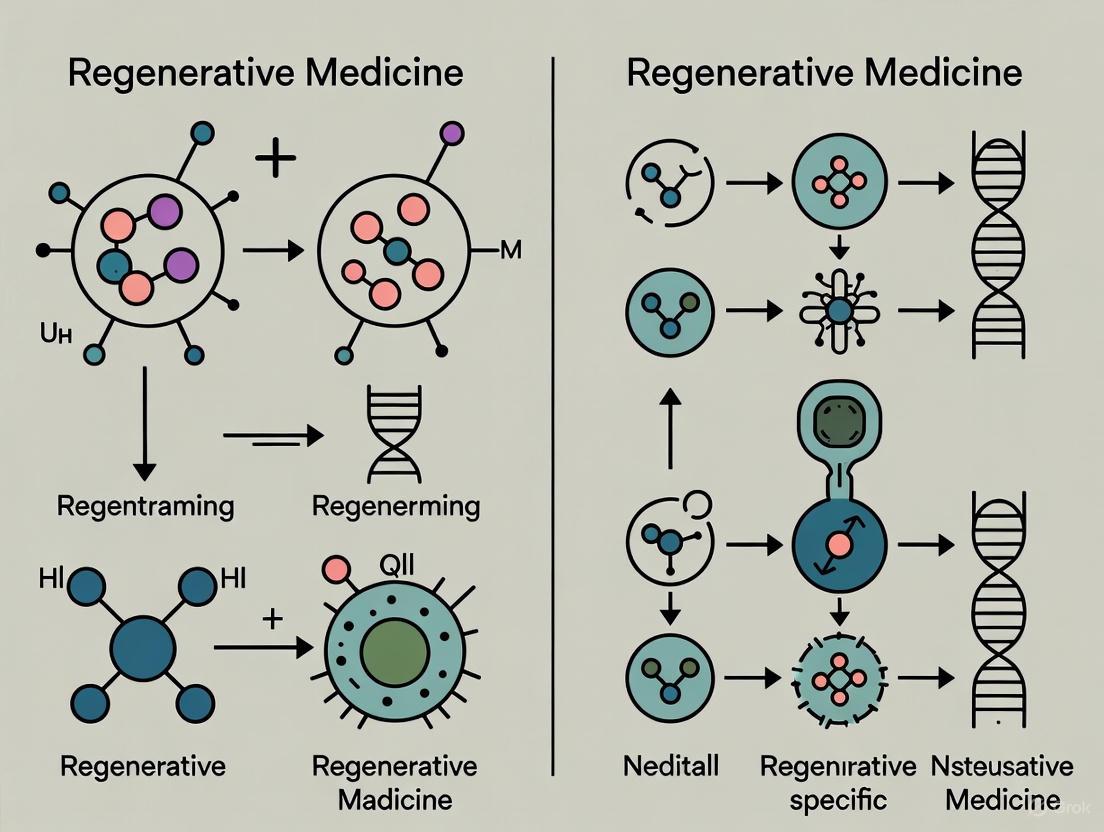
Diagram 1: Identity Gene Selection
Diagram 2: Reprogramming Workflow
The Scientist's Toolkit: Research Reagent Solutions
Table 2: Essential Reagents for Cellular Reprogramming and Identity Research
| Reagent / Tool | Function / Purpose | Key Considerations |
|---|---|---|
| Yamanaka Factors (OSKM) | Core transcription factors (Oct4, Sox2, Klf4, c-Myc) for inducing pluripotency [3] [7]. | c-Myc is oncogenic; consider omitting it (OSK) for safer partial reprogramming [4]. |
| Non-Viral Delivery Systems (TNT) | Physical method (nanoelectroporation) for delivering genetic cargo (DNA, mRNA) directly into tissues in vivo; high efficiency and minimal immunogenicity [6]. | Ideal for transient expression; avoids genomic integration risks associated with retro/lentiviruses. |
| CRISPR/dCas9 Systems | Programmable synthetic transcription factors for precise activation or repression of endogenous genes; useful for manipulating cell identity networks [6]. | Enables multiplexed gene regulation without altering the underlying DNA sequence. |
| Small Molecule Cocktails | Chemical compounds that can replace transcription factors to induce pluripotency or facilitate direct reprogramming [7] [4]. | Non-integrative and scalable; allows fine-tuning of exposure for partial reprogramming. |
| Cell Identity Genes (CIGs) Panel | A curated set of genes used to quantitatively assess cell identity from transcriptomic data beyond traditional differential expression [1] [2]. | Provides a more robust and biologically relevant measure of identity than a handful of classic markers. |
| Epigenetic Clock Assays | Tools to measure biological age based on DNA methylation patterns at specific CpG sites [8] [4]. | Critical for validating the success of partial reprogramming and confirming cellular rejuvenation. |
Frequently Asked Questions (FAQs)
Q1: What are the primary tumorigenicity risks associated with using human pluripotent stem cells (hPSCs) in therapy?
The primary risk is the potential formation of teratomas or other tumors from residual undifferentiated hPSCs present in a cell therapy product. Pluripotent stem cells, including both embryonic stem cells (ESCs) and induced pluripotent stem cells (iPSCs), are intrinsically tumorigenic. Even a small number of undifferentiated cells can lead to teratoma formation after transplantation. The risk is dependent on mutations in oncogenes and tumor suppressor genes during the cellular conversion process [9] [10].
Q2: How can I detect residual undifferentiated hPSCs in my cell therapy product to mitigate teratoma risk?
You can use a combination of highly sensitive in vitro and in vivo assays. Current consensus recommends that in vitro assays, such as digital PCR for hPSC-specific RNA and the highly efficient culture assay (HECA), offer superior detection sensitivity compared to conventional in vivo tumorigenicity assays. These methods should be rigorously validated for each specific product to ensure they can reliably detect even low levels of residual hPSCs [10].
Q3: What is the relationship between the Yamanaka reprogramming factors (OSKM) and cancer?
The reprogramming factors themselves, particularly c-Myc, are known oncogenes. Abnormal expression of other core pluripotency factors like OCT4, SOX2, and NANOG (OSN) has been clinically associated with treatment resistance and worse prognosis in several cancers, including renal, bladder, and prostate cancers. This underscores the critical need to eliminate these factors from the final cell product and to ensure complete differentiation [9].
Q4: What is dedifferentiation in the context of cellular reprogramming, and how does it differ from rejuvenation?
Dedifferentiation refers to a cell reverting to a less specialized state, which in extreme cases can mean a return to a pluripotent or progenitor-like state, raising tumorigenicity concerns [9]. In contrast, reprogramming-induced rejuvenation (RIR) aims to reverse the hallmarks of cellular aging without erasing the cell's identity, effectively making an old cell functionally younger without pushing it back to a pluripotent state. It is crucial to distinguish between these concepts for safety [4].
Q5: Are there non-genetic methods for reprogramming that reduce tumor risk?
Yes, partial reprogramming and chemical reprogramming are promising approaches. Partial reprogramming involves transiently exposing cells to reprogramming factors, which can rejuvenate them without fully dedifferentiating them into iPSCs, thereby reducing teratoma risk. Furthermore, fully chemical reprogramming using small-molecule cocktails is a non-genetic method that can avoid the risks associated with integrating oncogenes like c-Myc [4].
Troubleshooting Guides
Guide 1: Troubleshooting Teratoma Formation in Animal Models
Problem: Teratomas are observed in animal models following transplantation of your hPSC-derived cell product.
| Step | Investigation | Possible Outcome & Interpretation | Recommended Action |
|---|---|---|---|
| 1 | Check for residual undifferentiated cells. | High levels of pluripotency markers (OCT4, SOX2) in the final product. | Optimize your differentiation protocol. Introduce a positive selection step for target cells or a negative selection step to deplete undifferentiated cells (e.g., using an antibody against a pluripotency surface marker). |
| 2 | Assess differentiation protocol efficiency. | Inconsistent or heterogeneous cell populations. | Review and standardize differentiation media, growth factors, and timing. Use lineage-specific reporters to purify a homogeneous population. |
| 3 | Validate detection assay sensitivity. | Your quality control assay fails to detect low levels of contaminants. | Implement a more sensitive QC assay, such as digital PCR or HECA, as recommended by recent guidelines [10]. |
| 4 | Analyze the tumor histology. | The tumor is a teratoma (containing tissues from multiple germ layers). | Confirms the tumor originated from residual pluripotent cells. Focus on Steps 1-3. |
| The tumor is not a teratoma. | May indicate a different oncogenic process, such as transformation of the differentiated cells. |
Guide 2: Addressing Poor Differentiation and Dedifferentiation
Problem: Differentiated cells lose their tissue-specific function or show signs of reverting to an immature state in culture.
| Step | Investigation | Possible Outcome & Interpretation | Recommended Action |
|---|---|---|---|
| 1 | Confirm culture conditions. | The medium supports pluripotency or lacks necessary trophic factors. | Switch to a defined, lineage-specific maintenance medium. Avoid using feeders or conditions used for pluripotent cell culture. |
| 2 | Monitor expression of pluripotency genes. | Re-expression of markers like OCT4 or NANOG. | Indicates dedifferentiation. Optimize culture conditions to reinforce mature cell identity. Consider removing c-Myc from reprogramming protocols if used [4] [9]. |
| 3 | Check for proliferation status. | Uncontrolled proliferation of supposedly post-mitotic cells. | Could be a sign of transformation. Perform functional assays to confirm the cells have not acquired oncogenic properties. |
| 4 | Verify the expression of target function. | Loss of key functional markers and ion channels. | The differentiation or maturation protocol is insufficient. Re-optimize the protocol's final stages to promote terminal maturation. |
Data Summaries
Table 1: Comparison of Methods for Detecting Residual Pluripotent Stem Cells
| Method | Principle | Detection Sensitivity | Time to Result | Key Advantages | Key Limitations |
|---|---|---|---|---|---|
| In Vivo Tumorigenicity Assay | Injection of cells into immunodeficient mice and monitoring for tumor formation. | Low (Limited by animal model) | 4-6 months | Gold standard for demonstrating functional tumorigenicity. | Long duration, expensive, low throughput, ethically burdensome. |
| Highly Efficient Culture Assay (HECA) | Culture of test cells under conditions highly favorable for pluripotent cell growth. | High | 2-4 weeks | Superior sensitivity, quantitative, in vitro. | May not detect all types of pluripotent cells. |
| Digital PCR (dPCR) | Absolute quantification of hPSC-specific RNA/DNA targets without a standard curve. | Very High | 1-2 days | Excellent sensitivity and specificity, rapid, quantitative. | Requires known specific targets; does not assess functional pluripotency. |
Data synthesized from current consensus recommendations [10].
Table 2: Pluripotency Factors: Roles in Stem Cells and Association with Cancer
| Factor | Core Function in Pluripotency | Association with Human Cancers |
|---|---|---|
| OCT4 | Maintains embryonic stem cell identity; deletion prevents inner cell mass formation. | High expression linked to poor prognosis in bladder, prostate, and pancreatic cancers [9]. |
| SOX2 | Works synergistically with OCT4; essential for maintaining OCT4 expression. | Overexpression correlates with poor prognosis in esophageal, gastric, and small-cell lung carcinomas [9]. |
| KLF4 | Delays differentiation and stimulates self-renewal in ESCs. | A prognostic predictor in colon cancer and head and neck squamous cell carcinoma [9]. |
| NANOG | Critical for maintaining pluripotency in the absence of LIF-STAT3 signaling. | High expression is associated with worse outcomes in testicular, colorectal, and lung cancers [9]. |
| c-Myc | Promotes cell proliferation during reprogramming. | A well-characterized oncogene; its use increases tumor risk in iPSCs [4] [9]. |
Experimental Protocols
Protocol 1: Highly Efficient Culture Assay (HECA) for Detecting Residual Undifferentiated hPSCs
Purpose: To provide a sensitive in vitro method for quantifying residual undifferentiated hPSCs in a differentiated cell product, as a safety quality control step [10].
Materials:
- Test cell sample (hPSC-derived product)
- Control hPSCs (positive control)
- Feeder cells (e.g., irradiated mouse embryonic fibroblasts) or a defined, feeder-free substrate (e.g., Geltrex)
- hPSC culture medium (e.g., mTeSR or equivalent)
- Tissue culture plates
Method:
- Preparation: Seed feeder cells or coat plates with an appropriate substrate according to standard protocols.
- Plating: Serially dilute the test cell sample and plate over a range of densities (e.g., from 10,000 to 1 million cells per well) onto the prepared plates. Include a positive control of known numbers of hPSCs to establish a calibration curve.
- Culture: Maintain cultures in hPSC culture medium for 2-4 weeks, changing the medium every day.
- Analysis: Score wells for the presence of hPSC colonies based on morphology (tight, dome-shaped colonies with defined borders). Alkaline phosphatase staining or immunocytochemistry for pluripotency markers (OCT3/4, TRA-1-60) can be used for definitive identification.
- Calculation: Use the number of positive wells at each dilution to calculate the frequency of residual undifferentiated hPSCs in the test sample, for example, using statistical methods like the Poisson distribution.
Protocol 2: In Vivo Teratoma Formation Assay
Purpose: To assess the functional tumorigenic potential of an hPSC-derived cell therapy product in vivo [9] [10].
Materials:
- Test cell sample
- Immunocompromised mice (e.g., NOD/SCID, NSG)
- Matrigel or similar basement membrane matrix
- Injection equipment (syringes, needles)
Method:
- Cell Preparation: Harvest and concentrate the test cells. Resuspend the cells in an appropriate, cold, sterile buffer mixed with Matrigel.
- Injection: Inject the cell suspension into the intended site (e.g., intramuscular, subcutaneous, under the kidney capsule) of the immunocompromised mice. A positive control of undifferentiated hPSCs and a negative control of vehicle-only should be included.
- Monitoring: Monitor the animals for up to 6 months for signs of tumor formation. Palpate the injection site regularly.
- Necropsy & Histology: Upon tumor formation or at the study endpoint, euthanize the animals and excise the injection site. Process the tissue for histological analysis (H&E staining). A teratoma is confirmed by the presence of differentiated tissues from all three embryonic germ layers (e.g., cartilage/ bone (mesoderm), glandular epithelium (endoderm), and neural rosettes (ectoderm)).
The Scientist's Toolkit
Research Reagent Solutions
| Reagent / Material | Function in Risk Mitigation |
|---|---|
| Digital PCR Assays | Provides highly sensitive, absolute quantification of residual undifferentiated hPSCs by targeting specific RNA/DNA markers (e.g., POUSF1 for OCT4) [10]. |
| Anti-hPSC Surface Marker Antibodies | Used for negative selection (e.g., via FACS or magnetic sorting) to physically deplete undifferentiated cells (e.g., targeting SSEA-5, TRA-1-60) from the final product. |
| Small Molecule Reprogramming Cocktails | Non-integrating, chemical-based reagents (e.g., 7c cocktail) for partial or full reprogramming, reducing the genomic integration risks associated with viral vectors [4]. |
| Inducible Expression Systems | Systems (e.g., Doxycycline-inducible OSKM) allow for transient, controlled expression of reprogramming factors, which is critical for safe partial reprogramming and reducing the risk of factor persistence [4]. |
| Lineage-Specific Reporter Cell Lines | Genetically engineered hPSC lines that express a fluorescent protein (e.g., GFP) under a tissue-specific promoter, enabling precise purification of target differentiated cells and exclusion of off-target cells. |
Signaling Pathways and Workflows
Teratoma Risk Assessment Workflow
Pluripotency Factor Signaling Network
Within a complex organism, every cell possesses an identical DNA sequence, yet evolves into distinct tissues with specialized functions. This divergence is governed by the epigenetic landscape—a dynamic and heritable regulatory system that controls gene expression without altering the underlying DNA sequence [11]. For researchers focused on cellular reprogramming, understanding how to establish and maintain stable, tissue-specific epigenetic programs is paramount to ensuring the proper function of reprogrammed cells. Epigenetic mechanisms, including DNA methylation, histone modifications, and non-coding RNA regulation, work in concert to define cellular identity by activating necessary genes and silencing others in a precise, tissue-specific manner [12] [13]. This technical support guide delves into the core mechanisms, common experimental challenges, and advanced protocols essential for investigating these complex regulatory networks.
Core Epigenetic Mechanisms and Their Roles
Epigenetic control of tissue-specific gene expression operates through several interconnected mechanisms. The table below summarizes the primary types of epigenetic modifications and their functions.
Table 1: Major Types of Epigenetic Modifications and Their Functions
| Modification Type | Chemical Change | General Effect on Transcription | Primary Enzymes Involved | Role in Tissue-Specificity |
|---|---|---|---|---|
| DNA Methylation | Methyl group added to cytosine in CpG dinucleotides [11] | Repression (typically) [11] | DNMT1, DNMT3A, DNMT3B [11] [14] | Stable, long-term silencing of pluripotency & germline genes during differentiation [11] |
| Histone Acetylation | Addition of acetyl group to lysine on histone tails [13] | Activation [13] | HATs, HDACs [12] | Creates transcriptionally permissive, open chromatin; responsive to cellular signals [13] |
| Histone Methylation | Addition of methyl group to lysine/arginine on histone tails [11] | Activation or Repression (context-dependent) [13] | KMTs, KDMs [12] | Persistent marking of active (H3K4me) or repressed (H3K27me) chromatin domains [15] |
| ncRNA Regulation | Expression of non-coding RNA (e.g., miRNA, lncRNA) [13] | Repression (typically) [14] | Dicer, RISC complex | Fine-tuning of gene expression; X-chromosome inactivation & genomic imprinting [11] |
These mechanisms do not operate in isolation. Complex crosstalk exists between them; for instance, DNA methylation can recruit proteins that promote histone deacetylation, leading to a repressive chromatin state [11]. Furthermore, as demonstrated in rice, specific "recruiter" proteins can simultaneously coordinate multiple epigenetic marks—such as DNA 6mA, H3K27me3, and RNA m5C—to regulate chromatin states and gene expression in specific tissues [16].
Troubleshooting Common Epigenetic Analysis Challenges
FAQ: How can I ensure the tissue specificity of my epigenetic findings when my sample is heterogeneous?
This is a common challenge, especially when studying tissues that are difficult to biopsy (e.g., brain, heart).
- Solution 1: Cell Sorting and Isolation: For tumor or immune diseases, use techniques like Fluorescence-Activated Cell Sorting (FACS) or Magnetic-Activated Cell Sorting (MACS) to isolate specific cell populations (e.g., CD133+/CD34+ cancer stem cells) from a heterogeneous tissue sample prior to epigenetic analysis [14].
- Solution 2: Laser-Capture Microdissection (LCM): This technique allows for the precise isolation of specific cell types from tissue sections based on morphology, often with the assistance of a clinical pathologist. After staining, target cells are isolated for downstream DNA or RNA extraction [14].
- Solution 3: Leverage Liquid Biopsies and In Silico Analysis: When tissue sampling is impossible, use liquid biopsies to analyze cell-free DNA (cfDNA) or exosomes, which can carry epigenetic information. Additionally, computational tools like GECSI can impute chromatin states in samples where only gene expression data is available, helping to infer epigenetic information for specific cell types or tissues [17].
FAQ: Why do I observe discrepancies between DNA methylation and gene expression data for a gene of interest?
DNA methylation in promoter regions is generally repressive, but the relationship is not always straightforward.
- Potential Cause 1: Context-Dependent Regulation. DNA methylation may not always be the primary driver of repression. The gene could be silenced by other, more dominant mechanisms, such as repressive histone marks (H3K27me3) [15] [18].
- Potential Cause 2: Regulatory Element vs. Promoter. The critical epigenetic regulation may be occurring at a distal enhancer rather than the core promoter. Use assays like ChIP-seq for H3K27ac or ATAC-seq to map active enhancers and investigate their methylation status [18].
- Potential Cause 3: Technical Artifacts. Ensure your bisulfite conversion is complete and efficient. Incomplete conversion can lead to false-positive methylation calls. Consider using enzymatic conversion methods like EM-seq to minimize DNA damage and improve accuracy [19].
FAQ: My chromatin immunoprecipitation (ChIP) yields low signal-to-noise. How can I optimize it?
Poor ChIP efficiency can result from suboptimal antibody specificity or chromatin preparation.
- Optimization 1: Validate Antibody Specificity. The quality of the antibody is the most critical factor. Use antibodies validated for ChIP applications. Include a positive control (a genomic region known to be enriched for the mark) and a negative control (a region known to be devoid of it) in every experiment.
- Optimization 2: Standardize Chromatin Fragmentation. The size of your chromatin fragments is crucial. Oversonication can destroy epitopes, while undersonication reduces resolution. Perform a sonication time-course and check fragment size (aim for 200–600 bp) on an agarose gel after reverse cross-linking [15].
- Optimization 3: Include Robust Controls. Always perform a mock IP with no antibody or an isotype control IgG. This helps distinguish specific enrichment from non-specific background [15].
Essential Experimental Protocols
Protocol 1: Chromatin Immunoprecipitation Followed by Sequencing (ChIP-seq)
ChIP-seq is a cornerstone method for mapping histone modifications and transcription factor binding sites genome-wide [12].
- Cross-linking: Fix protein-DNA interactions in cells or tissue with 1% formaldehyde for 10 minutes at 37°C. Quench with glycine.
- Cell Lysis and Chromatin Shearing: Lyse cells and isolate nuclei. Sonicate chromatin to fragment DNA to an average size of 200–600 bp. Troubleshooting: Optimize sonication conditions to avoid over- or under-fragmentation.
- Immunoprecipitation: Pre-clear chromatin with protein A/G beads. Incubate with a specific antibody against your target histone mark (e.g., H3K27ac) overnight. The next day, add beads to capture the antibody-chromatin complex.
- Washing and Elution: Wash beads stringently to remove non-specifically bound chromatin. Elute the immunoprecipitated DNA from the beads and reverse the cross-links.
- Library Preparation and Sequencing: Purify the DNA and construct a sequencing library for high-throughput sequencing.
The workflow and key decision points for a successful ChIP-seq experiment are summarized in the diagram below.
ChIP-seq Experimental Workflow
Protocol 2: Spatial Joint Profiling of DNA Methylome and Transcriptome (Spatial-DMT)
This cutting-edge protocol allows for the simultaneous measurement of both DNA methylation and gene expression in the native tissue context, providing an unprecedented view of the epigenetic landscape [19].
- Tissue Preparation: Collect and flash-freeze tissue of interest. Cryosection at desired thickness (e.g., 10 µm).
- HCl Treatment and Tagmentation: Treat fixed tissue sections with HCl to remove histones and disrupt nucleosomes. Perform Tn5 transposition to fragment gDNA and insert adapters.
- mRNA Capture and Reverse Transcription: Capture mRNA using a biotinylated poly-dT primer with UMIs. Synthesize cDNA.
- Spatial Barcoding: In a microfluidic device, flow two perpendicular sets of spatial barcodes (A1-A50 and B1-B50) to covalently label both gDNA fragments and cDNA, assigning a unique spatial coordinate to each tissue pixel.
- Library Separation and Construction: Separate barcoded gDNA and cDNA. For the gDNA library, perform enzymatic methyl-seq (EM-seq) conversion (an alternative to bisulfite treatment), followed by splint ligation and PCR. For the cDNA library, perform template switching and PCR amplification.
- Sequencing and Analysis: Sequence both libraries and use a dedicated computational pipeline to map DNA methylation and gene expression data back to the spatial barcodes.
The Scientist's Toolkit: Key Research Reagent Solutions
Table 2: Essential Reagents and Kits for Epigenetics Research
| Reagent / Kit | Primary Function | Key Considerations for Selection |
|---|---|---|
| Bisulfite Conversion Kit | Converts unmethylated cytosines to uracils for methylation sequencing [12] | Evaluate conversion efficiency; use EM-seq kits for less DNA damage [19] |
| ChIP-Validated Antibodies | Specific immunoprecipitation of histone-DNA complexes [15] | Must be validated for ChIP; check for specificity to the modification (e.g., H3K4me3 vs. H3K4me1) |
| ATAC-seq Kit | Maps genome-wide regions of open chromatin [12] | Optimized for low cell inputs (500 - 50,000 cells); can be combined with sequencing |
| Single-Cell / Spatial Multi-omics Kit | Co-profiling of epigenome and transcriptome from single cells or tissue sections [19] | Choose based on platform compatibility (e.g., 10x Genomics) and target (DNA methylation, chromatin accessibility) |
| DNMT/HDAC Inhibitors | Functional probes to test dependence on specific epigenetic mechanisms (e.g., 5-Azacytidine, Vorinostat) [12] | Use at established concentrations; monitor cell viability and offtarget effects |
Deciphering the intricate code of the epigenetic landscape is not merely an academic exercise; it is the key to unlocking reliable and therapeutically viable cell reprogramming. The challenges of maintaining tissue-specific function in reprogrammed cells—preventing reversion to a pluripotent state or transdifferentiation into an incorrect lineage—are fundamentally epigenetic in nature. By leveraging the troubleshooting guides, detailed protocols, and reagent knowledge outlined in this support document, researchers can systematically dissect the mechanisms that lock in cellular identity. Mastering the tools to read, write, and ultimately erase these epigenetic blueprints will accelerate the development of next-generation cell therapies and precision medicines for a wide range of diseases.
FAQs: Addressing Core Conceptual Challenges
FAQ 1: How do the hallmarks of aging specifically act as barriers to cellular reprogramming? The primary hallmarks of aging—such as telomere attrition, cellular senescence, and mitochondrial dysfunction—create a molecular environment that resists the epigenetic remodeling required for reprogramming. Telomere shortening acts as a signal for cell cycle arrest, preventing the rapid proliferation needed for reprogramming [20]. Senescent cells secrete pro-inflammatory factors (the Senescence-Associated Secretory Phenotype, or SASP), creating a local environment that inhibits reprogramming and can induce senescence in neighboring cells [21]. Mitochondrial dysfunction, characterized by failing energy production and increased reactive oxygen species (ROS), disrupts the delicate metabolic shifts required for successful reprogramming [22].
FAQ 2: What are the primary safety concerns when targeting aging hallmarks to improve reprogramming? The primary concern is the risk of teratoma formation and cancer promotion. Strategies that reactivate telomerase or use reprogramming factors like the Yamanaka factors (OSKM) can potentially lead to uncontrolled cell growth if not precisely controlled [21] [4]. For instance, while c-Myc enhances reprogramming efficiency, its exclusion from factor cocktails is often explored to reduce oncogenic risk [4]. Furthermore, senolytic therapies that clear senescent cells must be specific to avoid damaging healthy, essential cells. The use of partial reprogramming (transient expression of reprogramming factors) instead of full reprogramming is a key strategy to mitigate these risks by aiming to rejuvenate cells without fully erasing their identity [4].
FAQ 3: How can tissue-specific function be preserved when applying anti-aging interventions? Preserving tissue-specific function requires strategies that promote rejuvenation without causing full dedifferentiation. Partial reprogramming through short-term exposure to Yamanaka factors or specific chemical cocktails has been shown to reset epigenetic age and restore function in various tissues without completely erasing cellular identity [4]. Another approach is the generation of induced Tissue-Specific Stem (iTS) cells. This method involves transient overexpression of reprogramming factors combined with selection for tissue-specific markers (e.g., Pdx1 for pancreas), resulting in stem cells that are committed to a particular lineage and show no teratoma formation upon transplantation [23].
FAQ 4: What are the key biomarkers to monitor the successful overcoming of these barriers? Key biomarkers are aligned with the specific hallmark being targeted:
- Telomere Attrition: Telomere length and telomerase activity [20] [22].
- Cellular Senescence: Expression of p16INK4A and p21, SA-β-galactosidase activity, and levels of SASP factors (e.g., IL-6, IL-1β) [21].
- Mitochondrial Dysfunction: Mitochondrial Health Index (MHI), which integrates respiratory capacity and content, ROS levels, and markers of mitophagy [22].
- Overall Success: Advanced multi-omic aging clocks (epigenetic, transcriptomic), along with functional assays for tissue-specific performance, are critical for assessing rejuvenation [4].
Troubleshooting Guides
Guide 1: Overcoming Cellular Senescence in Reprogramming Experiments
Problem: Low reprogramming efficiency due to senescent cell presence.
Background: Cellular senescence is an irreversible cell arrest process that can be triggered by telomere attrition, mitochondrial damage, and other stressors. Senescent cells resist reprogramming and secrete SASP factors that can impair neighboring cells [21] [20].
Troubleshooting Steps:
| Step | Action | Rationale & Protocol Details | Expected Outcome |
|---|---|---|---|
| 1 | Pre-screen starting cell population. | Use SA-β-galactosidase staining and p16/p21 immunostaining on a sample of the cell population before initiating reprogramming. | Identifies the baseline level of senescence in the culture. |
| 2 | Apply senolytic treatment pre-conditioning. | Treat cells with senolytics (e.g., Dasatinib + Quercetin) for 48 hours before starting reprogramming. Remove senolytics and refresh media before factor induction [21]. | Selectively eliminates senescent cells, enriching for a population more amenable to reprogramming. |
| 3 | Modulate the SASP. | If senolytic pre-treatment is insufficient, consider adding an IL-6 or IL-1 receptor antagonist to the culture medium during the initial phase of reprogramming [21]. | Neutralizes the inhibitory inflammatory microenvironment created by residual senescent cells. |
Workflow Diagram: Overcoming Senescence Barriers
Guide 2: Rescuing Mitochondrial Dysfunction to Enhance Reprogramming
Problem: Reprogramming failure associated with low energy metabolism and high oxidative stress.
Background: Mitochondrial dysfunction is a hallmark of aging that can impede reprogramming, as this process requires significant energy and metabolic plasticity. Dysfunctional mitochondria produce excess ROS, causing oxidative damage and signaling stress pathways that inhibit reprogramming [22].
Troubleshooting Steps:
| Step | Action | Rationale & Protocol Details | Expected Outcome |
|---|---|---|---|
| 1 | Measure Mitochondrial Health. | Quantify the Mitochondrial Health Index (MHI) or assess mitochondrial membrane potential (ΔΨm) and ROS levels in starting cells using fluorescent probes (e.g., TMRM, MitoSOX) [22]. | Provides an objective baseline of mitochondrial function. |
| 2 | Boost NAD+ levels. | Supplement culture media with NAD+ precursors like Nicotinamide Riboside (NR) or Nicotinamide Mononucleotide (NMN) (e.g., 1 mM) throughout the reprogramming process [21] [22]. | Enhances oxidative phosphorylation, supports DNA repair, and improves mitochondrial function. |
| 3 | Induce mitophagy. | Treat cells with Urolithin A (e.g., 10 µM) or other mitophagy inducers to clear damaged mitochondria, facilitating a healthier mitochondrial network [21]. | Promotes turnover of dysfunctional mitochondria, reducing oxidative stress. |
Pathway Diagram: Mitochondria-Telomere Interplay in Reprogramming
Table 1. Therapeutic Strategies Targeting Key Aging Hallmarks
| Hallmark | Category | Example Therapeutics / Interventions | Key Experimental Outcomes |
|---|---|---|---|
| Cellular Senescence | Antagonistic | Senolytics (Dasatinib + Quercetin), Senolytic vaccines (anti-CD153, anti-GPNMB) [21] | Improved glucose tolerance, reduced senescent cell burden, extended lifespan in progeroid mice [21]. |
| Mitochondrial Dysfunction | Antagonistic | NAD+ boosters (NR, NMN), Mitophagy inducers (Urolithin A, MitoQ) [21] | Lower mitochondrial ROS, improved metabolic function, and direct association with telomerase maintenance in human PBMCs [22]. |
| Telomere Attrition | Primary | TA-65, TERT gene therapy, lifestyle interventions [21] | Telomere elongation, delayed onset of age-related pathologies like pulmonary fibrosis [21] [20]. |
| Epigenetic Alterations | Primary | Partial reprogramming (OSKM factors), Chemical cocktails (7c), HDAC inhibitors [21] [4] | Reversal of epigenetic age, restoration of visual function in mice, amelioration of transcriptome and metabolome [4]. |
Table 2. Key Research Reagent Solutions
| Reagent / Tool | Function / Mechanism | Example Application in Reprogramming |
|---|---|---|
| Yamanaka Factors (OSKM) [4] | Pioneer transcription factors that initiate epigenetic reprogramming. | Transient expression via plasmids or mRNA for partial reprogramming to reset cellular age without pluripotency. |
| Nicotinamide Riboside (NR) [21] [22] | NAD+ precursor that enhances mitochondrial function and supports DNA repair pathways. | Added to culture media (e.g., 0.5-1 mM) to improve the metabolic fitness of aged cells during reprogramming. |
| Senolytic Cocktail (D+Q) [21] | Dasatinib (a kinase inhibitor) and Quercetin (a flavonoid) selectively induce apoptosis in senescent cells. | Pre-treatment of cell populations (e.g., 48 hours) to remove senescence-related reprogramming barriers. |
| Urolithin A [21] | A natural compound that induces mitophagy, the selective clearance of damaged mitochondria. | Used in vitro (e.g., 10 µM) to improve overall mitochondrial quality and reduce oxidative stress in aged cells. |
| TERT Gene Therapy [21] | Activates telomerase, the enzyme that maintains and elongates telomeres. | Employed in experimental models to counteract telomere shortening-induced replicative senescence. |
Advanced Experimental Protocols
Protocol: Transient Reprogramming with Tissue-Specific Selection (iTS Cell Generation)
Objective: To generate induced Tissue-Specific Stem (iTS) cells from somatic tissues of aged models, minimizing teratoma risk [23].
Materials:
- Plasmid expressing OKS (Oct3/4, Klf4, Sox2) or OSKM factors.
- Tissue samples from target organ (e.g., pancreas, liver).
- Culture media supplemented with tissue-specific growth factors.
- Selection agents for tissue-specific markers (e.g., for Pdx1 in pancreas).
Methodology:
- Transfection: Isolate tissue from an aged donor (e.g., 24-week-old mouse). Transfect the tissue with the reprogramming factor plasmid on days 1, 3, 5, and 7.
- Selection and Culture: Plate the transfected cells under conditions that select for the expansion of cells expressing tissue-specific progenitor markers (e.g., Pdx1 for pancreatic iTS cells). This enriches for cells that have been partially reprogrammed toward a tissue-specific stem cell state, not a pluripotent state.
- Characterization: Confirm the absence of pluripotency markers (Oct3/4, Nanog) and the presence of tissue-specific progenitor markers (e.g., Sox17, Hnf4α, Pdx1) via RT-PCR.
- Safety Validation: Transplant up to 10 million iTS cells subcutaneously into immunodeficient mice. Monitor for at least 6 months for teratoma formation. iTS cells should not form teratomas, unlike iPS cells [23].
Protocol: Assessing the Mitochondrial Health-Telomerase Axis
Objective: To longitudinally investigate the relationship between mitochondrial health, telomerase activity, and telomere length in a cell population [22].
Materials:
- Peripheral Blood Mononuclear Cells (PBMCs) or target cell line.
- Equipment for measuring mitochondrial respiration (e.g., Seahorse Analyzer).
- Telomerase Repeat Amplification Protocol (TRAP) assay kit.
- qPCR kit for telomere length measurement.
Methodology:
- Baseline Measurement (T0): Isulate PBMCs. Measure:
- MHI: Calculate as mitochondrial respiratory capacity normalized to mitochondrial content [22].
- Telomerase Activity: Quantify using the TRAP assay.
- Telomere Length: Determine via qPCR.
- Longitudinal Measurement (T1): After a set period (e.g., 9 months in culture or in vivo), repeat all measurements on the same cell population.
- Data Analysis: Use path analysis to determine if baseline MHI predicts the change in telomerase activity (ΔTelomerase) over time, and if ΔTelomerase, in turn, predicts the change in telomere length (ΔTL). This model can reveal the indirect effect of mitochondrial health on telomere maintenance via telomerase [22].
The Balance Between Rejuvenation and Identity Loss in Reprogramming Strategies
Troubleshooting Guide: Common Challenges in Cellular Reprogramming
Problem 1: Incomplete Rejuvenation and Persistent Senescence Markers
Observation: After reprogramming, cells continue to exhibit markers of cellular aging, such as senescence-associated β-galactosidase (SA-β-Gal) activity, shortened telomeres, and elevated p16INK4A/p21CIP1 expression.
Underlying Cause: Cellular senescence acts as a potent barrier to complete reprogramming. Aged cells from older donors possess accumulated age-related damage that can resist erasure during standard reprogramming protocols [24].
Solutions:
- Six-Factor Cocktail Enhancement: Supplement the standard OSKM (OCT4, SOX2, KLF4, c-MYC) factors with NANOG and LIN28. This combination has successfully reversed replicative senescence in fibroblasts from 74-year-old donors and even centenarian cells [24].
- Senescence Pathway Inhibition: Temporarily inhibit key senescence effectors like p53 or p16INK4A during the initial reprogramming phase. However, this requires careful monitoring due to potential oncogenic risks.
- Extended Reprogramming Timeline: Allow for an extended reprogramming period (up to 35-40 days) as senescent cells may require more time to restart proliferation and complete the rejuvenation process [24].
Problem 2: Epigenetic Memory of Donor Cell Type
Observation: Induced pluripotent stem cells (iPSCs) or reprogrammed cells retain gene expression patterns and epigenetic marks characteristic of their original somatic cell type, which can bias subsequent differentiation toward lineages related to the donor cell.
Underlying Cause: Incomplete resetting of the epigenetic landscape, particularly at persistent "memory genes." This includes both "ON-memory" (persistent expression of donor cell-type specific genes) and "OFF-memory" (failure to reactivate genes silenced in the donor cell) [25].
Solutions:
- Chromatin Modifier Supplementation: Include small molecules or factors that promote epigenetic resetting, such as histone deacetylase inhibitors (e.g., VPA) or DNA methyltransferase inhibitors (e.g., 5-aza-dC) [24].
- Serial Reprogramming: Perform multiple rounds of reprogramming and differentiation to gradually dilute epigenetic memory.
- Selective Factor Expression: Utilize inducible systems for transient, high-expression of OCT4, which acts as a master regulator of epigenetic reprogramming and can help overcome memory barriers [26].
Problem 3: Loss of Tissue-Specific Function After Redifferentiation
Observation: Successfully reprogrammed and rejuvenated cells fail to regain full tissue-specific functionality when redifferentiated into target cell types.
Underlying Cause: The process of full reprogramming to pluripotency erases crucial epigenetic signatures necessary for proper tissue-specific function. This can include loss of mature metabolic profiles, signaling pathways, and structural characteristics [24].
Solutions:
- Partial Reprogramming Approaches: Utilize transient, non-integrating reprogramming factor delivery to avoid complete dedifferentiation. Short, cyclic expression of reprogramming factors can achieve rejuvenation while preserving cell identity [26].
- Directed Transdifferentiation: Bypass the pluripotent state entirely by using lineage-specific transcription factors to convert one differentiated cell type directly into another, preserving more of the original epigenetic context [3].
- Heterochronic Cues: Expose redifferentiating cells to youthful systemic factors or extracellular matrix components that promote functional maturation, mimicking a youthful microenvironment [27].
Problem 4: Tumorigenic Potential and Genomic Instability
Observation: Concerns about oncogenic transformation due to the use of reprogramming factors, particularly c-MYC, and the potential for genomic instability during the reprogramming process.
Underlying Cause: Integration of viral vectors, reactivation of oncogenes, incomplete epigenetic reprogramming, and selection of cells with pre-existing mutations that confer growth advantage [3] [24].
Solutions:
- Non-Integrating Delivery Methods: Utilize Sendai virus, episomal plasmids, mRNA transfection, or protein transduction to deliver reprogramming factors without genomic integration [28].
- c-MYC Alternatives: Replace c-MYC with other pro-proliferative factors like LMYC or GLIS1, or use small molecules that can perform similar functions without the same oncogenic potential.
- Suicide Genes: Introduce inducible suicide genes (e.g., caspase-9) into reprogrammed cells that can be activated if unwanted proliferation occurs, providing a safety switch for potential therapeutic applications [29].
Frequently Asked Questions (FAQs)
Q1: Can we achieve cellular rejuvenation without pushing cells through a pluripotent state? Yes, emerging strategies focus on partial reprogramming where transient expression of reprogramming factors resets age-related epigenetic markers without erasing cell identity. This approach has shown promise in reversing age-related changes while maintaining tissue-specific function [26].
Q2: How can we quantitatively measure the success of rejuvenation versus identity loss? Key metrics include DNA methylation clocks (e.g., epigenetic age estimation), transcriptomic analysis for tissue-specific gene expression patterns, functional assays specific to the cell type, and analysis of senescence markers (SA-β-Gal, p16INK4A). A successful outcome shows reversal of aging markers while retaining tissue-specific functionality [24].
Q3: What are the most persistent epigenetic barriers to complete identity resetting? The most challenging barriers include heterochromatic regions marked by H3K9me3, DNA methylation patterns at specific loci, and large organized chromatin K9 modifications (LOCKs). These repressive structures resist reprogramming factor binding and require extensive chromatin remodeling [30].
Q4: Are cells from older donors inherently more difficult to reprogram? While cellular senescence was initially considered a barrier, optimized protocols using six-factor combinations (OSKMNL) have successfully generated fully reprogrammed iPSCs from centenarian donor cells. However, efficiency may still be reduced compared to younger cells, requiring protocol adjustments [24].
Q5: How does epigenetic memory affect the therapeutic application of reprogrammed cells? Epigenetic memory can be both a friend and foe. While it may hinder differentiation into unrelated lineages, it can be advantageous when generating cell types related to the donor cell. For example, blood progenitor-derived iPSCs may differentiate more efficiently into hematopoietic lineages [25] [28].
Experimental Protocols for Balancing Rejuvenation and Identity
Protocol 1: Transient Partial Reprogramming for Rejuvenation
Objective: Achieve molecular rejuvenation without complete loss of cellular identity through cyclic, transient expression of reprogramming factors.
Methodology:
- Factor Delivery: Utilize non-integrating mRNA or Sendai virus to deliver OSKM factors to somatic cells.
- Inducible System: Employ a doxycycline-inducible system for precise temporal control (7-10 days expression).
- Intermediate State Capture: Monitor for early reprogramming markers (e.g., SSEA-1) but halt before full pluripotency markers (e.g., endogenous OCT4) emerge.
- Withdrawal and Assessment: Withhold inducing agents and allow cells to recover for 14 days before assessing rejuvenation markers and functional capacity.
Key Parameters:
- Duration: Short cycles (7-10 days) of factor expression prevent complete dedifferentiation.
- Monitoring: Track both senescence markers (SA-β-Gal) and lineage-specific markers throughout the process.
- Validation: Assess functional rejuvenation through stress response assays, metabolic profiling, and transplantation competence [26].
Protocol 2: Epigenetic Memory Erasure
Objective: Eliminate persistent donor cell gene expression patterns in reprogrammed cells.
Methodology:
- Chromatin Modifier Treatment: Treat reprogramming cells with small molecule inhibitors targeting H3K9 methyltransferases or DNA methyltransferases.
- Serial Reprogramming: Subject partially reprogrammed cells to a second round of reprogramming with altered factor ratios (increased OCT4).
- Differentiation Bias Testing: Differentiate the resulting iPSCs into multiple lineages and assess efficiency and functionality compared to donor cell-related lineages.
- Epigenetic Analysis: Perform whole-genome bisulfite sequencing and ChIP-seq for H3K4me3/H3K27me3 to verify epigenetic resetting.
Key Parameters:
- Timing: Apply epigenetic modifiers during the early-middle stages of reprogramming (days 5-12).
- Factor Ratio: Utilize 3:1 excess of OCT4 relative to other factors to enhance epigenetic resetting [26].
- Validation: Use single-cell RNA-seq to identify and quantify residual donor cell gene expression patterns [25].
Table 1: Reprogramming Efficiency Across Different Donor Ages and Conditions
| Donor Age/Condition | Reprogramming Factors | Efficiency | Time to iPSC Colonies | Key Observations |
|---|---|---|---|---|
| Young/Fetal [28] | OSKM | 0.1-1% | 14-21 days | Standard efficiency, minimal senescence |
| 74-year-old Proliferative [24] | OSKMNL | 0.06% | 35-40 days | Requires extended timeframe |
| 74-year-old Senescent [24] | OSKMNL | 0.06% | 35-40 days | Senescence reversal possible |
| Centenarian [24] | OSKMNL | ~0.06% | 35-40 days | Age-related changes reversible |
| Hematopoietic Progenitors [28] | OSKM | Up to 28% | 7-14 days | Highest efficiency due to native Sox2 expression |
Table 2: Molecular Hallmarks of Rejuvenation in Successfully Reprogrammed Cells
| Aging Hallmark | Pre-Reprogramming State | Post-Reprogramming State | Reversal Efficiency |
|---|---|---|---|
| Telomere Length [24] | Shortened | Reset to embryonic length | Complete |
| Gene Expression Profile [24] | Aged pattern | Embryonic stem cell pattern | Complete |
| Oxidative Stress [24] | Elevated | Reduced to ESC levels | Complete |
| Mitochondrial Metabolism [24] | Dysfunctional | Normalized | Complete |
| Epigenetic Memory [25] | N/A | Donor cell patterns may persist | Variable |
| Senescence Markers [24] | Elevated (SA-β-Gal, p16) | Eliminated | Complete |
Research Reagent Solutions
Table 3: Essential Reagents for Reprogramming and Rejuvenation Studies
| Reagent Category | Specific Examples | Function in Reprogramming | Considerations for Identity Preservation |
|---|---|---|---|
| Core Reprogramming Factors | OCT4, SOX2, KLF4, c-MYC (OSKM) [26] | Initiate epigenetic remodeling and pluripotency | OCT4 is master regulator; ratio critical (3:1 excess of OCT4 recommended) |
| Secondary Enhancers | NANOG, LIN28 [24] | Improve efficiency, help overcome senescence barriers | NANOG facilitates reprogramming in cell division rate-independent manner |
| Epigenetic Modulators | VPA (HDAC inhibitor), 5-aza-dC (DNMT inhibitor) [24] | Enhance chromatin accessibility, promote epigenetic resetting | Can increase off-target effects; requires careful titration |
| Non-Integrating Delivery Systems | Sendai virus, episomal plasmids, mRNA [28] | Deliver factors without genomic integration | Reduced tumorigenic risk but may lower efficiency |
| Senescence Inhibitors | p53 or p16INK4A shRNA [24] | Overcome proliferation barriers in aged cells | Transient inhibition recommended to avoid genomic instability |
| Metabolic Modulators | PS48 (activates PDK1), Forskolin [26] | Promote glycolytic shift enhancing reprogramming | Can influence redifferentiation capacity |
Signaling Pathways and Experimental Workflows
Diagram 1: Reprogramming Pathways and Identity Outcomes. This workflow illustrates the critical branch points where experimental parameters determine whether reprogramming leads to successful rejuvenation with maintained identity or loss of function.
Diagram 2: Molecular Interplay in Rejuvenation versus Identity Loss. This diagram shows the key molecular players and barriers in the balance between achieving cellular rejuvenation and maintaining original cellular identity during reprogramming strategies.
Precision Reprogramming Modalities: Achieving Rejuvenation Without Functional Loss
Frequently Asked Questions (FAQs)
Q1: What is the fundamental difference between full and partial reprogramming, and why is it critical for maintaining tissue-specific function?
Full reprogramming involves prolonged expression of reprogramming factors (e.g., OSKM) until a cell reaches a pluripotent state, which completely erases its original identity and is associated with teratoma formation [8]. Partial reprogramming, using short-term, transient expression of these factors, aims to reset the epigenetic age and reverse age-associated hallmarks without altering the cell's differentiated identity, which is essential for it to retain its tissue-specific function post-treatment [31] [32] [33].
Q2: What are the established cyclic induction protocols for in vivo partial reprogramming?
Several cyclic induction protocols have been successfully used in mouse models to achieve rejuvenation without reported teratomas. Key protocols are summarized in the table below.
| Model System | Reprogramming Factors | Induction Cycle | Key Outcomes | Primary Reference |
|---|---|---|---|---|
| LAKI (Progeroid) Mice | OSKM | 2 days ON / 5 days OFF (cyclic) | 33% lifespan extension; amelioration of cellular aging hallmarks [31]. | Ocampo et al., 2016 [31] |
| Wild-Type Mice | OSKM | Long-term (7-10 months) and short-term (1 month) cycles | Rejuvenated transcriptome, lipidome, and metabolome; improved skin regeneration [8]. | Ocampo et al., 2016 [8] |
| Old Wild-Type Mice | OSK (c-Myc excluded) | 1 day ON / 6 days OFF (cyclic) | 109% extension of remaining lifespan; improved frailty index scores [4]. |
Q3: How can I confirm that my partial reprogramming protocol has successfully rejuvenated cells without causing dedifferentiation?
Researchers should employ a multi-faceted validation strategy:
- Epigenetic Clocks: Use established DNA methylation clocks (e.g., Horvath's pan-tissue clock) to quantitatively measure the reversal of biological age [33] [34].
- Transcriptomic Analysis: Perform RNA sequencing to confirm that age-related gene expression pathways are reversed while cell identity genes remain expressed. The transcriptome of treated aged cells should cluster closer to that of young cells [33].
- Functional Assays: Assess the restoration of youthful function, such as improved mitochondrial function, reduced reactive oxygen species (ROS), and enhanced regenerative capacity in tissue-specific assays (e.g., human muscle stem cell transplantation) [31] [33].
- Pluripotency Marker Check: Verify the absence of pluripotency markers like Nanog and SSEA1 to rule out full reprogramming [31].
Q4: What are the primary safety concerns with transient OSK/OSKM expression, and how can they be mitigated?
The primary risks are teratoma formation from uncontrolled reprogramming and dysplastic cell proliferation [8] [34]. Mitigation strategies include:
- Cyclic, Transient Induction: Avoiding continuous factor expression is critical to prevent crossing the "point of no return" into pluripotency [31] [4].
- Excluding c-Myc: Omitting the oncogene c-Myc from the factor cocktail can reduce the risk of tumorigenesis, as demonstrated in lifespan-extension studies [4].
- Non-Integrating Delivery Methods: Using mRNA transfection or non-integrating viral vectors (e.g., AAV, Sendai virus) prevents permanent genomic alterations and allows for precise temporal control [33].
Troubleshooting Guides
Problem 1: Loss of Cellular Identity After Factor Induction
Potential Cause: The duration of reprogramming factor expression is too long, pushing cells past the point of no return toward pluripotency.
Solutions:
- Shorten Induction Time: Optimize the "ON" period of factor expression. In human cell studies, a 4-day transfection with OSKMLN mRNA was sufficient for rejuvenation without identity loss [33].
- Monitor Intermediate Markers: Regularly check for the loss of somatic cell markers (e.g., Thy1 for fibroblasts) and the emergence of early pluripotency markers (e.g., SSEA1) during protocol optimization [31].
- Employ Chemical Inhibitors: Utilize small molecule inhibitors that block the epithelial-mesenchymal transition (EMT) or enhance the stability of the somatic cell fate during the reprogramming pulse.
Problem 2: Insufficient Rejuvenation Phenotype
Potential Cause: The reprogramming induction is too short or too weak, failing to initiate significant epigenetic remodeling.
Solutions:
- Titrate Factor Dosage: Systematically vary the concentration of the reprogramming agents (e.g., mRNA amount, doxycycline concentration for inducible systems).
- Increase Cycle Number: Implement multiple cycles of induction. Studies in progeria mice used up to 35 cycles to achieve significant benefits [31].
- Combine with Pro-Rejuvenation Factors: Supplement the protocol with molecules known to enhance reprogramming efficiency and rejuvenation, such as Vitamin C, which acts as a cofactor for epigenetic enzymes like histone demethylases [35].
Problem 3: Teratoma Formation or Abnormal Cell Growth
Potential Cause: Incomplete or failed silencing of reprogramming factors, leading to sustained expression and dedifferentiation.
Solutions:
- Verify "OFF" System: Ensure that the inducible system (e.g., tet-on/off) has minimal leakiness and efficiently turns off after doxycycline removal.
- Use Non-Integrating Vectors: Prioritize mRNA or episomal vector systems that are diluted and degraded over time, preventing persistent factor expression [33].
- Employ OSK instead of OSKM: As a safer alternative, test protocols that use only Oct4, Sox2, and Klf4 (OSK), which have been shown to be effective for in vivo rejuvenation [4].
The Scientist's Toolkit: Key Research Reagents
This table details essential materials and their functions for setting up partial reprogramming experiments.
| Reagent / Tool | Function in Partial Reprogramming | Example Use Case |
|---|---|---|
| Doxycycline (Dox)-Inducible OSKM Cassette | Allows precise, temporal control of reprogramming factor expression in transgenic models [31] [8]. | The primary tool for in vivo cyclic reprogramming studies in mice [31]. |
| mRNA for OSKMLN Factors | A non-integrating method for transient factor expression; avoids genomic modification [33]. | Used to rejuvenate aged human fibroblasts and endothelial cells in vitro over a 4-day protocol [33]. |
| AAV9 Delivery Vectors | Efficient viral vector for in vivo gene delivery to a wide range of tissues without genomic integration [4]. | Used to deliver OSK factors to wild-type mice for lifespan studies [4]. |
| DNA Methylation Clock Assay | The gold-standard biomarker for quantitatively measuring biological age reversal [33] [34]. | Confirming the reduction in epigenetic age of human cells after mRNA treatment [33]. |
| Antibody for H3K9me3 | Detects levels of a key heterochromatin mark that is restored during rejuvenation [31]. | Immunofluorescence staining to show reversal of age-associated epigenetic changes [31] [33]. |
| Senescence-associated β-galactosidase Kit | Identifies and quantifies senescent cells, a population that should decrease after successful treatment [31]. | Assessing the reduction in cellular senescence in treated cell cultures or tissue sections [31]. |
Essential Experimental Protocols & Workflows
Core Protocol: Transient mRNA Transfection for Human Cell Rejuvenation
This protocol is adapted from the work of Sarkar et al., which demonstrated multifaceted amelioration of aging in naturally aged human cells [33].
- Cell Culture: Isolate and culture primary human cells (e.g., dermal fibroblasts, endothelial cells) from aged donors.
- mRNA Transfection: For four consecutive days, transfert cells with a cocktail of mRNAs encoding OCT4, SOX2, KLF4, c-MYC, LIN28, and NANOG (OSKMLN) using a non-integrating, lipid-based transfection reagent.
- Recovery: After the fourth transfection, return cells to standard culture medium without reprogramming mRNAs for 48 hours.
- Analysis: Harvest cells for analysis 6 days after the initial transfection. Key endpoints include RNA-seq for transcriptomic age, DNA methylation clock analysis, and functional assays for mitochondria, autophagy, and senescence markers.
The following workflow diagram illustrates the key steps and molecular changes in this partial reprogramming process.
Core Concept: The Balance Between Rejuvenation and Pluripotency
A central concept in partial reprogramming is navigating the process to achieve epigenetic resetting without loss of cell identity. The following diagram illustrates the critical windows for intervention.
The primary challenge in modern rejuvenation research is reversing cellular aging while maintaining a cell's specialized identity. The groundbreaking discovery that small molecule cocktails can reverse key hallmarks of aging without genetic engineering presents a transformative opportunity for therapeutic development [36]. This technical support center is designed to help researchers navigate the practical hurdles of implementing these protocols, with a core focus on preserving tissue-specific function throughout the reprogramming process. Below, you will find detailed troubleshooting guides, frequently asked questions, and essential resources to support your experimental work in this rapidly advancing field.
FAQs & Troubleshooting Guides
Cocktail Selection and Optimization
Q: What are the core small molecule cocktails available, and how do I choose between them?
A: Your choice depends on the balance you wish to strike between efficacy, toxicity, and your specific experimental model. The table below summarizes the two most discussed cocktails in the literature.
Table 1: Comparison of Core Chemical Reprogramming Cocktails
| Cocktail Name | Core Components | Key Reported Effects | Advantages & Limitations |
|---|---|---|---|
| 7c Cocktail [37] | CHIR99021, DZNep, Forskolin, TTNPB, Valproic Acid, RepSox, Tranylcypromine | Improves molecular hallmarks of aging in human cells [37]. | Advantage: Potent and well-characterized.Limitation: Includes some undesirably toxic molecules, which may limit in vivo applications [37]. |
| 2c Cocktail [38] [37] | RepSox and Tranylcypromine | Restores multiple aging phenotypes (genomic instability, epigenetic dysregulation, senescence, oxidative stress) in vitro and extends lifespan/healthspan in C. elegans [38] [37]. | Advantage: Simplified, less complex formulation; proven efficacy in an invertebrate model.Limitation: Reported to be more toxic in mice and confer fewer benefits than 7c in some contexts [37]. |
Troubleshooting Guide: Cocktail Toxicity
- Problem: Observed cell death or toxic stress responses in culture.
- Potential Causes & Solutions:
- Cause: Concentration of individual components is too high.
- Solution: Perform a dose-response curve for each molecule individually and in combination. Start with concentrations reported in foundational papers and titrate down.
- Cause: Specific molecule toxicity (e.g., components in the 7c cocktail).
- Solution: Consider switching to a simplified cocktail like the 2c combination [37]. Alternatively, attempt to identify and replace the most toxic component through systematic omission and screening.
- Cause: Cumulative toxic effect, particularly in vivo.
- Solution: For in vivo studies, optimize the dosing schedule (e.g., shorter pulses, longer rest periods) to allow for recovery and mitigate side effects like lipid droplet accumulation [37].
- Cause: Concentration of individual components is too high.
Monitoring Rejuvenation and Cellular Identity
Q: What robust assays can I use to confirm age reversal while ensuring my cells retain their identity?
A: A multi-faceted approach is necessary to confidently measure rejuvenation without dedifferentiation.
Table 2: Key Assays for Confirming Rejuvenation and Preserved Identity
| Assessment Goal | Recommended Assays | What to Measure |
|---|---|---|
| Confirming Age Reversal | Transcriptomic Aging Clocks [39] [40] | Genome-wide transcript profiles to calculate a "transcriptomic age"; successful reversal shows a younger profile. |
| Nucleocytoplasmic Compartmentalization (NCC) Assay [39] [40] | Monitor the leakage of nuclear proteins (e.g., mCherry-NLS) into the cytoplasm, a hallmark of aging that is restored upon rejuvenation. | |
| Senescence-Associated Beta-Galactosidase (SA-β-Gal) Staining | Assess the reduction in senescent cell burden. | |
| Verifying Maintained Identity | Cell-Type Specific Marker Expression (Immunofluorescence, qPCR) | Confirm continued expression of key proteins and genes that define the cell's original lineage (e.g., Tuj1 for neurons, Albumin for hepatocytes). |
| Functional Assays (Cell-Type Specific) | Test for maintained specialized function, such as contraction for cardiomyocytes or glucose response in beta-islet cells. |
Diagram 1: A workflow for concurrently assessing rejuvenation and cellular identity, integrating key assays from recent research.
Troubleshooting Guide: Loss of Cellular Identity
- Problem: Cells are losing lineage-specific markers or changing morphology after treatment.
- Potential Causes & Solutions:
- Cause: Treatment duration is too long, pushing cells toward a more pluripotent state.
- Cause: Cocktail is too potent or contains pro-dedifferentiation factors.
- Solution: Titrate down the concentration of the most potent reprogramming molecules. Focus on using fewer components, such as the 2c cocktail, which has shown efficacy without full pluripotency induction in some contexts [38].
In Vivo Application and Safety
Q: What are the key considerations and common pitfalls when translating these cocktails to animal models?
A: In vivo translation introduces significant complexity regarding delivery, efficacy, and safety.
Troubleshooting Guide: Lack of Phenotypic Benefit In Vivo
- Problem: The cocktail shows efficacy in vitro but fails to improve healthspan or reverse aging phenotypes in an animal model.
- Potential Causes & Solutions:
- Cause: Inefficient delivery to the target tissue.
- Solution: Explore different delivery vehicles (e.g., liposomes, nanoparticles) to improve bioavailability and tissue targeting.
- Cause: The cocktail itself may induce toxicity in vivo, as noted with the 2c combination in mice [37].
- Solution: Re-optimize the dosing regimen or reformulate the cocktail to reduce toxicity. Continuous monitoring for side effects, such as lipid droplet accumulation, is crucial [37].
- Cause: The model organism may metabolize the compounds too quickly.
- Solution: Investigate sustained-release formulations or more stable analog compounds.
- Cause: Inefficient delivery to the target tissue.
The Scientist's Toolkit: Essential Research Reagents
This table lists critical reagents and their functions as identified in recent studies on chemical reprogramming for age reversal.
Table 3: Key Research Reagent Solutions for Chemical Reprogramming
| Reagent / Tool | Function in Age Reversal Research |
|---|---|
| NCC Reporter System [39] [40] | A fluorescent-based tool (e.g., mCherry-NLS & eGFP-NES) to monitor the restoration of nucleocytoplasmic compartmentalization, a key indicator of youthful cellular physiology. |
| RepSox (in 2c/7c) [38] [37] | A small molecule inhibitor of the TGF-β pathway. It is a core component of simplified, effective reprogramming cocktails. |
| Tranylcypromine (in 2c/7c) [38] [37] | A lysine-specific demethylase 1 (LSD1) inhibitor. It modulates the epigenome and is a key component of the 2c cocktail. |
| Transcriptomic Aging Clocks [39] [40] | Computational models based on RNA-sequencing data to quantitatively measure the biological age of cells or tissues before and after treatment. |
| Chemical Cocktails (6-formulations) [36] | Six distinct combinations of small molecules identified to reverse transcriptomic age and restore a youthful NCC profile in less than a week. |
Diagram 2: The logical relationship showing how small molecule cocktails target multiple aging hallmarks to achieve rejuvenation while the protocol is designed to maintain cellular identity.
The field of chemical reprogramming for age reversal is advancing rapidly, moving from complex genetic factors to defined small molecule cocktails. Success hinges on the careful balancing of rejuvenation potency with the absolute imperative to maintain tissue-specific identity and function. The tools, troubleshooting guides, and FAQs provided here are designed to serve as a living resource for researchers navigating these challenges. As new cocktails and protocols emerge from foundational studies [38] [39] [36], this framework will support the rigorous experimentation required to translate these promising findings into safe and effective therapies.
Direct lineage conversion, or transdifferentiation, is a revolutionary strategy in regenerative medicine that allows for the direct reprogramming of one somatic cell type into another without passing through a pluripotent intermediate state [41] [42]. This approach offers a more direct, rapid, and potentially safer strategy for cell replacement therapies by avoiding the risks of tumorigenicity and uncontrolled proliferation associated with induced pluripotent stem cells (iPSCs) [41] [42]. This guide addresses the core principles, common experimental challenges, and troubleshooting strategies for researchers aiming to maintain tissue-specific function in reprogrammed cells.
FAQs: Core Concepts and Workflow Design
1. What are the primary advantages of direct lineage conversion over iPSC-based reprogramming for generating functional cells?
The key advantages are:
- Bypassing Pluripotency: Avoids the formation of teratomas and the risk of residual undifferentiated pluripotent cells [42].
- Speed and Efficiency: Enables more rapid production of target cells, often in half the time compared to methods requiring a pluripotent intermediate [43].
- Preservation of Epigenetic Age: Can maintain the epigenetic signature of the original somatic cell, which is crucial for modeling age-related diseases [44].
- Experimental Scalability: Simplified protocols are highly amenable to high-throughput phenotypic screening for drug discovery and toxicity testing, as demonstrated in platforms for generating induced hair cell-like cells (iHCs) for ototoxin screening [43] [45].
2. What are the main vector systems for delivering reprogramming factors, and how do I choose?
The choice of delivery system is critical for efficiency and clinical translation.
- Viral Vectors (Retro/Lentivirus): Offer high transduction efficiency and stable transgene expression but pose risks of insertional mutagenesis and immunogenicity. They are suitable for proof-of-concept studies [43] [45].
- Non-Viral, Virus-Free Inducible Systems: These systems (e.g., piggyBac transposons or integration into safe-harbor loci like CLYBL) allow for precise, temporal control of factor expression using an inducer like doxycycline. They significantly improve scalability, reproducibility, and safety, and are ideal for generating clinical-grade cells [43].
- Physical Delivery Methods (e.g., Tissue Nanotransfection - TNT): A novel non-viral platform using localized nanoelectroporation to deliver genetic material like plasmid DNA or mRNA directly into tissues in vivo. It offers high specificity, is non-integrative, and has minimal cytotoxicity [41].
- Small Molecules: Chemical compounds can modulate signaling pathways and epigenetic states to enhance reprogramming efficiency or even replace transcription factors. They are clinically attractive due to their cell permeability, transient action, and ease of standardization [44].
3. How does the starting cell type's "proliferation history" influence reprogramming efficiency?
Recent research highlights that a cell's proliferation history is a critical, often overlooked, factor. The cell state, set by its proliferation history, defines how it interprets the levels of transcription factors [46]. For example, in the conversion of fibroblasts to motor neurons, controlling for proliferation history and titrating the pioneer transcription factor Ngn2 was essential for achieving high conversion rates. Increasing the proliferation rate of adult human fibroblasts can subsequently enhance the generation of mature induced human motor neurons [46].
Troubleshooting Guide for Common Experimental Challenges
Table 1: Troubleshooting Low Reprogramming Efficiency and Cell Survival
| Problem | Possible Cause | Potential Solution |
|---|---|---|
| Low Reprogramming Efficiency | Incomplete transduction/transfection; suboptimal factor cocktail; viral silencing. | Use a virus-free, single-vector polycistronic system to ensure consistent co-expression of all factors [43]. Titrate transcription factor levels and consider the cell's proliferation history [46]. |
| Poor Cell Survival Post-Reprogramming | Stress from transfection/electroporation; metabolic strain; inappropriate culture conditions. | Supplement media with pro-survival small molecules like the ROCK inhibitor Y-27632 [44]. Optimize electroporation parameters (voltage, pulse duration) to ensure reversible nanopore formation [41]. |
| Incomplete Conversion/Mixed Cell Population | Transient or insufficient expression of reprogramming factors; lack of key maturation signals. | Extend the duration of reprogramming factor expression using a Doxycycline-inducible system [43]. Add small molecules that target epigenetic barriers (e.g., VPA) or key signaling pathways (e.g., CHIR99021 for Wnt activation) [44]. |
| Failure to Acquire Functional Properties | Immature or incomplete epigenetic remodeling; absence of key terminal differentiation factors. | Co-express lineage-specific pioneer transcription factors (e.g., SIX1 for hair cells) [43] [45]. Implement a sequential maturation protocol with defined growth factors and physiological cues post-reprogramming. |
Table 2: Addressing Phenotypic Instability and Scaling Challenges
| Problem | Possible Cause | Potential Solution |
|---|---|---|
| Phenotypic Instability/Reversion | Lack of a stable epigenetic landscape; persistent expression of original cell-type genes. | Ensure transient expression of reprogramming factors to allow the endogenous epigenetic network to take over [43]. Use CRISPR/dCas9-based epigenetic editors to lock in the new cell fate by modifying chromatin states at key loci [41]. |
| Inability to Scale Production | Reliance on inefficient viral methods or complex 3D cultures. | Adopt a virus-free, inducible system in a stable cell line for highly scalable and reproducible generation of target cells [43]. Utilize automated robotic systems in partnership with specialized biotech companies [47]. |
| High Variability Between Batches | Inconsistent reagent quality; fluctuations in cell culture conditions; heterogeneity of starting population. | Manufacture cells under Good Manufacturing Practice (GMP) conditions with rigorous quality control systems and standard operating procedures [48]. Use defined, xeno-free media and reagents. |
Essential Experimental Protocols
Protocol 1: Virus-Free, Inducible Direct Conversion to Hair Cell-Like Cells
This protocol is adapted from a study demonstrating highly efficient generation of human inner ear hair cell-like cells [43].
1. Principle: A stable human induced pluripotent stem (iPS) cell line is generated with a doxycycline-inducible cassette expressing the transcription factors SIX1, ATOH1, POU4F3, and GFI1 (SAPG) from a single promoter, targeted to a safe-harbor locus (e.g., CLYBL).
2. Key Reagents and Solutions:
- Stable iPS Cell Line: Harboring the inducible SAPG construct.
- Doxycycline Hyclate: Prepared as a stock solution in sterile water or DMSO.
- Basal Culture Medium: Appropriate for human iPS cell maintenance.
- Differentiation-Permissive Medium: May contain reduced growth factors and specific small molecules to promote differentiation.
3. Step-by-Step Methodology:
- Step 1: Maintenance. Culture the stable iPS cell line under standard conditions.
- Step 2: Induction. To initiate reprogramming, add Doxycycline (e.g., 1-2 µg/mL) to the culture medium. This triggers the simultaneous expression of all four SAPG factors.
- Step 3: Culture & Maturation. Maintain the cells in Doxycycline-containing, differentiation-permissive medium for 14-21 days, with regular medium changes.
- Step 4: Validation. Analyze the resulting cells (iHCs) for hair cell-specific markers (MYO7A, ESPIN) via immunostaining, and for electrophysiological properties using patch-clamp recording. Compare their transcriptomic profile to primary human fetal hair cells using single-cell RNA-seq [43].
4. Diagram: Virus-Free Direct Lineage Conversion Workflow
Protocol 2: Enhancing Reprogramming by Modulating Proliferation History
This protocol is based on findings that proliferation history and TF levels synergistically drive direct conversion to motor neurons [46].
1. Principle: Pre-conditioning the starting somatic cell population (e.g., fibroblasts) to a defined proliferative state significantly impacts how these cells interpret the levels of delivered transcription factors, thereby increasing conversion efficiency.
2. Key Reagents and Solutions:
- Proliferation Medium: Standard growth medium supplemented with serum and/or growth factors (e.g., FGF) to promote cell division.
- Quiescence Medium: A medium with low serum concentration (e.g., 0.5% FBS) to induce cell cycle arrest.
- Reprogramming Factors: A minimal cocktail of TFs for the target cell type (e.g., Ngn2, Isl1, Lhx3 for motor neurons).
3. Step-by-Step Methodology:
- Step 1: Pre-Conditioning. Split the starting fibroblast population and culture them in either Proliferation Medium or Quiescence Medium for a defined period (e.g., 48-72 hours).
- Step 2: Titration. Transduce the pre-conditioned cells with the reprogramming factors, using a range of viral titers (MOI) to achieve different levels of TF expression.
- Step 3: Conversion. Culture the transduced cells in motor neuron specification medium.
- Step 4: Analysis. Isolate cells based on both their proliferation history (e.g., using a tracer dye) and TF expression level (e.g., via a reporter) to accurately assess conversion rates. This reveals that high TF levels alone are insufficient; the cell state set by proliferation history is a critical co-factor [46].
4. Diagram: Proliferation History Impact on Conversion
The Scientist's Toolkit: Key Research Reagent Solutions
Table 3: Essential Reagents for Direct Lineage Conversion Experiments
| Reagent Category | Specific Examples | Function in Reprogramming |
|---|---|---|
| Transcription Factor Cocktails | SIX1, ATOH1, POU4F3, GFI1 (SAPG for hair cells) [43] [45]; Ngn2, Isl1, Lhx3 (for motor neurons) [46] | Master regulators that drive the gene expression program of the target cell type. |
| Small Molecule Enhancers | VPA (HDAC inhibitor); CHIR99021 (GSK-3 inhibitor); Repsox (TGF-β inhibitor); Y-27632 (ROCK inhibitor) [44] | Modulate epigenetic states, key signaling pathways, and cell survival to boost efficiency. |
| Vector/Delivery Systems | Doxycycline-inducible systems; Tissue Nanotransfection (TNT) devices; non-integrating episomal plasmids [43] [41] | Enable controlled, efficient, and safe delivery of genetic cargo into cells. |
| Cell Surface Markers | Antibodies against cell-type specific proteins (e.g., MYO7A for hair cells, TUJ1 for neurons) [45] [44] | Critical for identifying, sorting, and validating successfully reprogrammed cells via FACS or immunostaining. |
This technical support center addresses key challenges in Tissue Nanotransfection (TNT) and localized electroporation, with a specific focus on maintaining tissue-specific function post-reprogramming. The guides below provide targeted troubleshooting and methodologies to help researchers achieve stable, functional cellular phenotypes for regenerative medicine and drug development applications.
Frequently Asked Questions (FAQs)
FAQ 1: What is the core advantage of using TNT over viral vectors for in vivo cellular reprogramming?
TNT is a novel, non-viral nanotechnology platform for in vivo gene delivery and direct cellular reprogramming via localized nanoelectroporation [6] [41]. Its key advantages include:
- High Specificity and Minimal Immunogenicity: It avoids the off-target effects and immunotoxicity associated with biologically engineered viral vectors [6] [41].
- Non-Integrative Approach: TNT typically uses plasmid DNA or mRNA, which have transient expression profiles and minimize the risk of permanent genomic integration [6].
- Minimal Cytotoxicity: The nanoelectroporation process creates transient nanopores in the plasma membrane that reseal within milliseconds to seconds, preserving cellular viability [6].
FAQ 2: How can I maximize cell viability and transfection efficiency when optimizing electrical parameters?
The optimization of electrical pulse parameters—including voltage amplitude, pulse duration, and inter-pulse intervals—is critical for maximizing delivery efficiency while preserving cellular viability [6]. Using overly high voltage or incorrect pulse durations can lead to excessive cell death or inefficient transfection. Always refer to manufacturer-specific protocols for your electroporation device, as settings are not always transferable between systems [49].
FAQ 3: What are the primary causes of arcing during electroporation, and how can it be prevented?
Arcing (an electrical short circuit) is often caused by:
- High Salt Concentration in the DNA preparation or sample [50] [49] [51].
- Air Bubbles trapped in the cuvette [50] [49].
- High Cell Density in the sample [50].
- Impurities in sample components, such as glycerol [49]. Prevention methods include desalting DNA using microcolumn purification, tapping the cuvette to remove bubbles, ensuring cuvettes are cold (stored in the freezer), and diluting overly concentrated cell samples [49].
FAQ 4: For stable phenotypic outcomes, should I choose plasmid DNA or mRNA for TNT?
The choice depends on the desired duration and mechanism of expression, which is crucial for maintaining tissue-specific function:
- Plasmid DNA: Requires nuclear entry for transcription. Its use may lead to longer but still transient expression. Highly supercoiled, circular plasmids are more efficient than linear ones [6].
- mRNA: Allows for direct protein translation in the cytoplasm without nuclear entry, resulting in faster expression onset (within 1-4 hours) and a shorter duration (1-4 days). This eliminates the risk of genomic integration and is often considered simpler and more efficient [6] [52]. For direct lineage conversion where transient expression of reprogramming factors is sufficient to establish a stable new cell identity, mRNA can be an excellent choice to avoid any long-term genetic alteration.
FAQ 5: What strategies can be employed to ensure the stability of the reprogrammed tissue-specific phenotype?
Ensuring phenotypic stability after reprogramming is a central challenge. Key strategies include:
- Direct Lineage Conversion (Transdifferentiation): This approach converts one somatic cell type directly into another without passing through a pluripotent state, reducing the risk of tumorigenesis and uncontrolled proliferation [6] [53].
- Partial Cellular Rejuvenation: This strategy uses transient activation of reprogramming factors (e.g., OSKM) to reverse aging-related changes, such as resetting epigenetic markers and rejuvenating mitochondrial function, without fully altering cell identity [6] [54].
- Epigenetic Remodeling: Successful reprogramming involves epigenetic remodeling—changes in DNA methylation and histone modifications—that stabilize the new cell identity. Utilizing CRISPR/dCas9 systems fused to epigenetic effector domains can allow for more precise and stable epigenetic regulation at target loci [6].
Troubleshooting Guides
Guide 1: Low Transfection Efficiency
| Potential Cause | Recommended Solution |
|---|---|
| Sub-optimal electrical parameters | Re-optimize voltage, pulse duration, and interval for your specific cell type [50]. |
| Poor quality or quantity of genetic cargo | For DNA, check A260:A280 ratio (should be ≥1.6) and integrity on an agarose gel. Use highly concentrated plasmid for large constructs (>10 kb) [50]. For mRNA, ensure proper purification and handling. |
| Poor cell health or high passage number | Use healthy, low-passage cells that are actively dividing. Avoid using cells that are over-confluent, senescent, or stressed [50] [52]. |
| Low cargo concentration | Increase the concentration of DNA or RNA within the recommended range. For a large plasmid (e.g., 50 kb), you may need to use ~10 times more plasmid (e.g., 5 mg) compared to a standard 5.5 kb plasmid [50]. |
Guide 2: Low Cell Viability Post-Transfection
| Potential Cause | Recommended Solution |
|---|---|
| Excessive electroporation toxicity | Optimize electrical parameters to reduce intensity; ensure pulses are short and localized [6]. Use nanoelectroporation devices designed for minimal cytotoxicity [6]. |
| Reagent-specific toxicity | If using chemical transfection reagents for in vitro work, reduce reagent concentration or exposure time. Consider switching to lower-toxicity reagents [52]. |
| High cargo toxicity | Lower the amount of nucleic acid delivered, as high concentrations can be toxic to cells [52]. |
| Activation of immune responses | Use highly purified, endotoxin-free genetic cargo. For mRNA, consider chemically modified nucleotides (e.g., pseudouridine) to reduce immune activation [50] [52]. |
Guide 3: Instability of Reprogrammed Phenotype
| Potential Cause | Recommended Solution |
|---|---|
| Incomplete epigenetic remodeling | Utilize CRISPR/dCas9 systems fused to epigenetic modifiers (e.g., methyltransferases, demethylases) for targeted and stable epigenetic editing at key lineage-specific genes [6]. |
| Insufficient or transient factor expression | For direct reprogramming, ensure the delivery of an optimal combination and stoichiometry of transcription factors. Consider repeated, transient TNT treatments rather than a single application to reinforce the new transcriptional network. |
| Unsuitable cellular microenvironment | Co-deliver factors that promote the survival and integration of the newly reprogrammed cells, such as vascular endothelial growth factor (VEGF) for regenerated vasculature. Use 3D culture systems or in vivo models that provide appropriate niche signals. |
Experimental Parameters and Reagents
Table 1: Key Research Reagent Solutions
| Item | Function & Application |
|---|---|
| Hollow-Needle Silicon Chip | The core of the TNT device; concentrates the electric field to create transient nanopores for cargo delivery into target tissue [6]. |
| Supercoiled Plasmid DNA | A vector for gene delivery; highly supercoiled, circular forms are more efficient for transient transfection than linear DNA [6]. |
| In Vitro-Transcribed mRNA | Genetic cargo for direct protein translation in the cytoplasm; enables faster, promoter-independent expression without genomic integration risk [6] [52]. |
| CRISPR/dCas9 Effector Systems | A programmable platform for precise transcriptional activation or epigenetic remodeling without double-strand breaks, promoting stable gene expression changes [6]. |
| Endotoxin-Free Purification Kits | Essential for preparing pure genetic cargo to prevent immune activation (e.g., in monocytes/macrophages) and ensure high transfection efficiency [50]. |
Table 2: TNT and Standard Electroporation Parameters
| Parameter | Typical Range / Consideration |
|---|---|
| Pulse Duration | Millisecond range [6]. |
| Pore Resealing Time | Milliseconds to a few seconds post-pulse [6]. |
| Cell Confluency | Varies by cell type; generally 50-80% for in vitro transfection [52]. Avoid over-confluent cultures. |
| DNA Size Consideration | Efficiency drops for plasmids >15 kb with liposomes. For electroporation, use higher concentrations for large plasmids [50] [52]. |
| Cuvette Gap Size & Voltage | Voltage must be adjusted relative to the gap size of the electroporation cuvette to maintain consistent field strength (e.g., 1mm gap requires ~half the voltage of a 2mm gap) [49]. |
Workflow and Process Diagrams
TNT Workflow for Stable Phenotype
Phenotype Stability Factors
Troubleshooting Logic
Frequently Asked Questions (FAQs) & Troubleshooting
This section addresses common challenges in tissue-specific cellular reprogramming, providing evidence-based solutions for researchers.
FAQ 1: Why is the reprogramming efficiency of adult cardiac fibroblasts in vivo so low?
- Answer: Low efficiency in adult systems stems from several key barriers. Age-related epigenetic landscape makes adult and aged fibroblasts more resistant to fate change compared to neonatal cells [55]. Furthermore, the differentiation state of the fibroblast is critical; fully activated, ECM-producing myofibroblasts are significantly harder to reprogram than quiescent fibroblasts [55]. The densely cross-linked scar tissue in fibrotic regions also physically limits the penetration and distribution of reprogramming agents [55].
- Troubleshooting Guide:
- Challenge: Poor uptake of reprogramming factors in fibrotic tissue.
- Solution: Investigate viral vectors with superior tissue penetrance or explore non-viral delivery systems like Tissue Nanotransfection (TNT), which uses nanoelectroporation to enhance local delivery [6].
- Challenge: Age-associated resistance.
- Solution: Consider combining reprogramming factors with interventions that reduce mitochondrial oxidative stress or enhance autophagy, processes shown to improve reprogramming efficiency in aged cells [55].
- Challenge: Poor uptake of reprogramming factors in fibrotic tissue.
FAQ 2: How can I ensure the converted induced cardiomyocytes (iCMs) are mature and functionally integrate with host tissue?
- Answer: Functional maturation remains a major hurdle. iCMs often resemble fetal or neonatal cardiomyocytes in their structure and electrophysiology [56]. Successful integration requires not only electrical coupling but also mechanical connection to withstand contraction forces.
- Troubleshooting Guide:
- Challenge: Immature electrophysiological properties leading to arrhythmias.
- Solution: Perform rigorous electrophysiological analysis (e.g., patch-clamp) to confirm adult-like action potentials and regular calcium transients [57]. Co-delivery of maturation-associated microRNAs or small molecules may promote maturity.
- Challenge: Lack of synchronous contraction with host myocardium.
- Solution: Validate the expression and correct localization of key gap junction proteins like Connexin 43. Histological analysis should show well-developed sarcomeric structures and abundant mitochondria [57].
- Challenge: Immature electrophysiological properties leading to arrhythmias.
FAQ 3: What are the primary concerns regarding the in vivo delivery of reprogramming factors?
- Answer: The major concerns are off-target effects and immunogenicity. Viral vectors can transduce non-target cells, leading to unintended consequences, and may provoke an immune response [6]. Using integrating viruses also carries a risk of insertional mutagenesis [57].
- Troubleshooting Guide:
- Challenge: Off-target transduction in non-fibroblast cardiac cells.
- Solution: Employ fibroblast-specific promoters (e.g., Fsp1, Tcf21) to drive expression of reprogramming factors, restricting activity to the target cell population [55].
- Challenge: Safety concerns with viral vectors.
- Solution: Explore non-viral and non-integrating methods. Chemical reprogramming using small molecule cocktails is a promising alternative that reduces immunogenicity and avoids genetic integration [57]. Tissue Nanotransfection (TNT) is a non-viral physical method for localized, transient delivery of genetic cargo like plasmid DNA or mRNA [6].
- Challenge: Off-target transduction in non-fibroblast cardiac cells.
FAQ 4: After reprogramming astrocytes to neurons in stroke models, how can I confirm the new neurons are truly from astrocytes and not from existing neurons?
- Answer: This is a critical point of controversy in the field. Claims of reprogramming must be validated with rigorous lineage tracing.
- Troubleshooting Guide:
- Challenge: Leakage of astrocyte-specific promoters in viral systems at high doses, leading to false-positive results.
- Solution: Use a lineage-tracing system with a Cre-inducible reporter that is permanently activated only in the original target cell population (e.g., astrocytes). This definitively marks the cell lineage before and after conversion [58]. Always include controls with a reporter virus only (e.g., expressing mRuby2 without the reprogramming factor) to assess baseline labeling [58].
- Challenge: Low survival and integration of transplanted human fibroblast-derived neurons in the adult brain.
- Solution: A recent 3D reprogramming approach can overcome this. Reprogramming adult human dermal fibroblasts inside 3D suspension microcultures produces "induced neurospheroids" (3D-iNs) that are more robust and survive transplantation into the adult rodent brain much more effectively than neurons derived from 2D cultures [59].
- Challenge: Leakage of astrocyte-specific promoters in viral systems at high doses, leading to false-positive results.
FAQ 5: What methods are available for reprogramming without using genetic materials?
- Answer: Chemical reprogramming is the primary non-genetic method. It uses cocktails of small molecules to modulate signaling pathways and epigenetic states, directly inducing transdifferentiation.
- Troubleshooting Guide:
- Challenge: Lower efficiency compared to some genetic methods.
- Solution: Perform high-throughput screening to optimize the combination, concentration, and timing of small molecule administration. For example, one study achieved ~15% efficiency in reprogramming human urine cells into cardiomyocyte-like cells using a 15-molecule cocktail, with purity reaching over 96% after 60 days [57]. Using defined, xeno-free conditions can also improve consistency and safety profiles [57].
- Challenge: Lower efficiency compared to some genetic methods.
The tables below summarize key quantitative findings from recent studies to aid in experimental design and benchmarking.
Table 1: Cardiac Reprogramming Efficiency and Functional Outcomes
| Reprogramming Method | Starting Cell Type | Efficiency / Purity | Key Functional Metrics | Source Model |
|---|---|---|---|---|
| Small Molecule Cocktail | Human Urine-derived Cells (hUCs) | 15.08% (Day 30); 96.67% purity (Day 60) [57] | Ventricular-like action potentials; regular Ca²⁺ transients; improved ejection fraction post-MI [57] | Mouse & Porcine MI |
| In Vivo Reprogramming | Cardiac Fibroblasts (CFs) | Neonatal CFs >> Adult CFs (marked decline) [55] | Integration into myocardium; contributions to ventricular contractility [55] | Mouse MI |
| Extracellular Vesicles (Stem-EVs) | N/A (Paracrine effect) | N/A | Reduced inflammation, apoptosis, infarct size; improved cardiac functionality [56] | Animal MI Models |
Table 2: Neuronal Reprogramming Efficiency and Transplantation Success
| Reprogramming Method | Starting Cell Type | Efficiency / Yield | Neuronal Subtype | Transplantation Survival |
|---|---|---|---|---|
| NeuroD1 AAV Vector | Canine Astrocytes (in vivo) | Exploratory study; functional & anatomical recovery noted [58] | Not specified | N/A (In vivo model) |
| 3D Microculture Reprogramming | Adult Human Dermal Fibroblasts (hDFs) | 36-50% conversion to MAP2+ neurons [59] | Predominantly GABAergic [59] | High; produces neuron-rich grafts in adult rodent brain [59] |
| 2D Culture Reprogramming | Adult Human Dermal Fibroblasts (hDFs) | Suboptimal long-term viability in vitro [59] | Various | Poor survival in adult brain [59] |
Experimental Protocols
This protocol details a xeno-free, non-genetic method for generating autologous cardiomyocytes.
- Key Reagents: DMEM/F12 and Keratinocyte SFM medium (1:1), Fetal Bovine Serum (FBS), Small Molecule Cocktail (15 compounds, see "Research Reagent Solutions").
- Procedure:
- Cell Isolation & Culture: Collect fresh urine sample (∼50 mL). Centrifuge at 500 × g for 5 min. Resuspend cell pellet in culture medium (DMEM/F12:KSFM, 5% FBS, 1% penicillin/streptomycin, 10 ng/mL EGF). Seed cells at 1 × 10⁴ cells/well in a 24-well plate. Culture at 37°C with 5% CO₂.
- Reprogramming Induction: Once hUCs reach 70-80% confluency, initiate reprogramming by switching to induction medium containing the defined small molecule cocktail.
- Maintenance & Maturation: Refresh the induction medium every two days. Over time (30-60 days), cells will gradually adopt a cardiomyocyte-like morphology. Purity can be assessed via immunofluorescence for cardiac markers (e.g., cTnT, α-actinin).
- Functional Validation:
- Immunofluorescence: Confirm expression of cardiomyocyte markers and sarcomeric structure.
- Patch-clamp Recording: Verify the presence of ventricular-like action potentials.
- Calcium Imaging: Document regular intracellular calcium transients.
- Thesis Context: This protocol is highly relevant for a thesis focusing on autologous, clinically translatable cell sources that avoid immune rejection and the ethical concerns of pluripotent stem cells.
This protocol describes a method for neuronal replacement directly in the brain post-stroke.
- Key Reagents: AAV9-GFAP(short)-Cre (2.4E13 GC/mL), AAV9-CAG-DIO-NeuroD1-T2A-mRuby2 (1.0E13 GC/mL) or control virus AAV9-CAG-DIO-mRuby2.
- Procedure:
- Stroke Induction: Under general anesthesia, perform a transient occlusion of the middle cerebral artery (MCAO) in canines to induce an ischemic stroke.
- Viral Injection: Seven days post-stroke, inject the AAV viral system (both GFAP-Cre and DIO-NeuroD1-mRuby2) stereotactically into the peri-infarct region. The 7-day post-stroke timing targets the peak of astrocyte activation.
- Analysis:
- Behavioral: Assess functional recovery over weeks using a neurological severity score (NSS).
- Anatomical: Use MRI scanning to monitor changes in infarct volume and ventricle enlargement.
- Cellular: Perform immunohistochemistry on brain sections to identify mRuby2-labeled cells and co-stain for neuronal (NeuN, MAP2) and astrocytic (GFAP) markers to confirm conversion and assess glial activation.
- Thesis Context: This large-animal model protocol is essential for a thesis aiming to bridge the gap between rodent studies and human clinical applications, addressing scalability and translational potential.
Signaling Pathways & Workflows
The following diagrams illustrate the core workflows and logical relationships in the discussed reprogramming strategies.
Diagram 1: Cardiac Reprogramming Workflow
Diagram 2: Neuronal Reprogramming Strategy
The Scientist's Toolkit: Research Reagent Solutions
This table catalogs essential reagents and their functions for designing reprogramming experiments.
Table 3: Key Reagents for Tissue Reprogramming
| Reagent / Tool | Function / Purpose | Example Use Case |
|---|---|---|
| AAV9 Serotype | Efficient transduction of neuronal and cardiac tissues; crosses blood-brain barrier poorly but good for direct injection [58]. | In vivo delivery of NeuroD1 to astrocytes using a GFAP promoter [58]. |
| GFAP Promoter | Drives gene expression specifically in astrocytes (both resting and reactive). Expression is upregulated in reactive astrocytes post-injury [58]. | Targeting astrocytes for reprogramming in stroke models [58]. |
| NeuroD1 | A pro-neuronal transcription factor that can directly reprogram astrocytes and other cells into functional neurons [58]. | Primary factor for astrocyte-to-neuron conversion in stroke repair [58]. |
| Small Molecule Cocktail | Chemically induces cell fate conversion by modulating signaling pathways and epigenetic states; non-immunogenic and allows temporal control [57]. | Reprogramming human urine cells into cardiomyocytes under xeno-free conditions [57]. |
| Tissue Nanotransfection (TNT) | A non-viral, nanoelectroporation platform for highly localized in vivo delivery of genetic cargo (pDNA, mRNA, CRISPR/Cas9); minimizes off-target effects [6]. | Potential alternative to viral vectors for delivering reprogramming factors to skin or accessible organs. |
| 3D Suspension Microcultures | Provides a protective 3D environment that enhances reprogramming robustness and enables transplantation without dissociation, improving graft survival [59]. | Generating transplantable induced neurons from adult human dermal fibroblasts [59]. |
| Fsp1 / Tcf21 Promoter | Fibroblast-specific promoters used to drive expression of reprogramming factors specifically in cardiac fibroblasts, reducing off-target effects [55]. | Targeted in vivo reprogramming of cardiac fibroblasts into cardiomyocytes. |
Navigating Reprogramming Challenges: Safety, Efficiency, and Microenvironmental Barriers
Troubleshooting Guides
Guide 1: Addressing Spontaneous Differentiation Post-Reprogramming
Problem: Differentiated cells appear in culture after reprogramming, potentially compromising tissue-specific function.
- Potential Causes and Solutions:
- Cause: Overly confluent cultures or overgrown colonies.
- Solution: Passage cultures when colonies are large and compact but before they overgrow. Ensure cell aggregates are evenly sized during passaging [60].
- Cause: Old or suboptimal culture medium.
- Solution: Ensure complete cell culture medium is less than two weeks old [60].
- Cause: Extended exposure to non-incubator conditions.
- Solution: Minimize time culture plates are out of the incubator to less than 15 minutes [60].
Guide 2: Managing Low Cell Survival After Transduction/Transfection
Problem: High cytotoxicity observed post-transduction with reprogramming factors.
- Potential Causes and Solutions:
- Cause: Expected cytotoxicity from high viral uptake and transgene expression.
- Solution: This is often an indication of high transduction efficiency. Continue culturing cells according to the protocol; cytotoxicity affecting >50% of cells 24-48 hours post-transduction can be expected [61].
- Cause: Use of a full set of reprogramming factors including c-Myc.
- Solution: Consider using a three-factor (OKS) protocol excluding c-Myc, which can reduce oncogenic risk and potentially improve cell survival, albeit with potentially lower reprogramming efficiency [23].
Guide 3: Ensuring Complete Clearance of Reprogramming Vectors
Problem: Residual reprogramming vectors, particularly those containing oncogenes like c-Myc, persist in cells.
- Potential Causes and Solutions:
- Cause: Inefficient clearance of non-integrating viral vectors.
- Solution: For Sendai virus-based systems, incubate iPSCs at 38–39°C for 5 days to clear temperature-sensitive mutants of c-Myc and KOS. Perform this only after more than 10 passages and after confirming via RT-PCR that the Klf4 vector is absent [61].
Frequently Asked Questions (FAQs)
FAQ 1: Why is c-MYC considered a higher oncogenic risk compared to other Yamanaka factors?
c-MYC is a potent classical oncogene frequently overexpressed in numerous cancers and is a strong driver of cell proliferation and tumorigenesis [62] [63]. Studies show that excluding c-MYC from the reprogramming cocktail (using OKS instead of OSKM) significantly reduces tumorigenic potential. While OSKM plasmids generated teratomas in mouse models, iTS cells generated with OKS showed no teratoma formation upon transplantation [23].
FAQ 2: What are the practical methods for controlling reprogramming duration to minimize oncogenic risk?
The two primary strategies are transient transfection and partial reprogramming.
- Transient Transfection: Using non-integrating plasmids or RNA viruses (e.g., Sendai virus) that are diluted and cleared over cell passages, preventing stable genomic integration [23] [61].
- Partial (Short-Term) Reprogramming: Applying reprogramming factors for a short, controlled duration. In vivo studies use cycles (e.g., 2-day ON, 5-day OFF) to rejuvenate cells without fully reprogramming them to a pluripotent state, thus reducing teratoma risk [4].
FAQ 3: Can we completely eliminate tumorigenic risk in reprogrammed cells?
While risk can be significantly mitigated, complete elimination requires rigorous validation. Key strategies include:
- Factor Exclusion: Omitting c-MYC from reprogramming cocktails [23].
- Tissue-Specific Selection: Using selectable markers (e.g., Pdx1 for pancreatic progenitors) to derive induced tissue-specific stem (iTS) cells, which have shown no teratoma formation in vivo [23].
- Extended Monitoring: No teratoma formation was observed in immunodeficient mice transplanted with iTS cells over at least a 6-month observation period [23].
Experimental Protocols & Data
Protocol 1: Generation of Non-Tumorigenic Induced Tissue-Specific Stem (iTS) Cells
This protocol is adapted from methods shown to generate iTS cells from pancreatic tissue without teratoma formation [23].
- Source Tissue: Isolate tissue from the organ of interest (e.g., pancreas, liver).
- Reprogramming Factor Delivery: Transfect tissue with a single plasmid expressing Oct3/4, Sox2, and Klf4 (OKS), excluding c-Myc. Transfect on days 1, 3, 5, and 7.
- Tissue-Specific Selection: Culture emerging cells under conditions that select for tissue-specific progenitor markers (e.g., Pdx1 for pancreatic iTS cells, HNF4α for hepatic iTS cells).
- Clone Isolation: Isolate and expand colonies with self-renewal capacity and morphology distinct from fibroblasts or pluripotent stem cells.
- Validation:
- PCR Analysis: Check for the absence of plasmid integration in the host genome.
- RT-PCR: Confirm expression of endodermal/tissue-specific progenitor markers (e.g., Sox17, Hnf4α, Pdx1) and the absence of high-level pluripotency markers (Oct3/4, Sox2, Nanog).
- Teratoma Assay: Transplant up to 10 million cells subcutaneously into immunodeficient mice (e.g., NOD/scid) and monitor for at least 6 months for teratoma formation.
Quantitative Data on Teratoma Formation
Table 1: Teratoma Formation Potential of Different Cell Types [23]
| Cell Type | Injected Cell Number | Mice with Teratomas / Total Mice Injected | Observation Period (Days) |
|---|---|---|---|
| Embryonic Stem (ES) Cells | 1 x 10⁶ | 5 / 5 | 60 |
| Induced Pluripotent Stem (iPS) Cells | 1 x 10⁶ | 5 / 5 | 60 |
| Induced Tissue-Specific Stem (iTS) Cells | 1 x 10⁶ | 0 / 5 | 180 |
| Induced Tissue-Specific Stem (iTS) Cells | 1 x 10⁷ | 0 / 5 | 180 |
This protocol describes cyclic induction for partial reprogramming in transgenic mice.
- Animal Model: Use inducible transgenic mice (e.g., LAKI mice) carrying a tetracycline (dox)-inducible polycistronic OSKM or OSK cassette.
- Cyclic Induction: Administer doxycycline cyclically to activate transgene expression. A common cycle is a 2-day "pulse" of dox followed by a 5-day "chase" without dox.
- Monitoring: Repeat cycles for the desired duration (e.g., 35 cycles over several months). Monitor for healthspan and lifespan indicators, including weight, frailty index, and tissue function.
- Safety Assessment: Perform histological analysis of major tissues post-treatment to confirm the absence of teratomas.
Visualizations
Diagram 1: Reprogramming Paths to Mitigate Oncogenic Risk
Diagram 2: c-MYC Sensing and Inhibition Circuit
The Scientist's Toolkit
Table 2: Key Research Reagents for Safe Reprogramming
| Reagent | Function | Application Note |
|---|---|---|
| OKS Plasmid | Expresses Oct3/4, Sox2, Klf4 without c-Myc. | Reduces oncogenic risk compared to OSKM. More efficient at generating iTS cells than OKS alone [23]. |
| Tissue-Specific Selection Markers (e.g., Pdx1, HNF4α) | Enriches for tissue-specific progenitors during reprogramming. | Critical for deriving pure populations of iTS cells that do not form teratomas [23]. |
| Non-Integrating Vectors (e.g., Sendai Virus, Plasmids) | Delivers reprogramming factors without genomic integration. | Essential for clinical safety. Allows for transient expression and eventual clearance of factors [23] [61]. |
| ROCK Inhibitor (Y-27632) | Improves survival of single cells and newly passaged cells. | Use during passaging of sensitive cell lines to enhance cell viability, especially when handling low-confluency cultures [61] [60]. |
| c-MYC-Based Sensing Circuit (cMSC) | Genetic circuit activated only by aberrantly high c-MYC levels. | Enables specific targeting of MYC-high cells for therapeutic intervention, a novel strategy to overcome tumor heterogeneity [63]. |
Technical Support & Troubleshooting Hub
Frequently Asked Questions (FAQs)
Q1: My immunoblot shows no phospho-Smad2/3 signal in my TGF-β-stimulated fibroblasts, despite using a recommended protocol. What could be wrong? A: A lack of phospho-Smad2/3 signal often relates to issues with latent TGF-β activation or pathway inhibition.
- Latent TGF-β Not Properly Activated: Remember that most secreted TGF-β is in a latent complex. Ensure you are using an activation step. Common methods include:
- Transient Acidification: Briefly treat conditioned medium with 1N HCl (e.g., 10 µL per 100 µL medium) for 10 minutes on ice, then neutralize with an equal volume of 1N NaOH [64].
- Heat Activation: Incubate samples at 80°C for 10 minutes, though this can be less specific.
- Proteolytic Activation: Use plasmin or matrix metalloproteinases (MMPs) like MMP2/MMP9, which physiologically activate TGF-β in the ECM [65].
- Check for Contamination: Ensure your cells and reagents are not contaminated with microbial products that can inadvertently activate TGF-β via toll-like receptors or integrins.
- Pathway is Being Inhibited: Your cells or serum might have high levels of endogenous inhibitory Smads (Smad6/7). Perform a positive control using a known potent activator like the integrin αVβ6 or a high concentration of active TGF-β1 (e.g., 5-10 ng/mL) [64] [66].
Q2: I am observing high background SMAD signaling in my control hepatic stellate cells (HSCs) without exogenous TGF-β stimulation. How can I reduce this? A: High background signaling is a common issue, often caused by autocrine TGF-β signaling or suboptimal culture conditions.
- Use a Defined, Low-TGF-β Serum: Standard fetal bovine serum (FBS) contains high levels of TGF-β. Use charcoal-dextran stripped FBS or a defined, serum-free medium specifically formulated for HSCs.
- Neutralize Autocrine Signaling: Pre-treat your cells for 1-2 hours with a neutralizing TGF-β antibody (e.g., 1D11) or a TGF-β receptor kinase inhibitor (e.g., SB-431542 at 10 µM). This can help establish a true baseline before your experiment [66].
- Validate Quiescence State: Confirm the phenotype of your HSCs. Early passage HSCs may spontaneously activate in culture, increasing autocrine TGF-β signaling. Use early passages and characterize your cells with markers like α-SMA and Collagen I.
Q3: When testing a new TGF-β inhibitor, what are the key controls to include to ensure its effect is specific to the pathway? A: A robust experimental design is crucial for validating inhibitor specificity.
- Control for Off-target Effects: Include a structurally similar but inactive analog of the inhibitor, if available.
- Monitor Multiple Pathway Nodes: Don't rely solely on p-Smad2/3. Use a panel of readouts to confirm specificity:
- Cell Viability Assay: Always run a parallel viability assay (e.g., MTT, ATP-lite) to ensure that the observed effects are not due to cytotoxicity.
Q4: What is the best method to quantify collagen deposition in my in vitro fibrosis model to assess the efficacy of my intervention? A: While hydroxyproline assay is a gold standard, it is destructive and low-throughput. Consider these options:
- Sirius Red/Fast Green Staining: A colorimetric method that allows for selective quantification of total collagen (Sirius Red) and non-collagenous protein (Fast Green) from the same well. It is more amenable to medium-throughput formats.
- Immunofluorescence for Collagen I: Use high-content imaging to quantify Collagen I fibrils. This provides spatial information and can be highly quantitative.
- AI-Powered Image Analysis: For advanced quantification, tools like PathExplore Fibrosis can be used to analyze whole-slide images of stained cultures, providing detailed metrics on collagen fiber morphology and spatial organization, even from standard H&E stains [68].
- qPCR for ECM Genes: Measure mRNA levels of COL1A1, COL3A1, and FN1 as an early, but indirect, indicator of fibrotic response.
Troubleshooting Guide: Common Experimental Pitfalls
Table: Common Issues and Solutions in TGF-β/Fibrosis Research
| Problem | Potential Cause | Recommended Solution |
|---|---|---|
| High variability in myofibroblast differentiation assays | Inconsistent cell seeding density; variable HSC activation between passages. | Standardize passage number and seeding density; use a quantitative readout like flow cytometry for α-SMA. |
| Poor efficacy of a TGF-β inhibitor in an animal model | Inefficient delivery to the fibrotic niche; off-target degradation. | Formulate the inhibitor for targeted delivery (e.g., using albumin or nanoparticle carriers); validate target engagement in tissue. |
| Failed ChIP assay for Smad3/4 complex | Over-fixation leading to epitope masking; weak antibody affinity. | Optimize cross-linking time (try 10-15 min); validate antibody with a positive control cell line known to have strong Smad binding. |
| Discrepancy between Smad signaling and functional outcomes (e.g., cell migration) | Dominance of non-Smad pathways (e.g., MAPK, PI3K) in the specific cellular context. | Inhibit the canonical Smad pathway (e.g., Smad3 siRNA) and non-canonical pathways (e.g., PI3K inhibitor) to dissect their individual contributions. |
Core Experimental Protocols
Protocol 1: Activating and Quantifying Canonical TGF-β/Smad Signaling
Objective: To reliably stimulate the TGF-β pathway and measure downstream Smad2/3 phosphorylation and nuclear translocation.
Methodology:
- Cell Stimulation:
- Serum-starve cells (e.g., primary fibroblasts or hepatic stellate cells) for 4-6 hours.
- Stimulate with 2-5 ng/mL of active, recombinant TGF-β1 (or other isoforms) for timepoints ranging from 30 minutes (peak phosphorylation) to 24-48 hours (gene expression changes).
- For inhibition assays, pre-treat cells with your chosen inhibitor (e.g., 10 µM SB-431542) for 1-2 hours before adding TGF-β.
Cell Lysis and Immunoblotting:
- Lyse cells in RIPA buffer supplemented with phosphatase and protease inhibitors.
- Resolve 20-30 µg of total protein by SDS-PAGE.
- Transfer to PVDF membrane and probe with the following antibodies:
- Primary Antibodies: Anti-phospho-Smad2 (Ser465/467)/Smad3 (Ser423/425), anti-total Smad2/3, and a loading control (e.g., GAPDH).
- Use chemiluminescence for detection and quantify band intensity.
Immunofluorescence for Nuclear Translocation:
- Plate cells on glass coverslips.
- After stimulation, fix with 4% PFA for 15 min, permeabilize with 0.1% Triton X-100, and block.
- Incubate with anti-Smad2/3 antibody overnight at 4°C, followed by a fluorescent secondary antibody and DAPI.
- Image using a confocal microscope. Quantify the nuclear-to-cytoplasmic fluorescence intensity ratio of Smad2/3 using image analysis software (e.g., ImageJ).
Protocol 2: Assessing Myofibroblast Transdifferentiation
Objective: To quantify the activation of fibroblasts or hepatic stellate cells into α-SMA-positive myofibroblasts, the key effector cells in fibrosis.
Methodology:
- Induction of Transdifferentiation:
- Treat cells with 2-5 ng/mL TGF-β1 for 48-72 hours to induce activation.
- Include control groups and inhibitor-treated groups.
Flow Cytometry for α-SMA:
- Harvest cells using trypsin-EDTA and fix with 4% PFA for 15 min.
- Permeabilize cells with ice-cold 90% methanol for 30 minutes on ice.
- Stain with an antibody against α-SMA conjugated to a fluorophore (e.g., FITC) for 1 hour at room temperature.
- Analyze on a flow cytometer. The percentage of α-SMA-positive cells and the mean fluorescence intensity (MFI) are direct measures of myofibroblast activation.
Functional Collagen Gel Contraction Assay:
- Mix cells with a neutralized type I collagen solution in a 24-well plate and allow it to polymerize.
- After polymerization, carefully release the gels from the well walls and add medium with or without TGF-β and/or inhibitors.
- After 24-48 hours, photograph the gels and measure the gel area using ImageJ. A smaller area indicates greater contractile force, a hallmark of myofibroblasts.
Signaling Pathway & Experimental Workflow Visualization
Experimental Workflow for TGF-β Inhibition Studies
The Scientist's Toolkit: Key Research Reagents
Table: Essential Reagents for TGF-β and Fibrosis Research
| Reagent / Tool | Function / Target | Key Application in Research |
|---|---|---|
| Recombinant Active TGF-β1/2/3 | Ligand replacement; pathway stimulation. | The gold standard for activating the TGF-β pathway in vitro to model fibrotic stimulation [65] [64]. |
| SB-431542 | Small-molecule inhibitor of ALK5 (TβRI). | A widely used tool compound to selectively block canonical TGF-β Smad signaling in mechanistic studies [67] [66]. |
| TGF-β Neutralizing Antibody (e.g., 1D11) | Binds and neutralizes all TGF-β isoforms. | Used to block autocrine and paracrine TGF-β signaling in cell culture and animal models [66]. |
| Pirfenidone | Approved anti-fibrotic with pleiotropic effects, including TGF-β suppression. | A clinical benchmark in fibrosis research; used as a positive control in vitro and in vivo to validate anti-fibrotic efficacy [67] [66]. |
| siRNA/shRNA for Smad2/3/4 | Gene knockdown of key signaling mediators. | Essential for establishing the specific functional contribution of the canonical Smad pathway versus non-canonical pathways [66]. |
| Anti-α-SMA Antibody | Marker of activated myofibroblasts. | The primary readout for quantifying fibroblast-to-myofibroblast transdifferentiation via flow cytometry or immunofluorescence [69] [66]. |
| Anti-phospho-Smad2/3 Antibody | Detects activated (phosphorylated) R-Smads. | The key antibody for monitoring proximal TGF-β pathway activation by immunoblot or imaging [64] [66]. |
| PathExplore Fibrosis (AI Tool) | AI-based quantification of fibrosis from histology. | Provides high-throughput, unbiased quantification of collagen fiber morphology and spatial organization from standard H&E slides [68]. |
Addressing Cellular Heterogeneity and Senescence in Target Tissues
➤ Troubleshooting Guides and FAQs
FAQ: Characterizing Senescent Cells
Q1: My senescence assays (e.g., SA-β-Gal) show inconsistent results within the same cell population. Is this normal, and how should I interpret this?
A: Yes, this is a common observation and a direct manifestation of senescent cell heterogeneity. Senescent cells are not a uniform population. The expression of senescence markers can vary significantly based on the cell's origin, the senescence-inducing stimulus, and the specific cell-cycle arrest state.
- Recommended Action: Do not rely on a single senescence biomarker. Implement a multi-marker validation strategy. The table below summarizes key markers and their interpretations.
Table 1: Core Senescence Biomarkers for Validation
| Biomarker | Detection Method | Expected Change in Senescence | Technical Considerations |
|---|---|---|---|
| SA-β-Gal | Histochemical Staining | ↑ Activity at pH 6.0 [70] | A gold standard but can be influenced by lysosomal mass and confluence. |
| p16INK4A | Immunocytochemistry, Western Blot | ↑ Protein Expression [71] | A core regulator of the senescence growth arrest; highly specific. |
| p21 | Immunocytochemistry, Western Blot | ↑ Protein Expression [70] | Often an early, p53-driven response to damage. |
| Lamin B1 | Immunocytochemistry, Western Blot | ↓ Protein Expression [70] | Loss indicates nuclear envelope alterations. |
| γH2AX | Immunofluorescence (Foci) | ↑ Foci Formation [70] | Marker for DNA Damage Response (DDR); indicates persistent DNA damage. |
| SASP Factors (e.g., IL-6) | ELISA, PCR | ↑ Secretion/Expression [72] [70] | Measures the paracrine signaling activity. |
Q2: I am using reprogramming factors (e.g., OSKM) on aged somatic cells. How can I manage the risk of senescence being induced in a subset of cells, which may then impact the tumor microenvironment via SASP?
A: This is a critical consideration. Research confirms that the introduction of reprogramming factors can indeed trigger a senescence program in some cells as a barrier to full reprogramming [72]. The resulting SASP from these cells can have dual, context-dependent effects: it may paradoxically enhance the plasticity of neighboring cells or promote a pro-tumorigenic microenvironment.
- Recommended Action:
- Monitor SASP Secretion: Quantify key SASP factors like IL-6 in your conditioned media using ELISA.
- Consider Partial/Transient Reprogramming: Shorter, non-continuous exposure to reprogramming factors has been shown to rejuvenate cells and reduce senescence markers without pushing cells through a full pluripotency transition, thereby lowering tumorigenic risk [72].
- Employ Senolytics Post-Reprogramming: After the reprogramming phase, consider a treatment with senolytic drugs (e.g., Dasatinib + Quercetin) to selectively eliminate any senescent cells that may have arisen, thereby cleansing your culture [71].
FAQ: Technical and Analytical Challenges
Q3: How can I account for senescent cell heterogeneity in my data analysis, especially when using bulk sequencing techniques?
A: Bulk techniques mask the diversity of senescent states. Moving to single-cell resolution is the most robust solution.
- Recommended Action: Utilize single-cell RNA sequencing (scRNA-seq) to unravel the heterogeneity. Recent pan-cancer studies have used this approach to define distinct molecular subgroups of senescence (e.g., Inflamm-aging, DNA Damage Response, Autophagy) from a single, seemingly homogeneous cell population [73]. Furthermore, dedicated computational tools have been developed specifically for senescence identification at the single-cell level (e.g.,
scSen). These tools can help you trajectory analysis, revealing how cells transition into different senescent states [74].
Table 2: Key Research Reagent Solutions
| Reagent / Tool | Function | Example Application |
|---|---|---|
| OSKM Factors (Oct4, Sox2, Klf4, c-Myc) | Somatic Cell Reprogramming | Inducing pluripotency or, via transient expression, cellular rejuvenation [72]. |
| ABT263 (Navitoclax) | Senolytic Drug | Selectively induces apoptosis in senescent cells by targeting Bcl-2 family proteins [70]. |
| Dasatinib + Quercetin (D+Q) | Senolytic Cocktail | A first-generation senolytic combination; effective in clearing various senescent cell types [71]. |
| High-Content Imaging System | Single-Cell Analysis | Quantifies multiple senescence markers (SA-β-Gal, γH2AX, Lamin B1) at a single-cell level to assess heterogeneity [70]. |
| scRNA-seq Platforms | Single-Cell Transcriptomics | Unbiased profiling of cellular heterogeneity and identification of senescent subpopulations [73] [74]. |
Q4: What are the key experimental variables that most significantly impact the functional heterogeneity of senescent cells in my model?
A: Two major variables are the cell type of origin and the senescence-inducing stimulus. Furthermore, recent evidence highlights that the cell cycle phase at the time of arrest is a critical, underappreciated factor.
- Recommended Action: Carefully document and standardize your senescence induction protocol. Be aware that:
- Cell Cycle Status: Senescent cells arrested in the G2 phase have been shown to express higher levels of SA-β-Gal and p21, secrete more IL-6, and are more sensitive to the senolytic drug ABT263 compared to senescent cells arrested in the G1 phase [70]. This has profound implications for designing senolytic therapies.
- Induction Method: Replicative, DNA-damage-induced (e.g., irradiation), and oncogene-induced senescence can lead to distinct SASP profiles and functional outcomes.
➤ Detailed Experimental Protocols
Protocol 1: High-Content Analysis of Senescent Cell Heterogeneity
This protocol is adapted from research using high-content imaging to identify functionally distinct senescent subpopulations based on cell cycle status [70].
Objective: To quantify senescence heterogeneity and response to senolytics at a single-cell level.
Materials:
- Primary human cells (e.g., HMVEC-L endothelial cells or IMR-90 fibroblasts).
- Senescence inducer (e.g., 10 Gy ionizing radiation).
- Staining reagents: SA-β-Gal staining kit, EdU proliferation kit, antibodies for γH2AX, Lamin B1, p21, HMGB1.
- Low-serum medium (e.g., 0.5% FBS).
- High-content/confocal microscope with automated image analysis software (e.g., Nikon Eclipse Ti with NIS-Elements).
Methodology:
- Senescence Induction: Culture cells and expose to ionizing radiation (e.g., 10 Gy). Maintain irradiated (SEN) and mock-irradiated control (CTL) cells for 10-14 days post-irradiation to establish senescence.
- Quiescence Control (Optional but Recommended): Three days before analysis, switch a subset of CTL cells to low-serum medium (SS condition) to induce quiescence. This allows you to distinguish senescence from reversible cell cycle arrest.
- Staining:
- Co-stain cells for SA-β-Gal and EdU (to assess lysosomal activity and proliferation, respectively).
- In parallel, perform immunocytochemistry for a panel of markers: γH2AX (DNA damage), Lamin B1 (nuclear integrity), p21 (cell cycle arrest), and HMGB1 (cytoplasmic release indicates altered function).
- Image Acquisition & Analysis:
- Use an automated microscope to acquire images from at least 10,000 cells per condition.
- Employ segmentation algorithms to identify individual nuclei and cytoplasm.
- Extract single-cell intensity data for all markers.
- Data Interpretation:
- Use multiparameter analysis (e.g., PCA or clustering) to identify subpopulations (e.g., G1-arrested vs. G2-arrested senescent cells).
- Correlate marker expression with functional assays, such as IL-6 secretion (via ELISA on conditioned media) or sensitivity to senolytics.
Protocol 2: Assessing the Impact of SASP on Cellular Reprogramming
This protocol investigates the paracrine crosstalk between senescent cells and cells undergoing reprogramming [72].
Objective: To determine if SASP from senescent cells facilitates or hinders the reprogramming of neighboring cells.
Materials:
- "Feeder" cell line (to be induced into senescence).
- "Reporter" cell line (e.g., fibroblasts with a genetically encoded pluripotency marker, like Oct4-GFP).
- OSKM lentivirus or sendai virus.
- Transwell co-culture system.
- ELISA kits for IL-6 and other SASP factors.
Methodology:
- Generate Conditioned Media (CM): Induce senescence in the "feeder" cell population. Collect the culture media (SASP-CM) after 48-72 hours. Centrifuge to remove cells and debris.
- Setup Co-culture Experiment:
- Group 1 (Test): Reporter cells undergoing OSKM reprogramming + SASP-CM.
- Group 2 (Control): Reporter cells undergoing OSKM reprogramming + fresh media.
- Group 3 (SASP Control): Reporter cells + SASP-CM (no OSKM).
- Perform Reprogramming: Transduce reporter cells with OSKM factors. After 24 hours, replace media with the respective conditioned or fresh media. Refresh media every other day.
- Quantify Reprogramming Efficiency:
- Monitor and count the number of Oct4-GFP positive colonies after 2-3 weeks.
- Alternatively, use flow cytometry to quantify the percentage of cells expressing pluripotency markers (e.g., SSEA-1, TRA-1-60).
- Correlation: Measure the concentration of SASP factors (e.g., IL-6) in the CM from Step 1 and correlate it with the reprogramming efficiency in Group 1.
➤ Signaling Pathways and Workflows
Senescence and Reprogramming Crosstalk
Experimental Workflow for Heterogeneity Analysis
Optimizing Pulse Cycles and Dosage for In Vivo Reprogramming Efficiency
Frequently Asked Questions (FAQs) & Troubleshooting Guides
FAQ 1: What are the primary strategies for optimizing reprogramming factor delivery in vivo to avoid tumorigenesis?
A primary strategy is the use of partial reprogramming, which involves shortened, cyclic expression of reprogramming factors rather than continuous expression [75]. This approach aims to reset aging markers without fully dedifferentiating cells to a pluripotent state, thereby avoiding teratoma formation [76] [75]. For instance, a cyclic regimen of 2 days of induction followed by 5 days of withdrawal of the Yamanaka factors (OSKM) has been shown to ameliorate cellular and physiological hallmarks of aging in progeroid mouse models without causing teratomas [75]. Another key strategy is cell-type specific reprogramming, which can be achieved by using tissue-specific promoters or local delivery methods to restrict factor expression to the target organ [75].
- Troubleshooting Guide: Observation: Teratoma formation in target tissues after factor induction.
- Potential Cause: Continuous, unregulated expression of reprogramming factors, particularly OSKM, leading to full dedifferentiation into pluripotent cells [76] [75].
- Solution:
- Implement a cyclic induction protocol (e.g., 2 days on/5 days off) instead of continuous induction [75].
- Consider using a reduced set of factors (e.g., OSK without c-Myc) to reduce oncogenic potential [77].
- Utilize non-integrating delivery vectors (e.g., Adeno-Associated Viruses - AAVs) for transient expression [75].
- Employ tissue-specific promoters to limit the expression of reprogramming factors to the desired cell type [75].
FAQ 2: How do different delivery systems impact the efficiency and safety of in vivo reprogramming?
The choice of delivery system is critical as it affects the kinetics, stability, and safety of reprogramming factor expression [6].
- Troubleshooting Guide: Observation: Low reprogramming efficiency or high immune response/inflammation at the delivery site.
- Potential Cause:
- Low Efficiency: Inefficient transfection/transduction of target cells. For viral vectors, this could be due to low viral titer or poor tropism for the target tissue. For non-viral methods like Tissue Nanotransfection (TNT), suboptimal electrical pulse parameters could be the cause [6].
- High Immune Response: This is commonly associated with the use of viral vectors, such as adenoviruses, which can trigger a strong immune reaction [6].
- Solution:
- For Viral Vectors: Optimize viral titer and serotype for your target tissue. Consider using AAVs for lower immunogenicity [75].
- For Non-Viral Physical Methods (e.g., TNT): Optimize electrical pulse parameters (voltage, pulse duration, inter-pulse intervals) to maximize delivery efficiency while preserving cell viability [6].
- For Chemical Methods: Optimize the formulation of nanoparticles or chemical carriers to improve stability and cellular uptake while reducing cytotoxicity [6].
- Potential Cause:
FAQ 3: What are the key parameters to optimize for non-viral delivery methods like Tissue Nanotransfection (TNT)?
For TNT, a non-viral nanoelectroporation platform, optimization focuses on the device's physical parameters and the genetic cargo [6].
- Troubleshooting Guide: Observation: High cell death following TNT application or insufficient cargo delivery.
- Potential Cause: Suboptimal electrical pulse parameters leading to irreversible membrane damage, or degradation of genetic cargo before delivery.
- Solution:
- Systemically test and optimize pulse parameters (voltage amplitude, pulse duration, number of pulses) [6].
- Ensure the genetic cargo (e.g., plasmid DNA, mRNA) is highly purified and optimized for stability. Supercoiled circular DNA plasmids are more efficient than linear ones [6].
- For CRISPR/Cas9 applications, use optimized ribonucleoprotein (RNP) complexes or mRNA for Cas9 delivery to minimize off-target effects and reduce immunogenicity [6].
The tables below summarize key quantitative data from research on pulse cycles and delivery systems for in vivo reprogramming.
Table 1: Optimized In Vivo Reprogramming Pulse Cycles
| Reprogramming Factor Cocktail | Model System | Pulse Cycle Regimen | Key Outcomes | Primary Reference |
|---|---|---|---|---|
| OSKM (Yamanaka factors) | Progeroid mice | Cyclic: 2 days ON / 5 days OFF | Ameliorated aging hallmarks, extended lifespan, no teratomas [75]. | Ocampo et al. [75] |
| OSKM (Yamanaka factors) | Old mice (124-week-old) | Single administration via AAV | Extended lifespan by 109% [75]. | [75] |
| OSK (Yamanaka factors minus c-Myc) | Old mice | AAV-mediated delivery | Showed potential for rejuvenation without c-Myc [75]. | [75] |
Table 2: Comparison of Delivery Systems for In Vivo Reprogramming
| Delivery System | Key Features | Pros | Cons |
|---|---|---|---|
| Viral Vectors (Lentivirus, Retrovirus) | Integrates into host genome for stable expression [77]. | High transduction efficiency; stable long-term expression [77]. | Risk of insertional mutagenesis; immunogenicity; difficult to control dosage [6] [77]. |
| Adeno-Associated Virus (AAV) | Non-integrating; episomal persistence [75]. | Lower immunogenicity; good safety profile; suitable for transient/cyclic expression [75]. | Limited cargo capacity; potential pre-existing immunity [6]. |
| Tissue Nanotransfection (TNT) | Non-viral; nanoelectroporation via silicon chip [6]. | High specificity; minimal cytotoxicity; non-integrative; enables delivery of DNA, mRNA, CRISPR/Cas9 [6]. | Requires physical access to tissue; optimization of pulse parameters needed [6]. |
Detailed Experimental Protocols
Protocol 1: Implementing a Cyclic Partial Reprogramming Regimen In Vivo
This protocol is adapted from studies demonstrating the safe amelioration of aging phenotypes in mice [75].
- Animal Model: Use a reprogrammable mouse model (e.g., carrying a doxycycline (Dox)-inducible polycistronic cassette encoding OSKM at the Rosa26 or Col1a1 locus) [75].
- Induction Agent Administration: Administer Dox (typically in chow or drinking water) to initiate the expression of OSKM factors.
- Pulse Cycle: Follow a cycle of 2 consecutive days of Dox administration, followed by 5 days of withdrawal (standard chow/water) [75].
- Monitoring: Continue this cyclic regimen for several weeks to months. Monitor animals for:
- Modulation: The cycle (e.g., 1 day ON/6 days OFF) can be adjusted based on the model's tolerance and the desired therapeutic effect.
Protocol 2: Optimizing TNT for In Vivo Cellular Reprogramming
This protocol outlines the key steps for using TNT to deliver reprogramming factors [6].
- Device Preparation: Sterilize the TNT silicon chip, typically using ethylene oxide gas or gamma irradiation to preserve its nanoarchitecture [6].
- Cargo Loading: Fill the cargo reservoir of the TNT device with the purified genetic material. For reprogramming, this could be:
- Application:
- Place the TNT device directly onto the surface of the target tissue (e.g., skin, exposed organ).
- Connect the device to a pulse generator and apply a series of optimized electrical pulses.
- Pulse Parameter Optimization: Critical parameters to test are voltage (e.g., 100-200 V), pulse duration (milliseconds), and number of pulses. The goal is to create transient nanopores without causing significant cell death [6].
- Validation: After transfection, monitor the tissue for:
- Transfection Efficiency: Using a reporter gene (e.g., GFP).
- Reprogramming Success: Via immunohistochemistry for target cell markers (e.g., cardiac Troponin T for cardiomyocytes) and functional assessment.
Signaling Pathways & Experimental Workflows
The following diagrams illustrate the conceptual workflow for partial reprogramming and the critical signaling nodes involved in the process.
Partial Reprogramming Workflow
Key Molecular Mechanisms in Reprogramming
The Scientist's Toolkit: Research Reagent Solutions
Table 3: Essential Reagents for In Vivo Reprogramming Research
| Reagent / Material | Function in Experiment | Key Considerations |
|---|---|---|
| Doxycycline (Dox)-Inducible System (Tet-On) | Allows precise temporal control over the expression of reprogramming factors in transgenic animal models [75]. | Enables the implementation of critical pulse cycles; Dox concentration and administration route (chow vs. water) must be optimized. |
| Adeno-Associated Virus (AAV) Vectors | A non-integrating viral vector for delivering reprogramming factors in vivo [75]. | Select serotype based on target tissue tropism; consider cargo capacity limits; allows for transient expression suitable for partial reprogramming. |
| Tissue Nanotransfection (TNT) Device | A physical platform for non-viral, localized gene delivery via nanoelectroporation [6]. | Enables delivery of various genetic cargo (DNA, mRNA, CRISPR); requires optimization of electrical pulse parameters for each tissue type. |
| Plasmid DNA / mRNA Cargo | The genetic material encoding reprogramming factors (e.g., OSKM, GMT) [6]. | Plasmid DNA must be highly purified and supercoiled. mRNA offers rapid, transient expression without nuclear entry. |
| HDAC Inhibitors (e.g., Valproic Acid) | Small molecules that promote an open chromatin state by inhibiting histone deacetylases, enhancing reprogramming efficiency [78]. | Can be used as a supplement to transcription factor-based reprogramming to lower epigenetic barriers. |
Ensuring Long-Term Phenotypic Stability and Preventing Identity Reversion
Frequently Asked Questions (FAQs)
Q1: What are the primary causes of identity reversion in reprogrammed cells? Identity reversion, where cells lose their tissue-specific functions, often occurs due to incomplete reprogramming or the use of overly potent reprogramming factors that push cells toward a pluripotent state. The key challenge is balancing rejuvenation—reversing age-related cellular changes—with the preservation of cellular identity. Using partial reprogramming protocols, rather than full reprogramming to pluripotency, helps maintain the original cell type's function and characteristics [4].
Q2: How can we ensure that rejuvenated cells maintain their tissue-specific function over the long term? Ensuring long-term function requires that the reprogramming process does not fully erase the cell's epigenetic identity. Strategies include:
- Transient Factor Expression: Using cyclic induction of reprogramming factors (e.g., 2-day on, 5-day off schedules) to allow cells to regain their function after treatment [4].
- Chemical Reprogramming: Utilizing non-genetic, small-molecule cocktails (e.g., the "7c" cocktail) that can be less potent than genetic factors, potentially offering a safer and more controllable profile for maintaining identity [4].
- Tissue-Specific Promoters: Driving the expression of reprogramming machinery with promoters that are active primarily in the target cell type, thereby restricting the effect to desired tissues [79].
Q3: What are the main safety concerns with in vivo reprogramming, and how can they be mitigated? The primary safety concerns are teratoma formation and unwanted dedifferentiation. These risks can be mitigated by:
- Excluding Oncogenes: Omitting potent oncogenes like c-Myc from the reprogramming factor cocktail [4].
- Partial Reprogramming: Carefully controlling the duration and intensity of reprogramming factor expression to avoid complete erasure of cellular identity [4].
- Advanced Delivery Systems: Employing sophisticated gene therapy vectors (e.g., AAV9) that offer better tissue targeting and transient expression, reducing the risk of off-target effects [4].
Troubleshooting Guide
Table 1: Common Problems and Solutions in Cellular Reprogramming
| Problem | Possible Cause | Solution / Recommended Action |
|---|---|---|
| Loss of tissue-specific markers | Over-reprogramming; factor expression too strong or prolonged | Shorten the induction pulse; titrate down the concentration of inducing agents (e.g., doxycycline); use factor cocktails without c-Myc [4]. |
| Low rejuvenation efficiency | Suboptimal factor delivery; inefficient epigenetic remodeling; cellular senescence | Validate delivery system efficiency (e.g., viral titer); use chemical cocktails that target different epigenetic pathways (e.g., 7c); pre-treat senescent cells with senolytics [4] [80]. |
| Unwanted editing in non-target cell types | Lack of specificity in Cre-LoxP system; promoter leakiness | Switch to a CRISPRi-based system, which demonstrates improved cell type-specificity over Cre-LoxP due to its dose-dependence [79]. |
| Inconsistent results between experiments | Variable recombination efficiency in Cre-LoxP systems | Optimize inter-loxP distance (keep it below 4 kb for wildtype loxP sites); use Cre-driver strains aged 8-20 weeks; prefer heterozygous floxed alleles [81]. |
Experimental Protocols for Key Techniques
Protocol 1: In Vivo Partial Reprogramming with Doxycycline-Cycling
Objective: To reverse age-related phenotypes in tissues without causing teratomas or loss of cellular identity.
Materials:
- Transgenic mice with a doxycycline (dox)-inducible polycistronic OSK or OSKM cassette (e.g., "LAKI" mice for progeria models).
- Doxycycline-containing chow or drinking water.
- Standard animal housing and monitoring equipment.
Method:
- Induction Pulse: Administer dox to the mice for a short period, typically 2 days. This pulse induces the expression of the Yamanaka factors.
- Chase Period: Withdraw dox for a longer period, typically 5 days. This allows the cells to cease factor expression and re-establish their tissue-specific gene expression programs.
- Cycle Repetition: Repeat this cycle multiple times (e.g., 35 cycles) as required by the experimental design.
- Monitoring: Regularly assess mice for teratoma formation, weight loss, and measure biomarkers of aging (e.g., epigenetic clocks, transcriptomic age) and tissue function [4].
Protocol 2: Cell Type-Specific Gene Suppression using CRISPRi
Objective: To perform loss-of-function studies with high cell type-specificity, avoiding the off-target effects common in Cre-LoxP systems.
Materials:
- Dmp1dCas9::KRAB knock-in mouse model (dCas9::KRAB inserted into the endogenous Dmp1 locus).
- sgRNATnfsf11 mouse model (sgRNA against target gene, e.g., Tnfsf11, knocked into the Rosa26 safe harbor locus).
- Standard molecular biology tools for genotyping and phenotyping (microCT, RNA sequencing).
Method:
- Mouse Cross: Cross Dmp1dCas9::KRAB mice with sgRNATnfsf11 mice to generate double-positive experimental animals.
- Specificity Assurance: The Dmp1 promoter drives high expression of dCas9::KRAB primarily in osteocytes. The sgRNA is constitutively expressed but only suppresses the target gene in cells where dCas9::KRAB is present at high levels.
- Phenotypic Analysis: Analyze the offspring for cell type-specific phenotypes. For example, Ot-CRiTnfsf11 mice should exhibit a bone-specific phenotype without the lymphatic defects seen in global Tnfsf11 knockouts, confirming the specificity of the system [79].
Research Reagent Solutions
Table 2: Essential Reagents for Reprogramming and Identity Maintenance
| Reagent | Function | Key Considerations |
|---|---|---|
| Doxycycline (Dox) | Inducer for Tet-On systems to control the expression of reprogramming factors. | Critical for cyclic induction protocols; concentration and timing must be rigorously optimized to prevent over-reprogramming [4]. |
| AAV9 Vectors | Gene delivery vehicle for in vivo reprogramming factors. | Provides broad tissue distribution; preferred for delivering OSK factors in gene therapy approaches to reduce oncogenic risk [4]. |
| Chemical Cocktails (e.g., 7c) | Non-genetic method for partial reprogramming. | May offer a safer alternative by avoiding genomic integration; can have different mechanistic pathways (e.g., upregulating p53) compared to OSKM [4]. |
| dCas9::KRAB Fusion Protein | Engineered CRISPR-based transcriptional repressor for CRISPRi. | Must be expressed at high levels for effective suppression; can be driven by cell type-specific promoters (e.g., Dmp1) for targeted studies [79]. |
| Conditional sgRNA (CRISPR-Switch) | A sgRNA cassette controlled by Cre recombination for precise temporal control. | Allows sharp induction (Switch-ON) or termination (Switch-OFF) of editing activity, useful for sequential editing and reducing off-target effects [82]. |
Signaling Pathways and Workflow Visualizations
Diagram 1: Reprogramming paths to stable identity.
Diagram 2: Toolkit for specific genetic control.
Benchmarks for Success: Validating Functional Maturity and Comparative Efficacy
FAQs: Multi-Omic Data Integration and Analysis
Q1: What are the most critical pre-processing steps to ensure successful multi-omic data integration? Successful integration hinges on rigorous pre-processing. You must standardize and harmonize data from different omics technologies, which have unique measurement units and characteristics. This involves normalizing for differences in sample size or concentration, converting to a common scale, removing technical biases, and filtering out outliers or low-quality data. Always release both raw and preprocessed data in public repositories to ensure full reproducibility and allow other researchers to apply their own preprocessing assumptions [83].
Q2: How can I design a multi-omic resource that is truly useful for the research community? Design the resource from the perspective of the end-user, not the data curator. To avoid creating an underutilized database, formulate real use-case scenarios. Pretend you are an analyst tackling a specific biomedical problem and ask what data, formats, and metadata you would need. This user-centered approach, exemplified by projects like ENCODE, is pivotal for the resource's adoption and success [83].
Q3: What is the significance of a "proteomic age gap" and how is it calculated? The proteomic age gap (ProtAgeGap) measures the difference between a person's protein-predicted biological age (ProtAge) and their chronological age. It is a powerful biomarker for aging. A positive gap (ProtAge > chronological age) indicates accelerated aging and is associated with higher risk for major chronic diseases, multimorbidity, and all-cause mortality. It is calculated by training a machine learning model (e.g., gradient boosting) on proteomic data to predict chronological age, then applying the model to new samples to compute the difference [84].
Q4: What are the advantages of using non-viral physical methods like Tissue Nanotransfection (TNT) for cellular reprogramming in validation studies? TNT uses localized nanoelectroporation for gene delivery, offering key advantages over viral vectors: high specificity, a non-integrative approach that minimizes the risk of permanent genomic alterations, and minimal cytotoxicity and immunogenicity. This makes it particularly suitable for in vivo validation studies where safety and transient gene expression are critical, such as in direct cellular reprogramming for tissue regeneration [6] [85].
Troubleshooting Guides
Table 1: Common Multi-Omic Integration Issues and Solutions
| Problem Area | Specific Issue | Potential Cause | Solution |
|---|---|---|---|
| Data Quality | High batch effects obscuring biological signals. | Technical variation between different sample processing dates, platforms, or operators. | Apply batch effect correction algorithms (e.g., ComBat). Include batch information in experimental design and account for it statistically [83]. |
| Data Integration | Incompatible data formats from different omics sources. | Each omics technology (genomics, proteomics) outputs data in its own native format. | Transform data into a unified samples-by-features matrix (e.g., n-by-k). Use standardized formats from tools like TCGA2BED for genomic data [83] [86]. |
| Model Performance | Proteomic age clock model does not generalize to a new population. | Overfitting to the training cohort; lack of diversity in initial dataset. | Use machine learning methods known for generalizability (e.g., gradient boosting was superior to neural networks in one study). Validate clocks in geographically and genetically diverse biobanks [84]. |
| Biological Validation | Loss of tissue-specific function after cellular reprogramming. | Incomplete or unstable reprogramming; use of methods that induce pluripotency (with tumorigenicity risk). | Utilize direct lineage conversion (transdifferentiation) or partial reprogramming to avoid a pluripotent state. This promotes more stable, tissue-specific outcomes without uncontrolled proliferation [6]. |
Table 2: Troubleshooting Proteomic Aging Clocks
| Issue | Diagnostic Check | Recommended Action |
|---|---|---|
| Low Age Prediction Accuracy | Check Pearson correlation (r) between predicted and chronological age in the test set. | Perform recursive feature elimination to identify the minimal set of high-impact proteins (e.g., a 20-protein model achieved 95% performance of a 204-protein model) [84]. |
| Unstable Protein Associations | Assess association of key proteins with age across multiple time points from the same subjects. | Focus on proteins with stable associations over time (high correlation of beta coefficients across visits). This ensures clock reliability [84]. |
| Poor Clinical Translation | Proteomic age gap is not associated with expected age-related phenotypes. | Systematically test the ProtAgeGap for associations with a range of functional measures (frailty index, walking pace, cognitive tests) to validate its biological relevance [84]. |
Experimental Protocols for Key Validations
Protocol 1: Developing and Validating a Plasma Proteomic Aging Clock
Objective: To build a machine learning model that predicts chronological age from plasma proteomic data and validate its association with mortality and disease.
Materials:
- Cohort: Large, population-based biobank with plasma samples and long-term follow-up (e.g., UK Biobank-style).
- Proteomics Platform: High-throughput platform (e.g., Olink Explore) measuring ~3,000 proteins.
- Computational Environment: Python/R environment with machine learning libraries (e.g., LightGBM for gradient boosting).
Methodology:
- Cohort Splitting: Randomly split the cohort into a training set (e.g., 70%) and a hold-out test set (e.g., 30%).
- Model Training: Train multiple machine learning models (LASSO, Elastic Net, Gradient Boosting, Neural Networks) on the training set to predict chronological age from normalized protein expression.
- Model Selection: Select the best model based on prediction accuracy (e.g., R², Pearson r) on the hold-out test set and, crucially, its performance on independent validation cohorts from diverse populations.
- Feature Selection: Use algorithms (e.g., Boruta) and SHAP values to identify the subset of proteins most relevant for age prediction.
- Calculate Proteomic Age Gap: Apply the final model to all participants to compute ProtAge, then calculate ProtAgeGap (ProtAge - chronological age).
- Phenotypic Validation: Link the ProtAgeGap to future incidence of age-related diseases, multimorbidity, and all-cause mortality using Cox proportional hazards models, adjusting for chronological age and other confounders.
Protocol 2: Validating Reprogramming Outcomes via Multi-Omic Profiling
Objective: To confirm that cellular reprogramming achieves target cell identity and function while maintaining genomic integrity.
Materials:
- Reprogramming Tool: Tissue Nanotransfection (TNT) device or similar non-viral delivery system.
- Genetic Cargo: Plasmid DNA, mRNA, or CRISPR/dCas9 systems encoding reprogramming factors.
- Assay Kits: For transcriptomic (RNA-seq), epigenomic (bisulfite sequencing for DNA methylation clocks, ATAC-seq), and proteomic (multiplex immunoassays) analysis.
Methodology:
- In Vivo Reprogramming: Perform TNT-mediated delivery of reprogramming factors into the target tissue.
- Multi-Omic Sampling: At defined time points post-reprogramming, harvest tissue for:
- Transcriptomics: RNA-seq to assess the expression of lineage-specific markers and global shifts in gene expression towards the target cell type.
- Epigenetics: DNA methylation analysis using a targeted or genome-wide approach (e.g., Illumina EPIC array) to validate the resetting of epigenetic aging clocks and establishment of target cell methylation patterns.
- Proteomics: Quantify protein levels of key lineage-specific markers and secreted factors to confirm functional maturity.
- Functional Assays: Conduct tissue-specific functional tests (e.g., contractility for muscle, synaptic activity for neurons, albumin production for hepatocytes).
- Data Integration: Correlate findings across omic layers to build a comprehensive picture of the reprogrammed cell's identity, function, and stability.
Signaling Pathways and Workflows
Multi-Omic Validation of Reprogramming Workflow
The Scientist's Toolkit: Research Reagent Solutions
Table 3: Essential Tools for Multi-Omic Validation Studies
| Research Tool | Function in Validation | Example Use Case |
|---|---|---|
| Tissue Nanotransfection (TNT) Device | A non-viral, nanoelectroporation-based platform for in vivo delivery of genetic cargo. Enables localized reprogramming with minimal immunogenicity [6] [85]. | Direct in vivo reprogramming of fibroblasts to neurons for tissue repair. |
| Olink Explore Platform | High-throughput proteomics platform for simultaneous measurement of nearly 3,000 plasma proteins. Essential for building large-scale proteomic age clocks [84]. | Discovery and validation of the 204-protein aging clock and its association with mortality. |
| CRISPR/dCas9 Systems | A programmable, non-cutting CRISPR system fused to transcriptional activators/repressors. Allows precise epigenetic and transcriptional manipulation without altering DNA sequence [6]. | Targeted epigenetic remodeling to enhance stability of reprogrammed cell identity. |
| DNA Methylation Clocks | A set of specific CpG sites whose methylation status highly correlates with chronological or biological age. Used to assess the epigenetic rejuvenation of cells [87]. | Measuring the reversal of epigenetic age in partially reprogrammed cells in vivo. |
| Boruta Feature Selection | A wrapper-based algorithm that identifies all relevant features in a dataset. Used to select the most important proteins for age prediction from thousands of candidates [84]. | Reducing a 2,897-protein dataset to a robust 204-protein aging signature without losing predictive power. |
The success of cell and tissue reprogramming in regenerative medicine is ultimately measured by the functionality of the resulting cells. Assessing whether reprogrammed cells not only adopt the correct molecular signature but also execute tissue-specific functions requires a suite of functional assays. Electrophysiology, contractility, and metabolic activity assays provide critical validation that reprogrammed tissues can perform the specialized tasks of their native counterparts—from generating action potentials in neurons to executing coordinated contractions in cardiomyocytes and maintaining energy homeostasis. This technical support center addresses the specific experimental challenges researchers face when applying these functional assays to the unique context of reprogramming research, where cell maturity, stability, and functional integration are paramount.
Electrophysiology Assays
Electrophysiology assays are indispensable for validating the functional maturity of reprogrammed electrogenic cells, such as neurons and cardiomyocytes. These techniques measure the electrical activity that underpins their fundamental physiological roles.
Troubleshooting Guide: Electrophysiology
Table 1: Common Electrophysiology Assay Issues and Solutions
| Problem | Possible Causes | Recommended Solutions |
|---|---|---|
| Inability to form a high-resistance seal (GΩ seal) | • Debris in pipette tip• Leakage in pressure system• Poor cell health or surface quality | • Clean capillary tubes and store dust-free [88]• Tighten all pressure system joints; check/replace tiny rubber seals in pipette casing [88]• Ensure cell viability and prepare a clean cell suspension [89] |
| Unstable recordings in automated systems | • Low seal resistance (e.g., 100-200 MΩ)• Electrode instability from large currents• Unoptimized intracellular solution | • For low-amplitude currents, use platforms designed for GΩ seals [89]• Limit protocol length, avoid extreme voltages, recondition electrodes daily [89]• Test solution composition; high intracellular F- increases seal resistance but alters cell physiology [89] |
| High cell-to-cell variability in Multi-Electrode Array (MEA) data | • Heterogeneous cell population• Inconsistent cell seeding or health | • Use the Population Patch Clamp (PPC) mode to record ensemble averages from multiple cells [89]• Standardize cell culture and preparation protocols to ensure a homogeneous suspension [89] |
| Poor cell survival in acute brain slice recordings | • Inadequate oxygen supply (carbogen)• Incorrect artificial cerebrospinal fluid (aCSF) flow | • Check carbogen flow, tubing for leaks, and ensure tanks are not empty [88]• Verify aCSF pump flow rate and check inflow/outflow tubes for blockages [88] |
FAQ: Electrophysiology
What are the key advantages of using Multi-Electrode Array (MEA) analysis for studying reprogrammed cells? MEA systems use microelectrodes embedded in multi-well plates to non-invasively record the electrophysiological activity of cells over time, without disturbing the cell membrane. This allows for multiple and longitudinal real-time recordings from the same culture, making it ideal for tracking the functional maturation of reprogrammed neuronal or cardiac networks. The technique is label-free and can be multiplexed for higher-throughput screening [90].
How can I improve the success rate of automated patch clamp experiments with reprogrammed iPSC-derived cells? Success depends heavily on cell preparation. Generate a high-quality, single-cell suspension with minimal debris. For cells that are traditionally adherent (like HEK or CHO cells), optimization of the trypsinization and trituration steps is critical. If using native or iPSC-derived cells, confirm that the parental cell line forms adequate seals on the planar substrate of the automated instrument. Utilizing Population Patch Clamp (PPC) mode can average out cell-to-cell variability and achieve near 100% success rates for some cell lines [89].
My reprogammed cardiomyocytes show electrical activity, but is it mature? What parameters should I look for? Beyond simple electrical excitability, mature cardiac electrophysiology is characterized by a robust and prolonged field potential, similar to a cardiac action potential. Key parameters from MEA analysis include Field Potential Duration (FPD), which approximates the QT interval of an electrocardiogram and is a critical biomarker for drug safety assessment. The presence of organized, synchronous beating across the cell network is another key indicator of functional maturity [90].
Experimental Protocol: Integrated Electrical and Metabolic Recording
This protocol, adapted from recent research, allows for the simultaneous recording of electrical spikes and extracellular pH changes, providing correlated data on electrophysiology and metabolic activity from the same culture [91].
- Device Preparation: Use a Micro Organic Charge Modulated Array (MOA) with sensing sites functionalized for dual purposes. Select sites are insulated with a thin (150 nm) Parylene C layer for electrical recording, while others are coated with a plasma-activated, thick (500 nm) Parylene C layer for super-Nernstian pH sensitivity [91].
- Cell Culture: Plate primary or reprogrammed electrogenic cells (e.g., cardiomyocytes or neurons) onto the MOA device. For cardiac studies, primary rat cardiomyocytes are a common model.
- Setup Configuration: Place the device in a custom readout system with multiple channels. Position the initial current-to-voltage conversion stage close to the transistors to minimize electronic noise [91].
- Simultaneous Recording: Continuously monitor the electrical activity (action potentials/spikes) from the electrophysiology sites and the extracellular acidification rate (a proxy for glycolytic metabolism) from the pH-sensitive sites.
- Pharmacological Stimulation: Apply drugs to modulate cellular activity. For example, administer compounds known to alter beating rate in cardiomyocytes. Correlate the resulting changes in spiking frequency with shifts in the extracellular pH trace [91].
- Data Analysis: Analyze the timing, frequency, and shape of electrical waveforms. For pH data, convert voltage shifts from the pH sensors into pH units using a pre-established calibration curve and analyze the rate of pH change.
Key Signaling Pathways in Electrogenic Cells
The diagram below illustrates the core ion dynamics and signaling pathways that underlie the electrical activity in a mature, reprogrammed cardiomyocyte, which functional electrophysiology assays aim to validate.
Figure 1: Ion Channels and Cardiomyocyte Excitation. This diagram illustrates the coordinated action of voltage-gated ion channels and pumps in generating a cardiomyocyte action potential. Sodium (Na+) influx initiates depolarization, calcium (Ca2+) influx sustains the plateau and triggers contraction, and potassium (K+) efflux repolarizes the membrane. The Na+/K+ ATPase pump maintains resting ion gradients.
Contractility Assays
Contractility assays measure the force generation of muscle cells, a critical functional output for reprogrammed cardiac and skeletal myocytes. These assays confirm that the complex machinery of excitation-contraction coupling is fully operational.
Troubleshooting Guide: Contractility
Table 2: Common Contractility Assay Issues and Solutions
| Problem | Possible Causes | Recommended Solutions |
|---|---|---|
| Low or absent gel contraction in collagen lattice assay | • Suboptimal collagen concentration or pH• Insufficient cell number or viability• Inadequate gel polymerization | • Perform NaOH titration for every new collagen batch to optimize solidification [92]• Ensure cells are healthy, accurately counted, and properly pelleted before embedding [92]• Use the minimal volume of NaOH needed for solidification; excess NaOH increases gel rigidity [92] |
| High variability in impedance-based contractility data | • Inconsistent cell seeding density• Poor attachment of muscle cells | • Standardize cell seeding protocols across all wells of the plate.• Coat plates with extracellular matrix proteins (e.g., fibronectin, laminin) to promote strong and uniform cell adhesion. |
| Inability to distinguish dedifferentiated cells from functionally contracted cells | • Assay only measures physical movement, not molecular maturity. | • Combine impedance contractility with simultaneous Multi-Electrode Array (MEA) analysis to link contraction directly to cardiac-specific electrophysiology (field potential) [93]. |
FAQ: Contractility
How can I simultaneously measure contractility and electrophysiology in the same set of reprogrammed cardiomyocytes? Integrated platforms exist that combine impedance analysis for contractility with Multi-Electrode Array (MEA) technology. This non-invasive, label-free approach allows for the parallel measurement of the field potential duration (electrophysiology) and the amplitude/rate of beating (contractility) from the same culture well, providing a comprehensive functional profile of the cardiomyocytes [93].
What does a collagen contraction assay tell me about my reprogrammed fibroblasts? This 3D assay measures the ability of fibroblasts to mechanically reorganize and contract a collagen matrix, mimicking a key aspect of their function in wound healing and a pathogenic behavior in fibrosis. Stronger contraction indicates a more "activated" fibroblast state. The assay can be used to test how heterotypic cell-cell interactions (e.g., with immune cells) or soluble factors influence the contractile behavior of reprogrammed fibroblasts [92].
Experimental Protocol: Collagen Lattice Contraction Assay
This protocol provides a method to assess the contractile function of reprogrammed fibroblasts in a 3D microenvironment [92].
NaOH Titration (Critical Preliminary Step):
- Aliquot DMEM into several tubes. Add a fixed volume of stock collagen (e.g., 3 mg/ml) to each, turning the media yellow.
- Add increasing volumes of 1M NaOH (e.g., 1-8 µl) to separate tubes, mixing gently after each addition.
- Immediately transfer each mixture to a well of a 24-well plate and allow to solidify for 20 minutes.
- Identify the least volume of NaOH that produces a firm, pink-colored gel (indicating physiological pH) for all subsequent assays [92].
Cell Preparation:
- Trypsinize and harvest adherent fibroblasts (or use suspension cells). Pellet cells by centrifugation, aspirate media, and resuspend in fresh medium. Perform an accurate cell count using a hemocytometer [92].
Gel Polymerization:
- In a sterile tube, combine the following on ice: DMEM, cell suspension, and the optimized volume of stock collagen solution. Gently mix by pipetting, avoiding bubbles.
- Add the pre-determined optimal volume of 1M NaOH, mix quickly but gently, and immediately pipet 500 µl of the mixture into each well of a 24-well plate.
- Incubate the plate at 37°C for 20-30 minutes to allow complete polymerization [92].
Release and Measurement:
- After polymerization, carefully add culture medium to each well without disturbing the gel.
- Gently release the gels from the sides of the well using a pipette tip or thin spatula.
- Designate this time point as T=0.
Image Acquisition and Analysis:
- At defined time points (e.g., 0, 6, 24, 48 hours), image the entire plate using a flatbed scanner, microscope with camera, or similar device.
- Analyze the gel area using image analysis software like ImageJ. Contraction is expressed as the percentage reduction in gel area over time [92].
Metabolic Activity Assays
Metabolic activity assays are crucial for monitoring the health and energetic state of reprogrammed cells, ensuring they can generate the ATP required to power tissue-specific functions.
Troubleshooting Guide: Metabolic Activity
Table 3: Common Metabolic Activity Assay Issues and Solutions
| Problem | Possible Causes | Recommended Solutions |
|---|---|---|
| Poor luminescent signal in metabolite detection assays | • Incompatible microplate• Repeated freeze/thaw of reagents• Metabolite level outside detection range | • Use white, opaque-walled plates to maximize signal and minimize crosstalk [94]• Aliquot reagents to avoid repeated freeze/thaw cycles [94]• Validate the assay with a standard curve and dilute samples if necessary [94] |
| High background or inconsistent data | • Matrix effects from non-standard sample types (e.g., urine, CSF)• Contamination from other assays in multiplexing | • For complex matrices, validate recovery and linearity by spiking known metabolite quantities [94]• Avoid multiplexing different luminescent assays in the same well; split samples into parallel wells instead [94] |
| Difficulty interpreting metabolic data in the context of omics findings | • Assay measures functional output, not gene/protein expression. | • Use metabolic assays for functional validation. For example, measure lactate secretion or glucose consumption to directly confirm transcriptomics data suggesting altered glycolysis [94]. |
FAQ: Metabolic Activity
How do I choose the right metabolic assay for my reprogrammed cell model? The choice depends on your biological question. If you are studying glycolytic flux, consider glucose uptake or lactate production assays. To assess oxidative phosphorylation or redox state, assays for NAD/NADH or NADP/NADPH are more appropriate. Always ensure the assay is compatible with your sample type (adherent cells, suspension, 3D cultures) [94].
Can I use these metabolic assays to validate findings from my transcriptomics or metabolomics study on reprogrammed cells? Yes, these functional assays are excellent for validating omics data. A luminescence-based metabolite assay provides a scalable, quantitative method to give functional confidence to high-throughput discovery data. For instance, if transcriptomics indicates upregulated glycolysis, a lactate production assay can functionally confirm this metabolic shift [94].
Is it possible to measure the activity of a specific dehydrogenase enzyme in my reprogrammed cells? Yes, using systems like the Dehydrogenase-Glo Detection System. By providing an excess of the dehydrogenase's substrate, the luminescent signal becomes directly proportional to the amount of active enzyme present in the sample. This allows for the creation of custom assays for enzymes like malate or isocitrate dehydrogenase [94].
Integrated Workflow: Correlating Metabolism with Electrophysiology
The diagram below outlines an experimental workflow for simultaneously measuring metabolic and electrophysiological activity, providing a holistic view of cellular function.
Figure 2: Workflow for Simultaneous Electrical and Metabolic Recording. This workflow shows the key steps for using an integrated platform, like a Micro Organic Charge Modulated Array (MOA), to correlate electrophysiological spikes with metabolic shifts in real-time from the same cell culture.
The Scientist's Toolkit: Key Research Reagents and Materials
Table 4: Essential Reagents for Functional Assays in Reprogramming Research
| Reagent / Material | Function / Application | Example Use Case |
|---|---|---|
| Micro Organic Charge Modulated Array (MOA) | Integrated device with multiple sensors for simultaneous recording of electrical activity and extracellular pH from the same cell culture [91]. | Tracking the maturation of reprogrammed cardiomyocytes by correlating action potential firing with acidification rate [91]. |
| Rat Tail Collagen Type I | Major component of the extracellular matrix used to create 3D hydrogel lattices for contractility assays [92]. | Assessing the contractile force of reprogrammed fibroblasts in a collagen contraction assay [92]. |
| Amphotericin B | Perforating agent used in automated electrophysiology to create small pores in the cell membrane, enabling electrical access without complete rupture [89]. | Performing whole-cell recordings on IonWorks platforms for medium-throughput screening of ion channel drugs [89]. |
| NAD/NADH-Glo Assay | Luminescent assay to quantify the levels of NAD and NADH, key cofactors in redox reactions and a readout of cellular metabolic state [94]. | Validating a shift towards oxidative metabolism in reprogrammed cells predicted by transcriptomic data [94]. |
| Dehydrogenase-Glo Detection System | A customizable system to measure the activity of specific dehydrogenase enzymes by providing the relevant substrate [94]. | Creating a custom assay to monitor the activity of isocitrate dehydrogenase in reprogrammed cells undergoing metabolic maturation [94]. |
| iPSC-Derived Cardiomyocytes | A clinically relevant human cell model for studying cardiac function, disease, and drug responses in vitro [90] [93]. | Developing disease models for cardiac arrhythmias or hypertrophy to test the efficacy of new therapeutics [90] [93]. |
Comparative Analysis of Reprogramming Modalities
The table below summarizes the core characteristics, efficacy, and safety profiles of the three primary reprogramming modalities.
| Feature | Genetic (OSK/OSKM) | Chemical Reprogramming | Physical (TNT) |
|---|---|---|---|
| Core Components | Transcription factors (Oct4, Sox2, Klf4, with/without c-Myc) delivered via virus or mRNA [95] [4] | Cocktails of small molecules (e.g., 7c: CHIR99021, VPA; 2c) targeting signaling/epigenetic pathways [95] [39] | Tissue Nanotransfection; non-viral gene delivery using a nanochip and electric field [85] |
| Key Mechanism | Ectopic expression of pluripotency genes; resets epigenetic landscape via DNA demethylation (TET-dependent) [4] [39] | Modulates signaling pathways and epigenetic enzymes to induce a plastic state [95] [4] | Direct in situ transfection of somatic cells with reprogramming factors to change cell fate [85] |
| Rejuvenation Efficacy | Reverses epigenetic age, restores function in eye, brain, kidney, muscle; extends lifespan in mice [4] [39] | Rejuvenates aged cells, reduces DNA damage/senescence; extends C. elegans lifespan by 42.1% [95] | Aims to regenerate damaged tissues; in vivo data shows functional restoration [85] |
| Tumorigenic Risk | High with prolonged OSKM expression; c-Myc is a known oncogene [95] [4] | Potentially Lower; non-genetic, transient application reduces cancer risk [95] [4] | Information Missing; risk profile not fully detailed in available literature |
| Impact on Cellular Identity | High risk of dedifferentiation and teratoma formation if not carefully controlled [95] [96] | Appears to retain cellular identity during partial reprogramming protocols [95] [39] | Reprograms cells directly from one somatic identity to another in their native tissue environment [85] |
| Translational Potential | Limited by delivery efficiency, immune responses, and safety concerns [95] [4] | High; small molecules offer scalable, cost-effective dosing with easier clinical approval [95] [85] | Promising for in situ regenerative medicine; device-based application [85] |
Experimental Protocols for Key Studies
Protocol 1: Partial Chemical Reprogramming in Aged Human Cells
- Cell Culture: Use primary aged human dermal fibroblasts (e.g., from aged donors).
- Chemical Cocktail: Prepare the seven-compound (7c) cocktail: CHIR99021 (GSK-3β inhibitor), DZNep (EZH2 inhibitor), Forskolin (adenylyl cyclase activator), TTNPB (RAR agonist), Valproic acid (VPA; HDAC inhibitor), Repsox (TGF-β inhibitor), and Tranylcypromine (TCP; LSD1 inhibitor) [95].
- Treatment Duration: Treat cells continuously for 6 days [95].
- Reduced Cocktail: An optimized two-compound (2c) cocktail can also be tested for specific effects [95].
- Outcome Assessment:
- DNA Damage: Quantify γH2AX foci via immunofluorescence [95].
- Senescence: Perform Senescence-Associated Beta-Galactosidase (SA-β-Gal) staining [95].
- Epigenetics: Analyze H3K9me3 and H3K27me3 marks by immunostaining or Western blot [95].
- Transcriptomic Age: Use RNA sequencing and established aging clocks [39].
Protocol 2: In Vivo Partial OSK Reprogramming in Mice
- Animal Model: Use wild-type aged mice or progeria models (e.g., LAKI mice) [4].
- Factor Delivery: Employ adeno-associated virus serotype 9 (AAV9) for systemic delivery of OSK (Oct4, Sox2, Klf4; excluding c-Myc) genes [4].
- Induction Protocol: Use a cyclic induction regimen. A common protocol is a 1-day "pulse" of doxycycline (to activate transgene expression) followed by a 6-day "chase" without doxycycline. Repeat this cycle for multiple weeks [4].
- Outcome Assessment:
- Lifespan and Healthspan: Monitor survival and calculate a frailty index [4].
- Molecular Analysis: Perform multi-omics (transcriptomics, epigenomics, metabolomics) on tissues to assess rejuvenation [4] [39].
- Functional Tests: Conduct tissue-specific functional assays (e.g., visual function in eye models, regeneration capacity) [4] [39].
Frequently Asked Questions (FAQs) & Troubleshooting
FAQ 1: How can I achieve partial reprogramming without losing tissue-specific identity?
- Challenge: Full reprogramming erases cellular identity, leading to teratomas [95] [4].
- Solution:
- For Genetic Reprogramming: Use short-term, cyclic induction of factors (e.g., 2 days on/5 days off) instead of continuous expression. Excluding the oncogene c-Myc (using OSK instead of OSKM) significantly improves safety [4].
- For Chemical Reprogramming: Utilize partial reprogramming protocols with reduced exposure time (e.g., 6 days) or simplified cocktails (e.g., 2c). These regimens show rejuvenation without pushing cells to a pluripotent state [95] [39].
FAQ 2: What are the main safety concerns with OSKM reprogramming, and how can I mitigate them?
- Primary Concern: Tumorigenicity due to the oncogenic potential of c-Myc and Klf4, and the risk of teratoma formation from pluripotent cells [95] [4].
- Mitigation Strategies:
- Use OSK instead of OSKM: Omitting c-Myc reduces cancer risk while maintaining rejuvenation efficacy [4].
- Employ Non-Integrating Delivery Systems: Use Sendai virus (non-integrating) or mRNA (transient) for factor delivery instead of integrating retro/lentiviruses [97] [4].
- Implement Strict Temporal Control: Inducible systems and short pulses are critical for safety [4].
FAQ 3: My reprogramming efficiency is low. What can I do to improve it?
- Check Your Delivery System: For genetic methods, ensure high viral titer or mRNA transfection efficiency. For chemical methods, optimize solvent concentrations (e.g., DMSO) and ensure full solubility of compounds [97].
- Optimize Culture Conditions: Cell density, passage number, and the health of the starting cell population are critical. Use low-oxygen conditions if applicable [97].
- Consider Combination Approaches: Small molecules can enhance genetic reprogramming efficiency. For instance, VPA can improve iPSC generation efficiency [95].
FAQ 4: How do I measure successful "rejuvenation" versus "dedifferentiation"?
- Challenge: Distinguishing a rejuvenated somatic cell from a partially dedifferentiated or pluripotent cell [4].
- Assays for Rejuvenation:
- Aging Clocks: Use established epigenetic or transcriptomic clocks to quantify biological age reversal [4] [39].
- Functional Hallmarks: Measure improvement in aging hallmarks like reduced DNA damage (γH2AX), decreased SA-β-Gal activity, and restored mitochondrial function [95] [39].
- Lineage Markers: Continuously monitor the expression of key tissue-specific markers to confirm identity retention [4].
FAQ 5: Why is chemical reprogramming considered more translatable than genetic methods?
- Safety Profile: Small molecules are transient, dose-controllable, and do not integrate into the genome, avoiding insertional mutagenesis [95] [4].
- Manufacturing and Delivery: Producing and approving pharmaceutical compounds is generally more straightforward and scalable than viral or RNA-based gene therapies, potentially lowering costs [95] [85].
- In Vivo Application: Small molecules can often be delivered systemically and can cross tissue barriers more easily than some genetic tools [95].
The Scientist's Toolkit: Key Research Reagents
| Reagent / Tool | Primary Function in Reprogramming |
|---|---|
| CHIR99021 | A GSK-3β inhibitor that activates Wnt signaling, a key pathway in establishing pluripotency [95]. |
| Valproic Acid (VPA) | A histone deacetylase (HDAC) inhibitor that opens chromatin, making it more accessible for reprogramming factors [95]. |
| Tranylcypromine (TCP) | An LSD1 inhibitor that modulates histone methylation, particularly H3K4me, to facilitate epigenetic remodeling [95]. |
| AAV9 (Adeno-Associated Virus 9) | A viral vector with high tropism for multiple tissues, used for efficient in vivo delivery of genetic factors like OSK [4]. |
| Tissue Nanotransfection (TNT) | A nanochip device that uses localized electric fields to deliver reprogramming plasmids directly into skin cells in vivo [85]. |
| Senescence-Associated Beta-Galactosidase (SA-β-Gal) | A histochemical stain used as a biomarker to detect senescent cells in culture or tissue sections [95]. |
| Anti-γH2AX Antibody | An antibody for immunofluorescence staining to detect DNA double-strand breaks, a marker of genomic instability and aging [95]. |
Workflow Diagrams
Diagram 1: Partial Reprogramming Experimental Workflow
Diagram Title: Partial Reprogramming Experimental Workflow
Diagram 2: OSK vs. Chemical Reprogramming Pathways
Diagram Title: OSK vs. Chemical Reprogramming Pathways
For researchers in regenerative medicine, successfully demonstrating that reprogrammed cells can not only survive but also properly integrate and function within a living organism (in vivo) is the ultimate validation of a therapy's potential. This complex process involves a cascade of events: from the initial recruitment of cells to the injury site, their functional maturation, and finally, their seamless integration into the existing tissue architecture to restore homeostasis. This technical support center addresses the common challenges you may encounter during this critical phase of your research, providing troubleshooting guidance and detailed protocols to ensure robust and interpretable in vivo data for your thesis on maintaining tissue-specific function after reprogramming.
Troubleshooting Guides
Issue 1: Poor Recruitment and Engraftment of Administered Cells
A common hurdle is the failure of a sufficient number of reprogrammed cells to reach and engraft in the target tissue.
| Observed Problem | Potential Causes | Recommended Solutions | Key References to Consult |
|---|---|---|---|
| Low cell numbers at target site | Ineffective mobilization from injection site; Lack of proper homing signals. | Prime the injury site to enhance chemokine gradients (e.g., SDF-1/CXCR4 axis); Use biomaterial scaffolds to improve cell retention. [98] | Stem cell recruitment pathways [98] |
| Cell death during or after administration. | Optimize delivery vehicle (e.g., protective hydrogels); Pre-condition cells to withstand inflammatory stress. | Transformative material scaffolds [99] | |
| Systemic dispersion to off-target organs | Non-specific cell distribution after intravenous delivery. | Utilize direct, localized injection methods (e.g., intramyocardial, intrathecal); Employ tissue-targeting ligands on cell surfaces. | N/A |
Issue 2: Failure to Differentiate and Maintain Tissue-Specific Function
Even if cells arrive, they may not mature into the desired functional cell type or may lose their phenotype.
| Observed Problem | Potential Causes | Recommended Solutions | Key References to Consult |
|---|---|---|---|
| Loss of reprogrammed identity in vivo | Incomplete reprogramming; Inappropriate local microenvironment (niche) cues. | Perform rigorous in vitro validation of phenotype pre-transplantation; Co-deliver supportive niche cells or engineered matrices. | Transformative material scaffolds [99] |
| Epigenetic instability of the reprogrammed state. | Utilize transient, non-integrating reprogramming methods (e.g., mRNA, CRISPRa). | Tissue nanotransfection (TNT) [6] | |
| Lack of expected functional markers | Incorrect tissue-specific cues; Immune rejection. | Validate local expression of key differentiation factors in vivo; Use immunosuppressed models or autologous cells. | Tissue-specific immune niches [100] |
Issue 3: Inadequate Functional Integration with Host Tissue
Engrafted cells must electrically and mechanically couple with the host tissue to contribute to function.
| Observed Problem | Potential Causes | Recommended Solutions | Key References to Consult |
|---|---|---|---|
| No functional improvement despite engraftment | Failure to form proper electromechanical connections (e.g., gap junctions in heart). | Assess expression of key connexins/integrins; Use engineered tissues or patches over cell suspensions. | Tissue remodeling and integration [98] |
| Mismatch in maturity between host and grafted cells. | Employ strategies to promote graft maturation (e.g., paced electrical stimulation for cardiac cells). | N/A | |
| Formation of teratomas or ectopic tissue | Contamination with pluripotent cells or unstable reprogramming. | Rigorously purify the final cell product before transplantation; Use lineage-specific reporters for sorting. | Direct vs. pluripotent reprogramming [6] |
Frequently Asked Questions (FAQs)
Q1: What are the key molecular signals I should measure to confirm the recruited cells are responding to the native tissue environment? You should focus on the key axes of stem cell recruitment and injury response. A critical pathway is the SDF-1/CXCR4 interaction, which is a primary chemotactic signal for homing. Furthermore, the release of Damage-Associated Molecular Patterns (DAMPs) like HMGB1 and ATP from injured tissue initiates a cascade involving receptors like TLRs and RAGE, activating NF-κB and leading to the production of a broader inflammatory cytokine and chemokine milieu (e.g., IL-6, TNF-α) that recruits and activates cells. Measuring these factors in the host tissue and the corresponding receptor expression on your reprogrammed cells is crucial [98].
Q2: How can I distinguish between the direct functional contribution of my reprogrammed cells versus their paracrine effects on host tissue? This is a critical consideration for mechanistic studies. To isolate direct contribution, you can:
- Use irreversible genetic lineage tracing: Label your reprogrammed cells with a permanent fluorescent marker (e.g., Cre-lox system) before transplantation. Any functional improvement linked to these specifically labeled cells can be attributed to their direct involvement.
- Design cell ablation studies: Implement a "suicide gene" (e.g., inducible caspase) in the transplanted cell population. After observing functional recovery, ablating these cells and noting a subsequent functional decline strongly supports their direct role. To demonstrate paracrine effects, analyze the host tissue for changes in angiogenesis, reduction in apoptosis of host cells, and modulation of the immune response, which are classic hallmarks of trophic support.
Q3: My reprogrammed cells express the correct markers in vitro, but lose this expression shortly after in vivo transplantation. What could be happening? This often indicates that the in vitro maturation protocol was insufficient to create a stable phenotype, or the in vivo microenvironment is hostile or incorrect.
- Check the stability of reprogramming: Assess the epigenetic status (e.g., methylation patterns) of key lineage genes in the cells post-isolation from the host to see if they are being silenced.
- Re-evaluate the local niche: The host tissue may lack the necessary supportive signals (cell-cell contact, specific extracellular matrix proteins, growth factors) to maintain the phenotype. Consider using a supportive biomaterial scaffold that presents these cues to the cells [99]. Additionally, the local immune response might be actively suppressing the transplanted cells; assessing immune cell infiltration (e.g., T-cell, macrophage profiles) in the graft area is essential [100].
Q4: What are the best practices for quantifying true functional integration, say in a cardiac or neural model? Beyond counting cells that express a marker, functional assays are key:
- For Cardiac Models: Use high-resolution electrophysiology (optical mapping) to assess conduction velocity and check for arrhythmias originating from the graft-host border. Use paced stimulation to see if the graft follows the host rate precisely.
- For Neural Models: Use synaptic markers (e.g., vGLUT1, GAD65, PSD95) and electron microscopy to confirm ultrastructural synaptic connections. Optogenetics is a powerful tool: if stimulating the transplanted, light-sensitive neurons elicits a postsynaptic response in host cells (or vice-versa), it is definitive proof of functional synaptic integration.
Q5: Are there non-viral methods for in vivo reprogramming that I can use to avoid the safety concerns of viral vectors? Yes, the field is moving actively in this direction. A leading technology is Tissue Nanotransfection (TNT). This is a non-viral, nanoelectroporation-based platform that uses a microarray of nanochannels to temporarily porate cell membranes in a localized area of tissue and deliver genetic cargo (plasmid DNA, mRNA, or CRISPR components) directly in vivo. This allows for direct cellular reprogramming in situ without the risks of viral integration and immunogenicity [6].
Experimental Protocols for Key Assessments
Protocol 1: Assessing Cell Homing and Early Engraftment
Objective: To quantify the recruitment and initial retention of administered reprogrammed cells in the target tissue.
Materials:
- Reprogrammed cells labeled with a fluorescent cell tracker (e.g., CM-Dil) or expressing a luciferase/fluorescent protein.
- Animal model (e.g., murine myocardial infarction model).
- In vivo imaging system (IVIS) for bioluminescence (if using luciferase).
- Tissue homogenization and flow cytometry supplies.
Methodology:
- Labeling and Administration: Label your cells in vitro according to the dye manufacturer's protocol. Resuspend in sterile PBS. Administer cells via your chosen route (e.g., tail vein injection for systemic, intramyocardial for local).
- Longitudinal Imaging: For bioluminescent cells, image animals at standardized time points (e.g., 4, 24, 48, 72 hours) post-injection using the IVIS after administering D-luciferin substrate. Quantify the total photon flux in the region of interest.
- Endpoint Quantification: At the final time point, euthanize the animal and perfuse with PBS to remove circulating cells. Harvest the target organ and a control organ (e.g., lung, liver). Create a single-cell suspension.
- Flow Cytometry Analysis: Analyze the cell suspension by flow cytometry. Gate on the fluorescent population to determine the percentage and absolute number of retained cells in the target tissue relative to the input dose. Compare to negative control tissues.
Protocol 2: Evaluating Functional Integration in a Neuronal Context
Objective: To provide electrophysiological evidence that grafted neurons have synaptically integrated into the host neural circuit.
Materials:
- Reprogrammed neurons expressing Channelrhodopsin-2 (ChR2) and a fluorescent marker.
- Stereotaxic injection apparatus.
- Brain slice preparation equipment.
- Patch-clamp rig with optics for blue light delivery.
Methodology:
- Cell Transplantation: Stereotactically inject the ChR2-expressing, reprogrammed neurons into the target brain region (e.g., hippocampus) of your animal model.
- Slice Electrophysiology: After a suitable survival period for integration (e.g., 4-8 weeks), prepare acute brain slices containing the graft region.
- Patch-Clamp Recording: Identify grafted cells via fluorescence. Perform whole-cell patch-clamp recordings on a host neuron that is nearby but not fluorescent, indicating it is not a graft-derived cell.
- Optogenetic Stimulation: While recording from the host neuron, deliver brief pulses of blue light to stimulate the ChR2-expressing grafted neurons.
- Data Interpretation: The appearance of short-latency, time-locked postsynaptic currents (PSCs) in the host neuron upon light stimulation is direct evidence of functional synaptic transmission from the graft to the host.
Signaling Pathways and Workflows
Tissue Integration Mechanism
In Vivo Reprogramming Workflow
Research Reagent Solutions
| Reagent / Technology | Primary Function | Application in In Vivo Models |
|---|---|---|
| Tissue Nanotransfection (TNT) [6] | Non-viral, nanoelectroporation-based in vivo delivery of genetic cargo (DNA, mRNA, CRISPR). | Enables direct cellular reprogramming within the native tissue microenvironment, avoiding cell transplantation. |
| Self-Delivering ASOs (sdASO) [101] | Antisense oligonucleotides that enter cells without transfection reagents. | Allows efficient in vivo gene knockdown (AUMsilence) or splice modulation (AUMskip) to manipulate host or graft cell function. |
| Systemic MPRA (sysMPRA) [102] | Massively Parallel Reporter Assay delivered via systemic AAV to measure enhancer activity. | Deciphers tissue-specific gene regulatory function in vivo across multiple organs, crucial for understanding cell identity stability. |
| Transformative Biomaterials [99] | Programmable scaffolds (e.g., hydrogels) that provide biochemical and mechanical cues. | Acts as a supportive niche for transplanted reprogrammed cells, guiding their differentiation, retention, and functional integration. |
| Chemokine Receptor Antagonists/Agonists [98] | Molecules that modulate specific signaling pathways (e.g., SDF-1/CXCR4). | Used to enhance or block the homing of administered cells to the target tissue, allowing for mechanistic studies of recruitment. |
Troubleshooting Guides
Guide 1: Troubleshooting the Nucleocytoplasmic Compartmentalization (NCC) Assay
Problem: High background signal or poor separation of NLS/NES reporters.
- Potential Cause 1: The health of the starting cell population is compromised.
- Solution: Ensure cells are not stressed or confluent. Use low-passage, proliferative cells and confirm viability exceeds 95% before assay setup. For studies involving aged cells, use a standardized model of replicative senescence with complete growth arrest for over two weeks [39].
- Potential Cause 2: The nuclear pore complex is inherently degraded.
- Solution: This is often a hallmark of aging. Validate the assay by checking the expression of nuclear envelope proteins like Lamin B1, which is known to be deficient in senescent cells [103]. The assay is functioning correctly if it detects this age-related breakdown.
- Potential Cause 3: Inefficient lentiviral transduction or unstable reporter expression.
- Solution: Titrate the lentivirus to achieve optimal Multiplicity of Infection (MOI). Use a stable cell line with a puromycin-selectable reporter construct to ensure consistent expression. Always include a quiescent, young fibroblast control (e.g., from a 22-year-old donor) for baseline signal comparison [39].
Problem: Inconsistent NCC results after reprogramming or drug treatment.
- Potential Cause 1: Incomplete rejuvenation or variable efficiency of the intervention.
- Solution: Include a positive control for rejuvenation, such as inducible OSK expression, to benchmark the expected NCC restoration. Use quantitative image analysis (e.g., Pearson correlation coefficient for colocalization) rather than qualitative assessment [39].
- Potential Cause 2: The intervention itself is causing cellular stress.
- Solution: Perform a dose-response and time-course experiment. Monitor for other stress markers (e.g., elevated ROS) to find a treatment window that improves NCC without inducing toxicity.
Guide 2: Troubleshooting SASP Reduction and Analysis
Problem: Senescence biomarker levels are variable or do not decrease after senomorphic treatment.
- Potential Cause 1: The cell type- and stressor-specific nature of the SASP is not accounted for.
- Solution: Do not assume a universal SASP profile. Characterize the SASP for your specific cell type and senescence inducer (e.g., replicative vs. radiation-induced). Consult resources like the International Cell Senescence Association (ICSA) guidelines for a multi-marker approach [104].
- Potential Cause 2: The senomorphic treatment is not effectively disrupting key SASP signaling pathways.
- Solution: Use known SASP regulators as positive controls. For instance, check if your treatment inhibits the NF-κB or p38 MAPK pathways, which are central to SASP regulation. Confirm target engagement via western blot [104].
Problem: Discrepancy between in vitro SASP reduction and in vivo functional outcomes.
- Potential Cause: The selected SASP biomarkers may not be the most relevant for the tissue or disease context.
- Solution: Prioritize biomarkers with known clinical predictive value. For example, in older adults at high risk of cognitive decline, elevated levels of MPO and MMP7 are longitudinally associated with incident mild cognitive impairment (MCI) [105]. Focus senomorphic efforts on modulating such clinically relevant factors.
Frequently Asked Questions (FAQs)
FAQ 1: Why is nucleocytoplasmic compartmentalization (NCC) considered a biomarker of youthful cellular function? NCC is a well-conserved hallmark of aging. In young, healthy cells, the nuclear envelope acts as a selective barrier, maintaining distinct protein localization. With age, the nuclear pore complex deteriorates, leading to the leakage of nuclear proteins (like those with an NLS) into the cytoplasm and the failure of cytoplasmic proteins to be properly imported. This breakdown disrupts cellular signaling and function. Restoring NCC is therefore a key indicator of successful cellular rejuvenation [39].
FAQ 2: What are the primary differences between senolytics and senomorphics in the context of my thesis on preserving tissue function? Your thesis work requires careful consideration of this distinction. Senolytics are compounds that selectively induce apoptosis in senescent cells, thereby eliminating the source of the SASP. Senomorphics are drugs that suppress the SASP and other deleterious phenotypes of senescent cells without killing them. For therapeutic goals aimed at maintaining tissue-specific function, senomorphics may offer an advantage by modulating the inflammatory microenvironment without causing cell death and potential tissue damage that could accompany senolytic clearance. However, the risk of senescent cells persisting and potentially resuming proliferation must be considered [104].
FAQ 3: How can I ensure that partial reprogramming rejuvenates cells without erasing their tissue-specific identity? This is the central challenge of reprogramming-based rejuvenation. Key strategies include:
- Using Partial Reprogramming: Transient, non-integrating delivery of reprogramming factors (OSK, excluding the oncogene c-MYC) or chemical cocktails, rather than sustained expression that leads to full pluripotency [39] [4].
- Monitoring Identity Markers: Continuously assay for key transcription factors and functional markers specific to your cell type (e.g., albumin for hepatocytes, synaptophysin for neurons) throughout the reprogramming process.
- Leveraging Epigenetic Clocks: Use multi-omic aging clocks to confirm a reversal of epigenetic age while ensuring the DNA methylation landscape characteristic of the cell lineage is largely retained [4].
FAQ 4: Which SASP biomarkers are most critical to monitor for assessing healthspan and age-related disease risk? While the full SASP is complex, epidemiological studies in older adults have identified key biomarkers that robustly predict adverse health outcomes. A study in the Health ABC cohort found that higher levels of GDF15 and IL-6 were commonly selected by statistical models and significantly improved the prediction of mortality, mobility limitation, and heart failure [106]. Other significant factors include MPO and MMP7 for cognitive decline risk [105]. Focusing on this core set can provide strong translational relevance.
Table 1: Key Senescence Biomarkers and Their Association with Major Health Outcomes in Older Adults (Health ABC Cohort, n=1,678) [106]
| Biomarker | Full Name | Associated Health Outcome(s) | Key Finding (Highest vs. Lowest Quartile) |
|---|---|---|---|
| GDF15 | Growth Differentiation Factor 15 | All-cause Mortality, Mobility Limitation, Heart Failure | Significantly improved prediction models for risk. |
| IL-6 | Interleukin-6 | All-cause Mortality, Mobility Limitation, Heart Failure | Significantly improved prediction models for risk. |
| MPO | Myeloperoxidase | Mild Cognitive Impairment (MCI) | Cross-sectional OR=1.79; Longitudinal OR=1.92 |
| MMP7 | Matrix Metalloproteinase 7 | Incident MCI/Dementia | Longitudinal OR=2.14 |
| MMP1 | Matrix Metalloproteinase 1 | Mild Cognitive Impairment (MCI) | Cross-sectional OR=0.64 (suggesting a protective association) |
Table 2: Core Components of the Senescence-Associated Secretory Phenotype (SASP) [104]
| Category | Example Components | Proposed Role in Aging and Disease |
|---|---|---|
| Cytokines | IL-6, IL-8 (CXCL8), IL-1β, TNF-α | Drive chronic inflammation ("inflammaging"), support tumor cell survival. |
| Chemokines | CCL2 (MCP-1), CCL5 (RANTES), CXCL1 | Recruit immune cells to sites of senescence, can promote or suppress tumors. |
| Growth Factors | VEGF, FGF, Amphiregulin, GDF15 | Stimulate angiogenesis, tumor growth, and tissue remodeling. |
| Proteases | MMP2, MMP3, MMP9, MMP12 | Degrade the extracellular matrix, facilitating cancer invasion and metastasis. |
Experimental Protocols
Protocol 1: Quantitative NCC Assay for Cellular Rejuvenation
This protocol is adapted from studies on chemical reprogramming to reverse cellular aging [39].
1. Reporter Cell Line Generation:
- Cell Line: Primary human dermal fibroblasts (e.g., from young and old donors).
- Reporter Construct: A lentiviral vector expressing a fusion protein with mCherry linked to a Nuclear Localization Signal (NLS) and eGFP linked to a Nuclear Export Signal (NES).
- Transduction & Selection: Transduce fibroblasts at a low MOI and select with puromycin (e.g., 2 µg/mL) for 7 days to generate a stable polyclonal population.
2. Induction of Senescence and Treatment:
- Replicative Senescence: Passage fibroblasts repeatedly (e.g., ~40 population doublings) until complete growth arrest is observed. Confirm with SA-β-Gal staining and p21 transcript elevation.
- Chemical Reprogramming: Treat senescent cells with candidate rejuvenating cocktails (e.g., specific chemical combinations identified in screenings) for a defined period (e.g., less than one week) in low serum conditions to suppress cell division.
3. Imaging and Quantification:
- Image Acquisition: Use high-content automated microscopy to capture images of at least 1,000 cells per condition.
- Quantitative Analysis: Calculate the Pearson correlation coefficient between the mCherry (NLS) and eGFP (NES) channels. A high coefficient indicates colocalization and poor NCC, a hallmark of old/senescent cells. A low coefficient indicates distinct localization and restored NCC, a hallmark of youthful function [39].
Protocol 2: Multiplex Analysis of SASP Factors
1. Sample Preparation:
- Conditioned Media: Culture cells in serum-free media for 24-48 hours to accumulate secreted factors. Centrifuge to remove cell debris and store supernatant at -80°C.
- Plasma/Serum: Use EDTA-plasma or serum from clinical cohorts.
2. Protein Quantification:
- Technology: Use commercially available multiplex magnetic bead-based immunoassays (e.g., R&D Systems) on the Luminex xMAP platform.
- Panel: Design a panel to include key biomarkers identified in large-scale studies, such as GDF15, IL-6, MPO, MMP7, and MMP1 [106] [105].
- Procedure: Follow the manufacturer's protocol. Briefly, incubate samples with antibody-coated magnetic beads, then with a biotinylated detection antibody, and finally with a streptavidin-phycoerythrin conjugate. Analyze on a system like the MAGPIX.
3. Data Analysis:
- Concentration: Determine concentrations from standard curves.
- Statistical Analysis: Analyze data by quartiles or as continuous variables, adjusting for covariates like age and sex, to associate biomarker levels with clinical or experimental outcomes [106].
Signaling Pathways and Workflows
Title: Reprogramming Reverses Hallmarks of Aging
Title: SASP Components and Pathological Outcomes
The Scientist's Toolkit: Research Reagent Solutions
Table 3: Essential Research Reagents for Studying Rejuvenation Biomarkers
| Reagent / Tool | Function / Application | Example / Note |
|---|---|---|
| NCC Reporter | Visualizing and quantifying nucleocytoplasmic integrity. | Lentiviral construct with mCherry-NLS and eGFP-NES. Use in stable cell lines [39]. |
| OSK Inducible System | Gold-standard for genetic partial reprogramming. | Doxycycline-inducible polycistronic lentivirus for OCT4, SOX2, KLF4. Exclude c-MYC for safety [39] [4]. |
| Chemical Cocktails | Non-genetic alternative for inducing rejuvenation. | Multi-component small molecule cocktails (e.g., 7c) identified via high-throughput screening [39] [4]. |
| Multiplex Immunoassays | Quantifying multiple SASP factors from a single sample. | Luminex xMAP-based panels (e.g., R&D Systems) to measure IL-6, GDF15, MPO, MMPs, etc. [106] [105]. |
| Senescence Inducers | Generating a consistent population of senescent cells for study. | Replicative exhaustion, ionizing radiation (10 Gy), or chemotherapeutics (e.g., 100 nM Doxorubicin). |
| Epigenetic Clock Panels | Assessing biological age reversal post-intervention. | Multi-omic clocks based on DNA methylation, transcriptomic, or proteomic data to confirm rejuvenation [4]. |
Conclusion
The convergence of advanced reprogramming strategies—including partial genetic induction, chemical cocktails, and direct lineage conversion—heralds a new era in regenerative medicine where reversing cellular age and restoring function no longer requires sacrificing cellular identity. The critical insight is that a 'back-up copy' of a youthful epigenome can be accessed without erasing a cell's functional characteristics. Success hinges on precise control over reprogramming depth, duration, and context, moving beyond mere cell fate conversion to genuine tissue rejuvenation. Future research must prioritize the development of more refined delivery systems for spatiotemporal control, the discovery of novel tissue-specific reprogramming factors, and the establishment of robust clinical-grade manufacturing protocols. As these technologies mature, they promise to transform the treatment of age-related diseases, traumatic injuries, and degenerative disorders by enabling in situ tissue repair with native functionality, ultimately shifting the therapeutic paradigm from disease management to true cellular and tissue restoration.
References
- 1. Defining cell identity beyond the premise of differential ... [https://pmc.ncbi.nlm.nih.gov/articles/PMC8087741/]
- 2. Quantification of cell identity from single-cell gene expression ... [https://genomebiology.biomedcentral.com/articles/10.1186/s13059-015-0580-x]
- 3. Reprogramming cellular identity for regenerative medicine [https://pmc.ncbi.nlm.nih.gov/articles/PMC3354575/]
- 4. The long and winding road of reprogramming-induced ... [https://www.nature.com/articles/s41467-024-46020-5]
- 5. Article Differentiation success of reprogrammed cells is ... [https://www.sciencedirect.com/science/article/pii/S2213671125000517]
- 6. Tissue nanotransfection and cellular reprogramming in ... [https://www.frontiersin.org/journals/bioengineering-and-biotechnology/articles/10.3389/fbioe.2025.1558735/full]
- 7. Cell reprogramming: methods, mechanisms and applications [https://cellregeneration.springeropen.com/articles/10.1186/s13619-025-00229-x]
- 8. Partial cellular reprogramming: A deep dive into an emerging ... [https://pmc.ncbi.nlm.nih.gov/articles/PMC10861195/]
- 9. Prevention of tumor risk associated with the reprogramming of ... [https://jeccr.biomedcentral.com/articles/10.1186/s13046-020-01584-0]
- 10. Evaluating teratoma formation risk of pluripotent stem cell ... [https://pubmed.ncbi.nlm.nih.gov/40392167/]
- 11. Epigenetic Modifications: Basic Mechanisms and Role in ... [https://pmc.ncbi.nlm.nih.gov/articles/PMC3107542/]
- 12. Epigenetic regulation in metabolic diseases: mechanisms ... [https://www.nature.com/articles/s41392-023-01333-7]
- 13. Epigenetic Modification: Types, Functions, and ... [https://www.cd-genomics.com/blog/epigenetic-modification-types-applications-diseases-development/]
- 14. New Generation of Clinical Epigenetics Analysis and ... [https://pmc.ncbi.nlm.nih.gov/articles/PMC12192280/]
- 15. Tissue-specific and imprinted epigenetic modifications of ... [https://pmc.ncbi.nlm.nih.gov/articles/PMC443546/]
- 16. WD40 protein-mediated crosstalk among three epigenetic ... [https://www.sciencedirect.com/science/article/pii/S1674205225001753]
- 17. Large-scale chromatin state imputation from gene expression [https://pubmed.ncbi.nlm.nih.gov/41256458/?utm_source=FeedFetcher&utm_medium=rss&utm_campaign=None&utm_content=1-SjSZJSoHBGsnEXcLDjZZ8F-vz5YagNLIUYugSQFZXvZle9Rx&fc=None&ff=20251119133812&v=2.18.0.post22+67771e2]
- 18. Multiple tissue-specific epigenetic alterations regulate ... [https://pmc.ncbi.nlm.nih.gov/articles/PMC9980695/]
- 19. Spatial joint profiling of DNA methylome and transcriptome ... [https://www.nature.com/articles/s41586-025-09478-x]
- 20. Implications for Cellular Senescence and Age-related Diseases [https://pmc.ncbi.nlm.nih.gov/articles/PMC9033418/]
- 21. Targeting the hallmarks of aging: mechanisms and therapeutic ... [https://pmc.ncbi.nlm.nih.gov/articles/PMC12259695/]
- 22. The relationship between mitochondrial health, telomerase ... [https://www.nature.com/articles/s41598-024-77279-9]
- 23. Induction of tissue-specific stem cells by reprogramming ... [https://pmc.ncbi.nlm.nih.gov/articles/PMC4262778/]
- 24. Rejuvenating senescent and centenarian human cells by ... [https://pmc.ncbi.nlm.nih.gov/articles/PMC3219229/]
- 25. Epigenetic memory in reprogramming [https://www.sciencedirect.com/science/article/abs/pii/S0959437X2100054X]
- 26. Mechanisms, pathways and strategies for rejuvenation ... [https://pmc.ncbi.nlm.nih.gov/articles/PMC11058000/]
- 27. Emerging Strategies to Rejuvenate Aging Cells and Tissues [https://pmc.ncbi.nlm.nih.gov/articles/PMC8070588/]
- 28. Reprogramming to pluripotency: stepwise resetting of the ... [https://pmc.ncbi.nlm.nih.gov/articles/PMC3193418/]
- 29. CMN Weekly (19 September 2025) [https://crisprmedicinenews.com/news/cmn-weekly-19-september-2025-your-weekly-crispr-medicine-news/]
- 30. Chromatin Dynamics during Cellular Reprogramming - PMC [https://pmc.ncbi.nlm.nih.gov/articles/PMC4216318/]
- 31. In Vivo Amelioration of Age-Associated Hallmarks by Partial ... [https://pmc.ncbi.nlm.nih.gov/articles/PMC5679279/]
- 32. Reprogramming 101: How To Reset The Ageing Clock [https://www.gowinglife.com/reprogramming-101-how-to-reset-the-ageing-clock/]
- 33. Transient non-integrative expression of nuclear ... [https://www.nature.com/articles/s41467-020-15174-3]
- 34. Epigenetic Reprogramming: Reverse Aging at the Cellular ... [https://www.hubmeded.com/blog/epigenetic-reprogramming]
- 35. Resetting Cell Fate by Epigenetic Reprogramming [https://www.intechopen.com/chapters/63505]
- 36. NEW STUDY: Discovery of Chemical Means to Reverse ... [https://www.aging-us.com/news-room/NEW-STUDY-Discovery-of-Chemical-Means-to-Reverse-Aging-and-Restore-Cellular-Function]
- 37. Exploring 7c versus 2c Small Molecule Reprogramming ... [https://www.fightaging.org/archives/2025/07/exploring-7c-versus-2c-small-molecule-reprogramming-combinations-for-rejuvenation/]
- 38. Chemical reprogramming ameliorates cellular hallmarks of ... [https://pubmed.ncbi.nlm.nih.gov/40588563/]
- 39. Chemically induced reprogramming to reverse cellular aging [https://pmc.ncbi.nlm.nih.gov/articles/PMC10373966/]
- 40. Chemically induced reprogramming to reverse cellular aging [https://www.aging-us.com/article/204896/text]
- 41. Tissue nanotransfection and cellular reprogramming in ... [https://pmc.ncbi.nlm.nih.gov/articles/PMC12213499/]
- 42. Direct lineage conversion with pluripotency factors [https://pmc.ncbi.nlm.nih.gov/articles/PMC4873285/]
- 43. Inducible, virus-free direct lineage reprogramming ... [https://elifesciences.org/reviewed-preprints/106550]
- 44. Small-molecule-mediated reprogramming: a silver lining ... [https://www.nature.com/articles/s12276-020-0383-3]
- 45. Generation of inner ear hair cells by direct lineage ... [https://elifesciences.org/articles/55249]
- 46. Proliferation history and transcription factor levels drive direct ... [https://pubmed.ncbi.nlm.nih.gov/40086434/]
- 47. Cellular Reprogramming Tools Market Reaches USD 480 ... [https://www.towardshealthcare.com/insights/cellular-reprogramming-tools-market-sizing]
- 48. 3. Clinical Translation of Stem Cell-based Interventions [https://www.isscr.org/guidelines/clinical-translation-of-stem-cell-based-interventions]
- 49. Conquer Electroporation & Avoid the Arc [https://www.goldbio.com/blogs/articles/conquer-electroporation-avoid-the-arc-12-troubleshooting-tips?srsltid=AfmBOorGookbwyOjo8ktJAg2tm9GPEzz5Tvcg2WSDvZlG860GsSVNosx]
- 50. Electroporation—Troubleshooting [https://www.thermofisher.com/us/en/home/technical-resources/technical-reference-library/transfection-support-center/electroporation-support/electroporation-support-troubleshooting.html]
- 51. Troubleshooting Transformation Reactions [https://www.neb.com/en-us/tools-and-resources/troubleshooting-guides/troubleshooting-transformation-reactions?srsltid=AfmBOop-LPEz1CS2NNZGQ72K6PKATaalT49UfwcTYirLooJx3pSPRkB4]
- 52. Troubleshooting Transfection: Common Problems and Solutions [https://www.yeasenbio.com/blogs/cell/troubleshooting-transfection-common-problems-and-solutions]
- 53. The Future of Regenerative Medicine and Stem Cell Technology [https://infobymattcole.com/index.php/2025/10/03/revolutionary-tissue-nanotransfection-chip-the-future-of-regenerative-medicine-and-stem-cell-technology/]
- 54. Tissue nanotransfection and cellular reprogramming in ... [https://pubmed.ncbi.nlm.nih.gov/40606909/]
- 55. In Vivo Targeted Reprogramming of Cardiac Fibroblasts for ... [https://pmc.ncbi.nlm.nih.gov/articles/PMC12466987/]
- 56. Cardiac repair and regeneration: cell therapy, in vivo ... [https://www.nature.com/articles/s12276-025-01549-3]
- 57. Reprogramming of human urine cells into cardiomyocytes ... [https://www.nature.com/articles/s43856-025-00963-y]
- 58. Astrocyte to neuron reprogramming with NeuroD1 for ... [https://www.frontiersin.org/journals/stroke/articles/10.3389/fstro.2025.1602076/full]
- 59. Three-dimensional cell-cell interactions promote direct ... [https://pmc.ncbi.nlm.nih.gov/articles/PMC12143395/]
- 60. Troubleshooting Guide for hPSC Culture [https://www.stemcell.com/troubleshooting-tips-for-hpsc-culture.html]
- 61. Stem Cell Culture Support—Troubleshooting [https://www.thermofisher.com/us/en/home/technical-resources/technical-reference-library/cell-culture-support-center/stem-cell-culture-support/stem-cell-culture-support-troubleshooting.html]
- 62. Prevention of tumor risk associated with the ... [https://pmc.ncbi.nlm.nih.gov/articles/PMC7268627/]
- 63. Reprogramming the tumor microenvironment with c-MYC- ... [https://www.nature.com/articles/s41467-025-63377-3]
- 64. TGF-β signaling in health, disease and therapeutics [https://www.nature.com/articles/s41392-024-01764-w]
- 65. TGF-β Signaling - PMC - PubMed Central - NIH [https://pmc.ncbi.nlm.nih.gov/articles/PMC7175140/]
- 66. TGF-β inhibitors: the future for prevention and treatment of ... [https://www.frontiersin.org/journals/immunology/articles/10.3389/fimmu.2025.1583616/full]
- 67. Inhibiting TGF-β signaling pathway for disease therapy [https://www.sciencedirect.com/science/article/abs/pii/S1043466625001954]
- 68. PathAI Launches PathExplore™ Fibrosis: An AI-Powered ... [https://www.pathai.com/resources/pathai-launches-pathexplore-fibrosis-an-ai-powered-pathology-breakthrough-in-fibrosis-collagen-and-fiber-quantification-directly-from-whole-slide-images]
- 69. Fibroblasts: origins, definitions, and functions in health and ... [https://pmc.ncbi.nlm.nih.gov/articles/PMC8566693/]
- 70. Senescent cell heterogeneity and responses to senolytic ... [https://www.aging-us.com/article/206299/text]
- 71. Regulation of cellular senescence in tumor progression and ... [https://molecular-cancer.biomedcentral.com/articles/10.1186/s12943-025-02284-z]
- 72. The interplay of cellular senescence and reprogramming ... [https://pmc.ncbi.nlm.nih.gov/articles/PMC12066513/]
- 73. Pan-cancer landscape of cellular senescence heterogeneity ... [https://pmc.ncbi.nlm.nih.gov/articles/PMC12612222/]
- 74. Single-cell senescence identification reveals ... [https://www.sciencedirect.com/science/article/pii/S1550413124000883]
- 75. Research of in vivo reprogramming toward clinical ... [https://pmc.ncbi.nlm.nih.gov/articles/PMC11638634/]
- 76. What is in vivo reprogramming, its potential pros & cons? [https://ipscell.com/2025/10/what-is-in-vivo-reprogramming-its-potential-pros-cons/]
- 77. In Vivo Cellular Reprogramming: The Next Generation - PMC [https://pmc.ncbi.nlm.nih.gov/articles/PMC6234007/]
- 78. Epigenetic regulation of reprogramming and pluripotency [https://www.frontiersin.org/journals/cell-and-developmental-biology/articles/10.3389/fcell.2025.1559183/full]
- 79. CRISPR interference provides increased cell type- ... [https://pmc.ncbi.nlm.nih.gov/articles/PMC10415806/]
- 80. Reprogramming suppresses premature senescence ... [https://pubmed.ncbi.nlm.nih.gov/25390333/]
- 81. Systematic optimization and prediction of cre recombinase for ... [https://genomebiology.biomedcentral.com/articles/10.1186/s13059-025-03560-3]
- 82. CRISPR-Switch regulates sgRNA activity by Cre ... [https://www.nature.com/articles/s41467-019-13403-y]
- 83. Ten quick tips for avoiding pitfalls in multi-omics data ... [https://pmc.ncbi.nlm.nih.gov/articles/PMC10325053/]
- 84. Proteomic aging clock predicts mortality and risk of ... [https://www.nature.com/articles/s41591-024-03164-7]
- 85. Unlocking a new era in medical drug discovery - PubMed - NIH [https://pubmed.ncbi.nlm.nih.gov/40683107/]
- 86. Guidance for Multi-Omics and Multi-Modal Data Integration ... [https://aws.amazon.com/solutions/guidance/multi-omics-and-multi-modal-data-integration-and-analysis/]
- 87. Deep aging clocks: AI-powered strategies for biological ... [https://www.sciencedirect.com/science/article/pii/S1568163725002351]
- 88. 10 common patching problems and how to fix them - Scientifica [https://www.scientifica.uk.com/neurowire/patching-going-terribly-10-common-problems-and-how-to-fix-them-a-guide-for-the-beginner]
- 89. Automated Electrophysiology Assays - NCBI - NIH [https://www.ncbi.nlm.nih.gov/books/NBK424997/]
- 90. Electrophysiology Assay by Ncardia [https://www.ncardia.com/discovery-services/assay-capabilities/electrophysiology]
- 91. Simultaneous recording of electrical and metabolic activity ... [https://pmc.ncbi.nlm.nih.gov/articles/PMC9385991/]
- 92. Activation of Fibroblast Contractility via Cell-Cell Interactions ... [https://pmc.ncbi.nlm.nih.gov/articles/PMC8328620/]
- 93. Contractility Assay by Ncardia [https://www.ncardia.com/discovery-services/assay-capabilities/contractility]
- 94. FAQ: Metabolic Activity Assays - Promega Corporation [https://www.promega.in/resources/pubhub/faq/faq-metabolic-activity-assays/]
- 95. Chemical reprogramming ameliorates cellular hallmarks of ... [https://pmc.ncbi.nlm.nih.gov/articles/PMC12340157/]
- 96. Regeneration and Reprogramming - Introduction to Epigenetics [https://www.ncbi.nlm.nih.gov/books/NBK585715/]
- 97. Cellular Reprogramming Tools Market Rises with USD 480 ... [https://www.biospace.com/press-releases/cellular-reprogramming-tools-market-rises-with-usd-480-million-forecast-in-2025-and-global-r-d-investments]
- 98. The regenerative journey: exploring stem cell roles from injury ... [https://pmc.ncbi.nlm.nih.gov/articles/PMC12502613/]
- 99. Transformative Materials to Create 3D Functional Human ... [https://pmc.ncbi.nlm.nih.gov/articles/PMC11468549/]
- 100. Multimodal profiling reveals tissue-directed signatures of ... [https://www.nature.com/articles/s41590-025-02241-4]
- 101. Resources - AUM Biotech [https://www.aumbiotech.com/resources]
- 102. An in vivo systemic massively parallel platform for ... [https://www.frontiersin.org/journals/genetics/articles/10.3389/fgene.2025.1533900/full]
- 103. Interrogating the regulatory epigenome of cellular senescence [https://pmc.ncbi.nlm.nih.gov/articles/PMC12399507/]
- 104. The controversial role of senescence-associated secretory ... [https://pmc.ncbi.nlm.nih.gov/articles/PMC12595836/]
- 105. Biomarkers of cellular senescence predict risk of mild ... [https://www.sciencedirect.com/science/article/pii/S1279770725000521]
- 106. Biomarkers of cellular senescence and major health outcomes ... [https://pmc.ncbi.nlm.nih.gov/articles/PMC12181601/]