Resolving Stem Cell Heterogeneity: A Comprehensive Guide to scRNA-seq vs. Bulk RNA-seq
Stem cell populations are fundamentally heterogeneous, a characteristic crucial for development, regeneration, and disease.
Resolving Stem Cell Heterogeneity: A Comprehensive Guide to scRNA-seq vs. Bulk RNA-seq
Abstract
Stem cell populations are fundamentally heterogeneous, a characteristic crucial for development, regeneration, and disease. This article provides researchers and drug development professionals with a definitive comparison of single-cell RNA sequencing (scRNA-seq) and bulk RNA sequencing for dissecting this complexity. We explore the foundational principles of each method, detail their specific applications and methodologies in stem cell research, address key technical and analytical challenges, and present strategies for validating and integrating findings. The synthesis offered here serves as a guide for selecting the optimal approach to uncover novel cell states, decipher lineage trajectories, and drive translational discoveries.
Stem Cell Heterogeneity Unveiled: Why Resolution Matters in Transcriptomics
In the quest to understand cellular biology, researchers are often faced with a fundamental choice: to study cell populations as a collective or to investigate the unique signatures of individual cells. This decision is particularly crucial in stem cell research, where seemingly homogeneous populations often harbor functional heterogeneity with profound implications for regenerative medicine and therapeutic development. The choice between bulk RNA sequencing (bulk RNA-seq) and single-cell RNA sequencing (scRNA-seq) represents more than a technical decision—it defines the very resolution at which biological discoveries can be made. Bulk RNA-seq provides a population-average view, akin to hearing the roar of a crowd, while scRNA-seq isolates individual voices within that crowd, revealing the nuanced symphony of cellular individuality. This guide provides an objective comparison of these two transformative technologies, focusing on their application in dissecting stem cell heterogeneity.
Core Technological Principles and Comparisons
Fundamental Workflow Differences
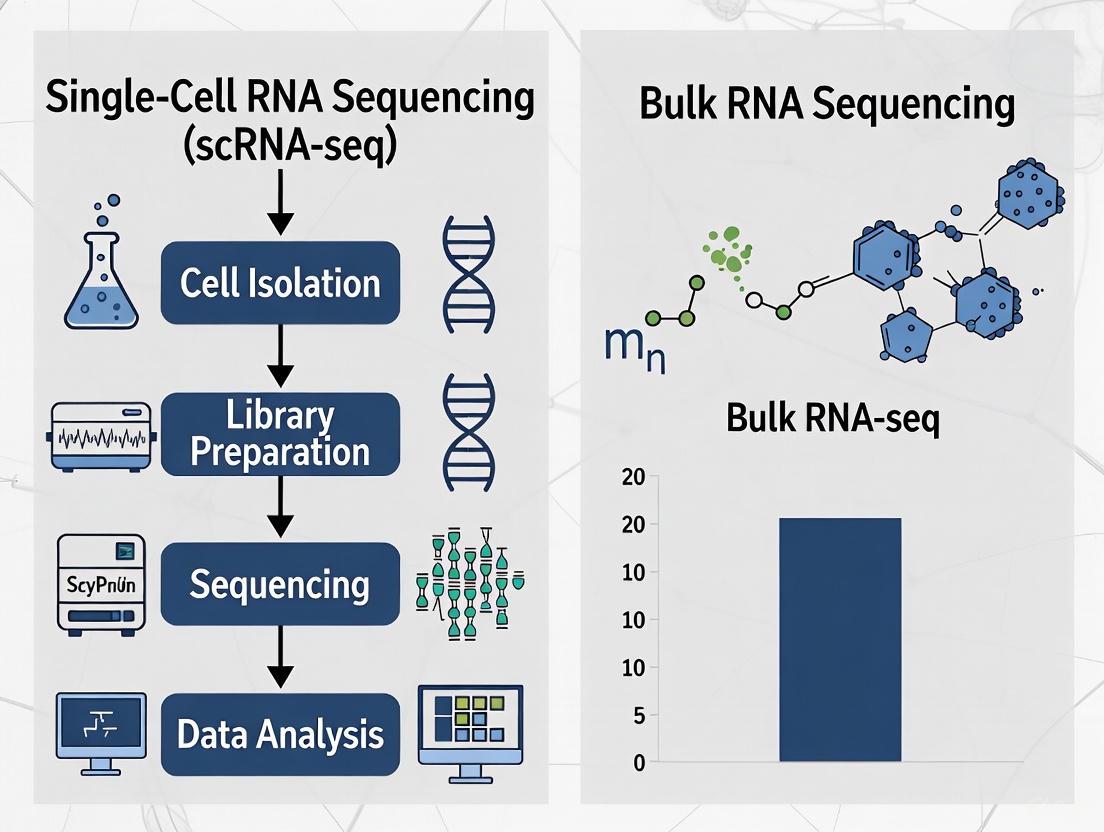
The fundamental difference between these technologies lies at the very beginning of their experimental workflows. Bulk RNA-seq analyzes RNA extracted from thousands to millions of cells simultaneously, resulting in a single, averaged gene expression profile for the entire population [1] [2]. In contrast, scRNA-seq partitions individual cells into separate reaction vessels before RNA isolation and library preparation, allowing transcriptomes to be traced back to their cell of origin [1] [3].
The following diagram illustrates the logical relationship between the two methods and the type of data they produce:
Technical and Practical Comparisons
The choice between bulk and single-cell RNA-seq involves balancing multiple technical and practical considerations, from resolution and cost to data complexity and analytical requirements.
Table 1: Key Characteristics of Bulk vs. Single-Cell RNA-seq
| Feature | Bulk RNA-seq | Single-Cell RNA-seq |
|---|---|---|
| Resolution | Population average [1] [2] | Individual cell level [1] [2] |
| Cost per Sample | Lower (~1/10th of scRNA-seq) [2] | Higher [2] |
| Cell Heterogeneity Detection | Limited [2] | High [2] |
| Rare Cell Type Detection | Limited, masks populations <5% [4] | Possible, can identify rare populations [2] |
| Gene Detection Sensitivity | Higher per sample [2] | Lower per cell [2] |
| Data Complexity | Lower, simpler analysis [2] | Higher, specialized computational methods needed [2] |
| Sample Input Requirement | Higher [2] | Lower [2] |
| Splicing Analysis | More comprehensive [2] | Limited [2] |
| Ideal Application | Homogeneous samples, differential expression [2] | Complex tissues, heterogeneity studies [2] |
Experimental Design and Methodologies
Sample Preparation and Library Construction
The journey from biological sample to sequencing library follows distinctly different paths for bulk and single-cell RNA-seq, with each method presenting unique requirements and challenges.
Bulk RNA-seq Workflow: In bulk RNA-seq, the biological sample is digested to extract total RNA or mRNA, which is then converted to cDNA and processed into a sequencing-ready library representing the entire cell population [1]. Critical quality control steps include RNA integrity assessment, often measured by the RNA Integrity Number (RIN), where a value over six is generally considered acceptable for sequencing [5]. Library preparation methodologies can be tailored to target specific RNA species, such as poly(A)-enrichment for mRNA or rRNA-depletion for broader transcriptome coverage including non-coding RNAs [5].
scRNA-seq Workflow: The scRNA-seq workflow begins with creating viable single-cell suspensions, a step that requires careful optimization to maintain cell viability while preventing clumping [1]. The 10x Genomics Chromium system, a widely adopted platform, utilizes microfluidics to partition individual cells into Gel Beads-in-emulsion (GEMs) [3]. Each GEM contains a single cell, reverse transcription reagents, and a gel bead conjugated with oligonucleotides featuring cell-specific barcodes [3]. After cell lysis, captured RNA molecules are barcoded with unique molecular identifiers (UMIs), enabling transcripts to be traced back to their cell of origin after sequencing [3].
The following workflow diagram outlines the key steps in single-cell RNA sequencing:
Research Reagent Solutions
Successful RNA-seq experiments, particularly in single-cell applications, depend on specialized reagents and platforms designed to address the unique challenges of transcriptome analysis.
Table 2: Essential Research Reagents and Platforms
| Reagent/Platform | Function | Application Context |
|---|---|---|
| Chromium Controller (10x Genomics) | Microfluidic partitioning of single cells into GEMs [3] | scRNA-seq platform enabling high-throughput cell partitioning |
| Chromium Single Cell 3' Reagent Kit | Provides barcoded gel beads and enzymes for scRNA-seq [6] | Reagents for 3' end counting single-cell library construction |
| Smart-seq2 Chemistry | Full-length scRNA-seq protocol with high sensitivity [7] | Plate-based scRNA-seq focusing on transcriptome completeness |
| TrypLE Select | Enzymatic dissociation agent for cell isolation [6] | Generation of single-cell suspensions from tissue cultures |
| UltraCULTURE Serum-free Medium | Defined culture medium for maintaining cell viability [6] | Pre-sequencing cell culture under defined conditions |
| FeatureCounts | Software for assigning sequence reads to genomic features [7] | Read quantification in both bulk and single-cell experiments |
| Seurat R Package | Comprehensive toolkit for scRNA-seq data analysis [7] [6] | Computational analysis, clustering, and visualization of scRNA-seq data |
Application in Stem Cell Heterogeneity Research
Case Study: Uncovering Hidden Heterogeneity in Stem Cell Populations
A compelling illustration of scRNA-seq's power in stem cell research comes from a 2020 study of Wharton's jelly mesenchymal stem/stromal cells (WJMSCs) [6]. Despite their clinical potential, cultured MSCs exhibit functional heterogeneity that complicates their therapeutic application. When researchers applied scRNA-seq to three donor-derived WJMSC populations, they discovered distinct subpopulations with varied functional characteristics related to proliferation, development, and inflammatory response [6].
This hidden heterogeneity was confirmed experimentally by sorting cells based on scRNA-seq-identified surface markers (CD142+ and CD142− subpopulations), which exhibited distinct proliferation capacity and "wound healing" potential in vitro [6]. Such subpopulation dynamics during culture expansion may explain inconsistent clinical outcomes in MSC-based therapies, highlighting how scRNA-seq can identify critical quality attributes for cell manufacturing.
Case Study: Tracking Pluripotency Transitions at Single-Cell Resolution
A 2025 study investigating human embryonic stem cells (ESCs) and feeder-free extended pluripotent stem cells (ffEPSCs) demonstrates scRNA-seq's ability to reconstruct developmental trajectories [7]. Using Smart-seq2-based scRNA-seq, researchers mapped the transition process from primed pluripotency (ESCs) to an earlier pluripotent state (ffEPSCs) through pseudotime analysis [7].
This approach revealed critical molecular pathways involved in pluripotency state transitions and identified distinct subpopulations within both ESCs and ffEPSCs [7]. Such resolution enables researchers to understand the spectrum of pluripotent states present within supposedly homogeneous cultures—information completely inaccessible to bulk RNA-seq, which would merely provide an averaged expression profile masking these transitional states.
Quantitative Data from Comparative Studies
The functional differences between these technologies become particularly evident when examining direct comparisons of their outputs and capabilities.
Table 3: Experimental Data Highlights from Comparative Studies
| Study Context | Bulk RNA-seq Findings | Single-Cell RNA-seq Findings | Reference |
|---|---|---|---|
| Human MSC Cultures | Would show averaged expression of MSC markers | Revealed functionally distinct subpopulations with different proliferation and wound healing capacities [6] | [6] |
| Mouse Embryonic Stem Cells | Masks rare cell types | Identified rare Zscan4+ subpopulation (3 cells out of 94) with greater differentiation potential [2] | [2] |
| Pluripotency Transitions | Provides average transcriptome of population | Mapped continuous transition process and identified distinct subpopulations within cultures [7] | [7] |
| Cell Type Detection | Limited rare cell detection | Identified pulmonary ionocytes (1 in 200 cells) as mediators of cystic fibrosis pathology [2] | [2] |
| Gene Detection Sensitivity | Detects more genes per sample (median 13,378 in PBMCs) | Fewer genes detected per cell (median 3,361 in matched PBMCs) but reveals cell-type specificity [2] | [2] |
Data Analysis and Interpretation
Analytical Approaches for Heterogeneity Studies
The data generated from scRNA-seq requires specialized analytical approaches distinct from bulk RNA-seq. While bulk RNA-seq analysis typically focuses on differential expression between sample groups using tools like DESeq2 or edgeR, scRNA-seq analysis employs a different toolkit designed to capture cellular heterogeneity [8].
The Seurat package provides a comprehensive framework for scRNA-seq analysis, including steps for normalization, highly variable gene identification, dimensionality reduction, and clustering [7] [6]. Unsupervised clustering algorithms applied to scRNA-seq data can reveal transcriptionally distinct subpopulations without prior knowledge of cell types [6]. Pseudotime analysis tools like Monocle can reconstruct cellular trajectories and transition states, as demonstrated in the pluripotency transition study [7].
A critical step in scRNA-seq analysis is batch effect correction, particularly important when integrating datasets from different experiments or donors [6]. Computational methods have been developed to remove technical artifacts while preserving biological heterogeneity, enabling more robust identification of cell subpopulations.
The choice between bulk and single-cell RNA-seq is not a matter of one technology being superior to the other, but rather selecting the appropriate tool for the biological question at hand. Bulk RNA-seq remains a powerful, cost-effective approach for identifying average expression differences between sample groups, detecting novel transcripts, and conducting large-scale studies where population-level insights are sufficient. In contrast, scRNA-seq provides unprecedented resolution for mapping cellular heterogeneity, identifying rare cell types, reconstructing developmental trajectories, and understanding tumor microenvironments.
For stem cell research, where cellular heterogeneity has profound functional implications, scRNA-seq offers transformative potential. It enables researchers to dissect the spectrum of pluripotent states, identify stem cell subpopulations with distinct therapeutic potentials, and understand how culture conditions influence cellular composition. As both technologies continue to evolve, hybrid approaches that leverage both bulk and single-cell methods will likely provide the most comprehensive understanding of stem cell biology—combining the statistical power of bulk sequencing with the high-resolution insights of single-cell analysis.
In stem cell biology, where cellular heterogeneity is a fundamental principle, the choice of transcriptomic tool is paramount. While bulk RNA sequencing (bulk RNA-seq) has been a workhorse for gene expression studies, its critical limitation lies in its inability to resolve rare subpopulations and transient cellular states, which are often key to understanding stem cell function, lineage commitment, and disease pathogenesis. This guide objectively compares the performance of bulk RNA-seq and single-cell RNA sequencing (scRNA-seq), providing experimental data and methodologies that highlight the necessity of single-cell resolution for advanced stem cell research.
The Fundamental Limitation: Averaging Obscures Biology
Bulk RNA-seq analyzes the pooled RNA from a population of cells, resulting in a single, averaged gene expression profile for the entire sample [1] [4]. This approach effectively masks underlying cellular heterogeneity [2]. In a heterogeneous sample like a stem cell niche, the unique transcriptional signatures of rare stem cell subpopulations, transitional progenitor states, or differentiated cells are blended into a single composite signal.
- Context of Stem Cell Heterogeneity: Stem cell populations are not uniform; they consist of cells in different states of quiescence, activation, and early commitment [3]. Bulk RNA-seq can identify the average expression of markers for a "stem cell population" but fails to distinguish these distinct and dynamic sub-states. For example, a rare drug-resistant subpopulation or a transient state during differentiation cannot be detected if its signal is diluted by the majority cell population [3] [2].
- Contrast with Single-Cell Resolution: scRNA-seq profiles the transcriptome of each individual cell within a sample [1]. This allows researchers to:
The following table summarizes the core technical differences that lead to this divergence in biological insight.
Table 1: Core Technical and Analytical Differences Between Bulk and Single-Cell RNA-seq
| Feature | Bulk RNA-Seq | Single-Cell RNA-Seq |
|---|---|---|
| Resolution | Population average [1] [4] | Individual cell level [1] [4] |
| Cell Heterogeneity Detection | Limited; masks differences [2] | High; reveals differences [2] |
| Rare Cell Type Detection | Not possible; signals are diluted [2] | Possible; can identify populations making up <1% of cells [2] |
| Gene Detection Sensitivity | Higher per sample (detects more genes) [2] | Lower per cell (transcript dropouts are common) [2] [9] |
| Cost per Sample | Lower [2] | Higher [2] |
| Data Complexity | Lower; standard statistical methods [2] | Higher; specialized computational methods required [2] |
| Ideal Application | Differential expression between homogeneous conditions [4] | Deconstructing heterogeneity, discovering new types/states [4] |
Experimental Evidence: How scRNA-seq Reveals What Bulk Hides
The theoretical limitation of bulk RNA-seq has been consistently demonstrated in practical research, particularly in oncology and immunology, which share the challenge of heterogeneity with stem cell biology.
Case Study: Discovering Rare Subpopulations in Cancer
A landmark study on B-cell acute lymphoblastic leukemia (B-ALL) provides a powerful example. Researchers leveraged both bulk and single-cell RNA-seq on clinical samples. While bulk analysis provided an overview, scRNA-seq was critical for identifying rare cell states responsible for resistance to a common chemotherapeutic agent, asparaginase. This rare population's unique expression profile was undetectable in the bulk data but became clear at single-cell resolution, offering a potential new target for therapeutic intervention [1].
Case Study: Uncovering Novel Drivers in Dilated Cardiomyopathy
In a study of dilated cardiomyopathy (DCM), researchers constructed a single-cell atlas from heart tissue. They identified novel subpopulations of fibroblasts and M2 macrophages with distinct functional roles in disease progression. For instance, they found a specific subpopulation of M2-like2 macrophages enriched in pro-fibrotic and metabolic pathways. When they applied deconvolution algorithms to bulk RNA-seq data from the same condition, they confirmed a significant increase in this specific M2-like2 subpopulation in DCM samples. This finding, which was obscured in the initial bulk analysis, suggested a more important and specific role for this rare population in the disease [10].
Table 2: Quantitative Performance Comparison from Benchmarking Studies
| Performance Metric | Bulk RNA-Seq | 10x Genomics 3' v3 (scRNA-seq) | Drop-seq (scRNA-seq) |
|---|---|---|---|
| Median Genes Detected per Cell | ~13,378 (per sample) [2] | ~4,776 (per cell) [9] | ~3,255 (per cell) [9] |
| Median UMIs Detected per Cell | Not Applicable | ~28,006 [9] | ~8,791 [9] |
| Cell Recovery Rate | Not Applicable | High (~30-80%) [9] | Low (<2%) [9] |
| Multiplet Rate | Not Applicable | ~5% (at target loading) [9] | ~5% (at target loading) [9] |
Experimental Protocols for scRNA-seq
To generate the kind of data that reveals hidden populations, robust and standardized wet-lab and computational protocols are essential. The following workflow is widely adopted for high-throughput scRNA-seq using the 10x Genomics platform, as cited in several studies [10] [3] [9].
Wet-Lab Protocol: From Tissue to Sequencing Library
- Single-Cell Suspension Preparation: The starting tissue is dissociated using enzymatic (e.g., collagenase) or mechanical means to create a viable single-cell suspension. For immune cells from blood or bone marrow, density gradient centrifugation may be used. Cell viability and concentration are assessed, and samples are filtered to remove clumps and debris [1] [3].
- Single-Cell Partitioning and Barcoding (10x Genomics): The single-cell suspension is loaded onto a microfluidic chip (Chromium Controller or X-series) along with gel beads. Each bead is coated with oligonucleotides containing:
- A Poly(dT) sequence to capture mRNA.
- A Cell Barcode (10x Barcode) that is unique to each gel bead and labels all mRNA from a single cell.
- A Unique Molecular Identifier (UMI) to label individual mRNA molecules and correct for amplification bias.
- PCR adapter sequences for Illumina sequencing. The instrument partitions thousands of cells into nanoliter-scale droplets (GEMs), where cell lysis and reverse transcription occur, producing barcoded cDNA [3].
- Library Preparation and Sequencing: The barcoded cDNA is purified, amplified via PCR, and enzymatically fragmented to construct a sequencing library. The library is then sequenced on an Illumina platform, typically with a read depth of 20,000-100,000 reads per cell [3] [9].
Computational Analysis Protocol
- Primary Analysis (Cell Ranger): Raw sequencing data (FASTQ files) are processed using 10x Genomics' Cell Ranger software. It performs demultiplexing, alignment to a reference genome, and UMI counting to generate a feature-barcode matrix, which lists gene counts (features) for each cell (barcode) [3].
- Quality Control and Filtering: Low-quality cells are filtered out based on metrics like the number of genes detected per cell, total UMI counts per cell, and the percentage of mitochondrial reads (indicative of stressed or dying cells) [8] [9].
- Dimensionality Reduction and Clustering: The high-dimensional data is normalized and scaled. Principal Component Analysis (PCA) is performed, followed by graph-based clustering on the principal components. Cells are visualized in 2D using t-Distributed Stochastic Neighbor Embedding (t-SNE) or Uniform Manifold Approximation and Projection (UMAP) [10] [8].
- Differential Expression and Annotation: Marker genes for each cluster are identified. Researchers then annotate cell types by comparing these marker genes to known canonical markers (e.g., CD45 for immune cells, MYH6 for cardiomyocytes). This step is where novel or rare populations are discovered and characterized [10].
The logical relationship and data flow in this process can be visualized as follows:
The Scientist's Toolkit: Essential Reagent Solutions
The following reagents and kits are fundamental to executing the scRNA-seq experiments described in the literature.
Table 3: Key Research Reagent Solutions for scRNA-seq
| Item | Function | Example/Note |
|---|---|---|
| Chromium Single Cell 3' or 5' Kit | Provides all reagents for GEM generation, barcoding, and library construction. | The core kit from 10x Genomics; choice of 3' or 5' depends on whether gene expression (3') or immune profiling (5') is the goal [1]. |
| Single Cell Partitioning Instrument | Automates the formation of single-cell GEMs. | Chromium Controller or Chromium X series [3]. |
| Enzymatic Dissociation Kit | Liberates individual cells from solid tissue for suspension. | Collagenase-based kits; protocol must be optimized per tissue type to maximize viability and minimize stress [11]. |
| Viability Stain | Distinguishes live from dead cells for quality control. | Propidium Iodide (PI) or DAPI for flow cytometry; fluorescent exclusion dyes like DRAQ7 are compatible with the 10x protocol [9]. |
| Bioanalyzer/TapeStation | Assesses the quality and size distribution of the final sequencing library. | Agilent Bioanalyzer with High Sensitivity DNA kit is commonly used [8]. |
| Cell Ranger Software | The standard primary analysis pipeline for 10x Genomics data. | Performs sample demultiplexing, barcode processing, and UMI counting [3]. |
For research questions centered on the collective average behavior of a cell population, bulk RNA-seq remains a cost-effective and powerful tool [2]. However, the critical limitation of bulk RNA-seq in masking rare but biologically crucial populations and transient states is undeniable and has been consistently demonstrated across diverse fields [10] [1] [3]. The advent of scRNA-seq provides the necessary resolution to dissect this complexity, revealing the true cellular diversity within stem cell niches, tumor microenvironments, and diseased tissues. The choice between these technologies should be a deliberate one, guided by the specific research hypothesis and a clear understanding of the trade-offs between cost, complexity, and the indispensable depth of biological insight.
Stem cell (SC) niches are highly specialized microenvironments that regulate stem cell fate, including quiescence, self-renewal, and differentiation [12]. For decades, our understanding of these niches was limited to histological imaging and genetic tools, which provided foundational knowledge but lacked comprehensive molecular resolution [12]. The advent of transcriptomic technologies has revolutionized this field, transitioning from bulk RNA sequencing (bulk RNA-seq), which averages gene expression across entire populations, to single-cell RNA sequencing (scRNA-seq), which resolves transcriptional profiles at the individual cell level [3] [13].
This technological evolution is akin to moving from viewing a forest as a single entity to distinguishing every tree within it [1]. For stem cell researchers, this resolution is paramount—stem cells are rare, heterogeneous, and exist in complex milieus alongside various supportive cell types [12] [14]. This guide objectively compares bulk and single-cell RNA sequencing methodologies within the context of stem cell heterogeneity research, providing experimental data, protocols, and analytical frameworks to inform research design and implementation.
Technical Comparison: Bulk vs. Single-Cell RNA Sequencing
Fundamental Methodological Differences
Bulk RNA-seq and scRNA-seq differ fundamentally in their sample preparation, sequencing approaches, and data output. Bulk RNA-seq analyzes the collective RNA from a population of cells, resulting in an averaged gene expression profile for the entire sample [1] [2]. In contrast, scRNA-seq isolates individual cells before sequencing, enabling the investigation of gene expression variations within a heterogeneous population [1] [2].
The core technological advancement enabling scRNA-seq is the precise partitioning of individual cells. The 10X Genomics Chromium system, for instance, uses microfluidics to generate Gel Beads-in-emulsion (GEMs), where each GEM contains a single cell, a gel bead with a unique cell barcode, and reverse transcription reagents [15] [3]. This allows RNA from each cell to be tagged with a unique barcode, enabling sequencing and subsequent computational attribution of transcripts to their cell of origin [1] [3].
Comparative Technical Specifications
Table 1: Technical comparison between bulk RNA-seq and single-cell RNA-seq
| Feature | Bulk RNA-Seq | Single-Cell RNA-Seq |
|---|---|---|
| Resolution | Population average [1] | Individual cell level [1] |
| Cost per Sample | Lower (~$300 per sample) [2] | Higher (~$500-$2000 per sample) [2] |
| Cell Heterogeneity Detection | Limited, masks differences [2] | High, reveals subpopulations [2] |
| Rare Cell Type Detection | Limited, obscured by abundant cells [2] | Possible, can identify rare populations [2] |
| Gene Detection Sensitivity | Higher, detects more genes per sample [2] | Lower due to sparsity and technical noise [2] [13] |
| Sample Input Requirement | Higher, typically micrograms of RNA [2] | Lower, single cells or picograms of RNA [2] |
| Data Complexity | Lower, simpler analysis [1] [2] | Higher, requires specialized computational methods [1] [2] |
| Splicing Analysis | More comprehensive [2] | Limited [2] |
| Experimental Workflow | RNA extraction from tissue → library prep → sequencing [1] | Tissue dissociation → single-cell suspension → cell partitioning → library prep → sequencing [1] |
Experimental Evidence in Stem Cell Research
Case Study: Deconstructing Hematopoietic Stem Cell Niches
Single-cell approaches have fundamentally advanced our understanding of the bone marrow microenvironment supporting hematopoietic stem cells (HSCs). scRNA-seq analysis of bone marrow endothelial cells (BMECs) revealed two transcriptionally distinct subpopulations: Ly6ahigh arteriolar and Stab2high sinusoidal cells, with an additional Vwf-expressing endosteal population [12]. This heterogeneity had been masked in bulk analyses.
Critically, these endothelial subpopulations differentially express key niche factors. Arteriolar cells show enriched expression of the essential HSC maintenance factor Kitl (Stem Cell Factor) [12]. Functional validation demonstrated that selective deletion of Kitl from the arteriolar—but not sinusoidal—compartment significantly reduced long-term HSC percentages and numbers, establishing a specialized role for arteriolar endothelial cells in HSC maintenance [12].
Similarly, scRNA-seq of bone marrow mesenchymal stromal cells identified distinct adipo- and osteo-primed progenitor populations with specific spatial distributions: adipo-primed cells (Leprhigh) co-localize with sinusoidal ECs, while osteo-primed cells reside near arteriolar ECs [12]. This level of resolution demonstrates how scRNA-seq can deconstruct the complex cellular architecture of stem cell niches.
Case Study: Identifying Novel Stem Cell Subpopulations
In neural stem cell (NSC) research, single-cell approaches have defined niches and identified microglial ligands that enhance precursor-mediated oligodendrogenesis [16]. This work exemplifies how scRNA-seq can reveal not only cellular heterogeneity but also functional interactions within niches.
In cancer stem cell (CSC) research, a study on lung adenocarcinoma (LUAD) used scRNA-seq to identify epithelial cell subclusters with varying stemness potential [14]. The cluster with the highest stemness (Epi_C1) showed enrichment for specific gene signatures, enabling construction of a prognostic model. The researchers further identified TAF10 as a critical oncogene linked to stemness and poor prognosis, demonstrating how single-cell resolution can pinpoint potential therapeutic targets within rare stem-like populations [14].
Table 2: Key discoveries in stem cell research enabled by scRNA-seq
| Stem Cell System | Bulk RNA-seq Limitations | scRNA-seq Revelations | Experimental Validation |
|---|---|---|---|
| Hematopoietic Stem Cells | Masked endothelial cell heterogeneity [12] | Identified transcriptionally distinct arteriolar (Ly6ahigh) and sinusoidal (Stab2high) BMECs [12] | Genetic deletion of Kitl from arteriolar ECs reduced LT-HSC numbers [12] |
| Neural Stem Cells | Unable to resolve niche interactions at single-cell level [16] | Defined microglial ligands enhancing oligodendrogenesis [16] | Functional assays confirming enhanced precursor differentiation [16] |
| Cancer Stem Cells (LUAD) | Could not identify rare stem-like subpopulations [14] | Revealed epithelial subcluster (Epi_C1) with high stemness potential [14] | Silencing TAF10 inhibited proliferation and tumor sphere formation [14] |
| Umbilical Cord Blood HSPCs | Averaged transcriptomes of CD34+ and CD133+ populations [15] | Showed strong correlation (R=0.99) between CD34+ and CD133+ HSPC transcriptomes [15] | Integrated analysis of sorted populations creating "pseudobulk" references [15] |
Experimental Protocols and Methodologies
Standardized scRNA-seq Workflow for Stem Cell Research
A optimized scRNA-seq protocol for hematopoietic stem and progenitor cells (HSPCs) from human umbilical cord blood demonstrates key considerations for stem cell research [15]:
1. Cell Isolation and Sorting:
- Obtain mononuclear cells via Ficoll-Paque density gradient centrifugation [15].
- Stain with antibody panels for surface markers (e.g., Lineage cocktail-FITC, CD45-PE-Cy7, CD34-PE, CD133-APC) [15].
- Sort target populations using FACS (e.g., CD34+Lin-CD45+ and CD133+Lin-CD45+ HSPCs) [15].
- Critical: Maintain cell viability and minimize stress during dissociation, which can alter transcriptional states [13].
2. Single-Cell Library Preparation:
- Process sorted cells immediately using Chromium Controller (10X Genomics) [15].
- Use Chromium Next GEM Chip G Single Cell Kit and Single Cell 3' GEM, Library & Gel Bead Kit v3.1 [15].
- Aim for 25,000 reads per cell on Illumina NextSeq 1000/2000 with P2 flow cell chemistry [15].
3. Quality Control Parameters:
- Exclude cells with <200 or >2,500 detected genes [15].
- Remove cells with >5% mitochondrial transcript content [15].
- For neural tissues, consider single-nuclei RNA-seq (snRNA-seq) as nuclei are more resistant to mechanical stress during freeze-thaw cycles [13].
Bulk RNA-seq Deconvolution Approaches
While bulk RNA-seq cannot inherently resolve cellular heterogeneity, computational deconvolution methods can infer cellular composition when paired with scRNA-seq reference data:
- Algorithm Options: xCell, EPIC, MCP-counter, and CIBERSORT can identify cell type proportions in bulk RNA-seq datasets using scRNA-seq-derived signatures [10].
- Validation: In dilated cardiomyopathy research, deconvolution of bulk RNA-seq data confirmed the significant increase in M2-like2 macrophage subpopulations initially identified through scRNA-seq [10].
Visualization and Data Analysis
scRNA-seq Data Analysis Workflow
The analytical workflow for scRNA-seq data involves several specialized computational steps:
Preprocessing:
- Raw sequencing data (BCL files) are demultiplexed and converted to FASTQ files [15].
- Alignment to a reference genome (e.g., GRCh38) using Cell Ranger or customized pipelines [15] [13].
- Generation of a count matrix linking genes to individual cells [13].
Downstream Analysis:
- Normalization using methods like SCTransform to mitigate technical noise [15].
- Dimensionality reduction using Principal Component Analysis (PCA) [13].
- Clustering and visualization with UMAP (Uniform Manifold Approximation and Projection), which better preserves global data structure compared to t-SNE [15] [13].
- Cell type annotation based on marker gene expression [14].
- Advanced analyses: trajectory inference (pseudotime), transcription factor regulatory networks, cell-cell communication [10] [13].
Stem Cell Niche Signaling Pathways
Cell-cell communication analysis within stem cell niches reveals critical signaling axes maintaining stem cell function. In dilated cardiomyopathy research, cell-cell communication analysis indicated the GAS6-MERTK axis might mediate interactions between M2 macrophage subsets [10].
The Scientist's Toolkit: Essential Research Reagents
Table 3: Key research reagent solutions for stem cell niche scRNA-seq studies
| Reagent Category | Specific Examples | Function in Experiment |
|---|---|---|
| Cell Surface Markers | CD34, CD133 (PROM1), CD45, Lineage cocktail (CD235a, CD2, CD3, CD14, CD16, CD19, CD24, CD56, CD66b) [15] | Isolation of specific stem/progenitor cell populations via FACS |
| scRNA-seq Library Prep Kits | Chromium Next GEM Chip G Single Cell Kit, Chromium Next GEM Single Cell 3' GEM, Library & Gel Bead Kit v3.1 [15] | Partitioning cells, barcoding transcripts, and preparing sequencing libraries |
| Cell Sorting Reagents | Ficoll-Paque for density gradient centrifugation [15] | Isolation of mononuclear cells from complex tissues |
| Bioinformatic Tools | Seurat (v5.0.1), Cell Ranger (v7.2.0), CytoTRACE [15] [14] | Data processing, normalization, clustering, and stemness prediction |
| Spatial Analysis Frameworks | scNiche, BANKSY, CellCharter [17] | Identification and characterization of cell niches from spatial omics data |
The choice between bulk and single-cell RNA sequencing depends on research goals, budget, and sample characteristics. Bulk RNA-seq remains valuable for large-scale studies, differential gene expression analysis in homogeneous populations, and biomarker discovery when budget constraints exist [1] [2]. However, for resolving cellular heterogeneity, identifying rare stem cell populations, deconstructing complex niches, and understanding lineage trajectories, scRNA-seq provides unparalleled resolution [12] [14].
Emerging methodologies like spatial transcriptomics and multi-omics approaches will further enhance our ability to contextualize stem cells within their anatomical niches [3] [17]. For comprehensive understanding, many studies now employ a hybrid approach—using scRNA-seq to define cellular subpopulations and their signatures, then applying these signatures to deconvolute bulk RNA-seq data from larger cohorts [10] [14]. This strategic integration of technologies maximizes both resolution and scale, accelerating discovery in stem cell biology and regenerative medicine.
In the field of stem cell research, cellular heterogeneity presents a fundamental challenge. While bulk RNA sequencing provides an averaged gene expression profile across a population of cells, it inevitably masks the rare cell types and continuous transitional states that characterize stem cell biology, from embryonic development to tissue regeneration and disease modeling. Single-cell RNA sequencing (scRNA-seq) has emerged as a revolutionary technology that enables researchers to dissect this complexity at the resolution of individual cells, uncovering novel subtypes, delineating developmental trajectories, and identifying rare stem cell populations that would otherwise be averaged out in bulk measurements [3] [18].
The selection of an appropriate scRNA-seq platform is paramount to the success of these investigations, as different methodologies offer distinct trade-offs in critical performance metrics. Three technical parameters—sensitivity, throughput, and multiplet rate—are particularly crucial for designing robust experiments and generating biologically meaningful data. Sensitivity determines the ability to detect low-abundance transcripts, which is essential for identifying key regulatory genes and transcription factors. Throughput defines the number of cells that can be profiled, enabling comprehensive characterization of heterogeneous populations. The multiplet rate indicates the frequency at which multiple cells are incorrectly captured together, potentially creating artificial cell states that confound data interpretation [19] [9]. This guide provides an objective comparison of current scRNA-seq technologies, focusing on these key performance metrics within the context of stem cell research applications.
Comparative Performance Analysis of scRNA-seq Platforms
Quantitative Comparison of Key Performance Metrics
Systematic benchmarking studies conducted under controlled conditions provide the most reliable data for platform selection. The following table synthesizes performance metrics from a comprehensive study that evaluated seven high-throughput scRNA-seq methods using a defined mixture of immune cell lines, which serves as an excellent model for assessing capability to resolve heterogeneous populations [9].
Table 1: Performance Metrics of High-Throughput scRNA-seq Methods
| Method/System | mRNA Detection Sensitivity (Median Genes/Cell) | mRNA Detection Sensitivity (Median UMIs/Cell) | Cell Capture Rate | Multiplet Rate | Cell-Assignable Reads |
|---|---|---|---|---|---|
| 10x Genomics 3' v3 | 4,776 | 28,006 | ~80% | ~5% | ~50-75% |
| 10x Genomics 5' v1 | 4,470 | 25,988 | ~80% | ~5% | ~50-75% |
| 10x Genomics 3' v2 | 3,882 | 21,570 | ~80% | ~5% | ~50-75% |
| ddSEQ | 3,644 | 10,466 | <2% | ~5% | <25% |
| Drop-seq | 3,255 | 8,791 | <2% | ~5% | <25% |
| ICELL8 3' DE | Information Not Available | Information Not Available | ~30% | ~5% | >90% |
The data reveal clear performance differences across platforms. The 10x Genomics 3' v3 and 5' v1 kits demonstrated superior mRNA detection sensitivity, recovering approximately 1.5 times more genes and 2.5-3 times more transcripts per cell compared to ddSEQ and Drop-seq methods [9]. This enhanced sensitivity is critical for stem cell applications where detecting low-abundance regulatory genes is essential for identifying transitional states and rare subpopulations.
Cell capture rates varied significantly, with the 10x Genomics methods recovering approximately 80% of input cells, dramatically higher than the less than 2% recovery rates observed with ddSEQ and Drop-seq [9]. For precious stem cell samples, where cell numbers may be limited, higher capture rates ensure efficient utilization of available biological material. All methods maintained multiplet rates around the targeted 5% level, indicating proper experimental loading concentrations [9].
Methodologies of Benchmarking Experiments
The comparative data presented in Table 1 were generated through a rigorously controlled benchmarking study designed to eliminate variables that often complicate cross-platform comparisons. The experimental approach involved [9]:
- Standardized Sample Preparation: A defined 1:1:1:1 mixture of four lymphocyte cell lines (EL4 mouse T cells, IVA12 mouse B cells, Jurkat human T cells, and TALL-104 human T cells) was used. This created a system of known heterogeneity with distinguishable cell types.
- Cross-Species Design: The inclusion of both human and mouse cell lines enabled clear identification of multiplet events (barcodes containing significant fractions of both human and mouse transcripts) and accurate calculation of multiplet rates.
- Normalized Sequencing Depth: All libraries were sequenced to a consistent depth of approximately 50,000 reads per cell to ensure fair comparison independent of sequencing limitations.
- Uniform Bioinformatics Processing: A standardized computational pipeline was applied across all datasets for cell identification, UMI counting, and gene expression quantification.
This stringent experimental design provides highly comparable performance metrics that reflect inherent methodological differences rather than variations in experimental execution or sequencing depth.
Experimental Protocols and Workflows
Core scRNA-seq Experimental Workflow
The following diagram illustrates the generalized workflow for droplet-based scRNA-seq, which encompasses methods such as 10x Genomics, ddSEQ, and Drop-seq:
Diagram 1: Core scRNA-seq Experimental Workflow
The workflow consists of three major phases: sample preparation, single-cell processing, and library generation. The sample preparation phase is particularly critical for stem cell research, as dissociation protocols must be optimized to maintain cell viability while preserving transcriptional states [1].
Technological Differences in scRNA-seq Protocols
Different scRNA-seq methods employ distinct approaches for cell isolation, barcoding, and amplification, which directly impact their performance characteristics. The following diagram illustrates the key differences between full-length and end-counting protocols:
Diagram 2: scRNA-seq Protocol Classification by Transcript Coverage
Full-length transcript protocols (e.g., Smart-Seq2, MATQ-Seq) provide comprehensive coverage across transcripts, enabling analysis of isoform usage, allelic expression, and RNA editing. However, these methods typically have lower throughput and higher cost per cell. In contrast, 3' or 5' end-counting protocols (e.g., Drop-Seq, inDrop, 10x Genomics Chromium) focus sequencing resources on transcript ends with cell barcodes and UMIs, enabling much higher throughput and lower cost per cell, making them suitable for profiling thousands of cells in heterogeneous stem cell populations [19].
The 10x Genomics platform utilizes microfluidic chips to partition single cells into Gel Beads-in-emulsion (GEMs). Each GEM contains a single cell, reverse transcription reagents, and a gel bead conjugated with oligonucleotides containing cell barcodes, UMIs, and poly-dT primers. After cell lysis, mRNA is captured and barcoded with cell-specific identifiers, ensuring that transcripts from each cell can be traced back to their origin [3].
The Scientist's Toolkit: Essential Research Reagents and Materials
Successful scRNA-seq experiments require careful selection of reagents and materials optimized for single-cell applications. The following table details essential components for planning and executing scRNA-seq studies in stem cell research:
Table 2: Essential Research Reagents and Materials for scRNA-seq
| Category | Specific Examples | Function & Importance |
|---|---|---|
| Cell Isolation & Handling | Enzymatic dissociation kits (e.g., collagenase, trypsin), Cell strainers, DNase I, Fetal Bovine Serum (FBS) for quenching | Generate high-viability single-cell suspensions while preserving RNA integrity and minimizing stress responses [1]. |
| Viability Assessment | Trypan blue, Acridine Orange/Propidium Iodide (AO/PI) stains, Flow cytometry antibodies | Determine cell health and concentration; critical for optimizing loading concentrations and minimizing multiplets [1]. |
| scRNA-seq Kits | 10x Genomics Chromium Next GEM Single Cell 3' or 5' Kits, SMART-Seq HT Plus Kit | Provide all necessary reagents for reverse transcription, barcoding, cDNA amplification, and library preparation [20] [9]. |
| Sample Multiplexing | Cell Multiplexing Oligos (CMOs), Lipid-based barcodes | Enable sample pooling by labeling cells from different conditions with unique barcodes, reducing batch effects and costs [20]. |
| Library Quantification & QC | TapeStation D5000 ScreenTape, Qubit dsDNA HS Assay, qPCR kits | Accurately quantify final library concentration and quality before sequencing [20]. |
| Bioinformatics Tools | Cell Ranger, Seurat, Scanpy, Bioconductor packages | Process raw sequencing data, perform quality control, normalization, clustering, and differential expression analysis [19] [14]. |
For stem cell applications, specific considerations include selecting dissociation protocols that minimize transcriptional stress responses and using viability assessment methods that accurately distinguish live cells from apoptotic cells, as dead cells can significantly increase background noise in scRNA-seq data.
The comparative performance data presented in this guide demonstrates that modern droplet-based scRNA-seq platforms, particularly the 10x Genomics 3' v3 and 5' v1 systems, offer favorable combinations of sensitivity, throughput, and controlled multiplet rates for stem cell heterogeneity research. The high cellular throughput enables comprehensive profiling of heterogeneous stem cell populations, while the superior sensitivity allows detection of low-abundance transcripts characteristic of regulatory genes and transitional states. When designing scRNA-seq experiments for stem cell research, researchers should consider: (1) selecting platforms with sufficient sensitivity to detect key regulatory genes, (2) ensuring adequate cell throughput to capture rare subpopulations, and (3) optimizing cell loading concentrations to control multiplet rates while maximizing cell recovery. As scRNA-seq technologies continue to evolve, the integration with other single-cell modalities and spatial transcriptomics will further enhance our ability to dissect stem cell heterogeneity within tissue contexts [18].
A Practical Guide to Applications: When to Deploy scRNA-seq or Bulk RNA-seq in Your Stem Cell Workflow
In the field of stem cell research, understanding transcriptional heterogeneity is crucial for unraveling differentiation pathways, identifying rare progenitor populations, and developing regenerative therapies. While single-cell RNA sequencing (scRNA-seq) has revolutionized our ability to dissect cellular diversity at unprecedented resolution, bulk RNA-seq remains an indispensable tool in the molecular biologist's arsenal. This guide objectively examines the ideal use cases for bulk RNA-seq, presenting its distinct advantages and limitations through experimental data and methodological frameworks relevant to researchers investigating stem cell heterogeneity.
Key Strengths and Technical Advantages of Bulk RNA-Seq
Bulk RNA-seq provides a population-average gene expression profile from a mixed pool of cells, delivering a comprehensive overview of the transcriptome [21]. This approach offers several distinct technical advantages that make it ideally suited for specific research scenarios.
The workflow for bulk RNA-seq begins with RNA extraction from a tissue or cell population, followed by library preparation that typically involves RNA fragmentation, reverse transcription into cDNA, and adapter ligation [22]. The resulting libraries are then sequenced using next-generation sequencing platforms, generating data that represents the averaged gene expression levels across all cells in the sample [1]. This averaged readout is particularly valuable for detecting consistent transcriptional patterns across biological replicates, making it well-suited for differential expression analysis between experimental conditions or sample groups [1] [23].
A significant advantage of bulk RNA-seq is its cost-effectiveness and technical accessibility. The per-sample cost is substantially lower than scRNA-seq, making it feasible for large-scale studies requiring numerous replicates [21]. The protocol is more straightforward, with less complex sample preparation that doesn't require specialized equipment for cell partitioning [1]. Additionally, the computational analysis of bulk RNA-seq data benefits from well-established, standardized pipelines and tools, reducing the bioinformatics burden [21] [23].
Bulk RNA-seq also demonstrates superior sensitivity for detecting low-abundance transcripts due to the deeper sequencing coverage achievable per sample without the constraints of cellular barcoding [1]. This enhanced sensitivity, combined with the ability to process larger input RNA quantities, makes it particularly valuable for capturing subtle transcriptional changes in stem cell populations undergoing differentiation or responding to environmental cues.
Ideal Application 1: Differential Expression Analysis
Differential expression (DE) analysis represents one of the most robust and validated applications of bulk RNA-seq. This approach identifies systematic expression changes between distinct biological conditions, such as treated versus control samples or different developmental stages.
Experimental Protocol for DE Analysis
A standard DE analysis workflow utilizing bulk RNA-seq involves multiple critical stages [23]:
- Sample Preparation: Extract high-quality RNA (RIN > 6) from stem cell populations under comparison (e.g., pluripotent vs. differentiated states).
- Library Construction: Use either poly(A) enrichment or rRNA depletion to prepare sequencing libraries. Paired-end sequencing is recommended for improved mapping accuracy.
- Read Quantification: Align sequences to a reference genome/transcriptome using tools like STAR or perform pseudoalignment with tools like Salmon to generate gene-level count matrices.
- Statistical Analysis: Import count data into R/Bioconductor and utilize specialized packages like DESeq2 or limma-voom to identify significantly differentially expressed genes based on negative binomial models [23].
Key Experimental Evidence
- A comprehensive analysis of dilated cardiomyopathy (DCM) successfully integrated bulk RNA-seq with scRNA-seq data, using machine learning algorithms to identify significant differences in fibroblasts, T cells, and macrophages between DCM and normal samples [10]. The bulk data provided validated differential expression patterns across cell types.
- In Alzheimer's disease research, a meta-analysis of bulk RNA-seq datasets identified 12 differentially expressed genes (9 upregulated, 3 downregulated) between patients and controls, revealing TTR as a potential diagnostic biomarker [24]. The statistical power derived from analyzing 221 samples demonstrated bulk RNA-seq's capacity for robust differential expression detection in complex diseases.
Table 1: Performance Metrics for Bulk RNA-seq in Differential Expression Studies
| Study Type | Sample Size | Key Findings | Statistical Rigor |
|---|---|---|---|
| Cardiac Disease [10] | Integrated multiple datasets | Identified fibroblast and macrophage differences in DCM | Machine learning validation with scRNA-seq |
| Neurodegenerative Disease [24] | 221 patients & controls | Identified 12 DEGs including TTR | FDR correction, independent validation |
| Stem Cell Differentiation (Typical) | 5-10 per condition | 100-5000 DEGs typically detected | Adjusted p-value < 0.05, log2FC > 1 |
Figure 1: Bulk RNA-seq differential expression analysis workflow for stem cell research.
Ideal Application 2: Biomarker Discovery
Bulk RNA-seq excels in identifying molecular signatures for disease diagnosis, prognosis, and therapeutic response prediction. Its capacity to profile large patient cohorts enables the detection of consistent biomarker patterns with statistical significance.
Experimental Protocol for Biomarker Discovery
- Cohort Selection: Assemble well-characterized sample sets representing distinct clinical outcomes or treatment responses in stem cell-derived populations.
- RNA Sequencing: Process samples in batches with randomized experimental design to minimize batch effects. Include quality control metrics like RIN values.
- Data Normalization: Apply normalization methods (e.g., TPM, FPKM) to account for technical variability between samples.
- Signature Identification: Use machine learning approaches (e.g., random forests, SVM) to identify gene expression patterns predictive of clinical endpoints.
- Validation: Confirm potential biomarkers in independent cohorts using orthogonal methods (e.g., qRT-PCR, nanostring).
Key Experimental Evidence
- A framework for evaluating RNA-seq cohort consistency demonstrated that expression quantile stability improves with sample size, reaching <5% relative error in cohorts with >40-60 samples [25]. This highlights bulk RNA-seq's reliability for biomarker profiling in adequately powered studies.
- The Alzheimer's study not only identified differentially expressed genes but also performed druggability analysis, revealing that the FDA-approved drug Levothyroxine might effectively target the Transthyretin protein encoded by the TTR gene [24]. This showcases how bulk RNA-seq can bridge biomarker discovery to therapeutic repurposing.
Table 2: Bulk RNA-seq Biomarker Discovery Applications in Disease Research
| Disease Area | Biomarker Utility | Technical Approach | Validation Method |
|---|---|---|---|
| Alzheimer's Disease [24] | Diagnostic biomarker TTR | Meta-analysis of multiple bulk RNA-seq datasets | Molecular docking and dynamics simulation |
| Cancer Classification [3] | Prognostic gene signatures | Homogeneous expression gene selection | Independent cohort validation |
| Cardiovascular Disease [10] | Cell-type specific markers | Integrated bulk and single-cell analysis | xCell, EPIC, MCP-counter algorithms |
Ideal Application 3: Large Cohort Profiling and Transcriptome Mapping
For studies requiring extensive sample numbers, such as population-level investigations or biobank projects, bulk RNA-seq provides the scalability necessary for robust transcriptomic characterization while maintaining cost feasibility.
Experimental Protocol for Large Cohort Studies
- Sample Collection: Standardize collection protocols across multiple sites to minimize technical variability.
- Batch Design: Implement balanced batch designs and include control samples to monitor technical artifacts.
- Quality Control: Establish rigorous QC thresholds for RNA quality, sequencing depth, and mapping statistics.
- Data Integration: Use batch correction algorithms (e.g., ComBat-seq) when combining datasets from different sources [24].
- Resource Generation: Create reference transcriptome profiles for stem cell states or differentiation intermediates.
Key Experimental Evidence
- The Nanopore long-read RNA sequencing benchmark study demonstrated that bulk RNA-seq protocols consistently generate robust gene expression estimates across different platforms, with direct RNA and cDNA protocols showing the lowest estimation error for spike-in controls [26]. This technical reliability is essential for large-scale studies.
- A multi-metric approach for evaluating RNA-seq cohort consistency developed objective criteria for selecting homogeneous cohorts, enabling accurate biomarker ranking and sample classification in clinical research [25].
The Scientist's Toolkit: Essential Research Reagents and Solutions
Table 3: Key Research Reagent Solutions for Bulk RNA-seq Experiments
| Reagent/Solution | Function | Application Notes |
|---|---|---|
| Poly(A) Selection Beads | Enriches for polyadenylated mRNA | Reduces ribosomal RNA background; ideal for coding transcriptome |
| Ribosomal Depletion Kits | Removes ribosomal RNA | Preserves non-polyadenylated transcripts; better for lncRNAs |
| RNA Stabilization Reagents | Preserves RNA integrity | Critical for clinical samples with delayed processing |
| Strand-Specific Library Kits | Maintains transcript orientation | Allows determination of transcription direction |
| External RNA Controls | Spike-in RNAs (ERCC, SIRV) | Normalization and technical quality assessment [26] |
| UMI Adapters | Unique Molecular Identifiers | Corrects for PCR amplification biases |
Objective Comparison with scRNA-seq for Heterogeneity Research
While bulk RNA-seq provides numerous advantages, its limitations in resolving cellular heterogeneity must be acknowledged when studying complex stem cell populations:
Resolution Limitation: Bulk RNA-seq averages expression across all cells in a sample, potentially masking rare cell populations or continuous transitions between stem cell states [1] [3]. In contrast, scRNA-seq can identify novel subpopulations and transient states, as demonstrated in cancer studies where rare stem-like cells with treatment-resistant properties were discovered [3].
Complementary Approaches: The most powerful studies often integrate both technologies. For example, research on dilated cardiomyopathy first used scRNA-seq to identify novel macrophage subpopulations (M2-like1 and M2-like2), then validated their abundance changes in disease using bulk RNA-seq deconvolution approaches [10].
Figure 2: Decision framework for selecting RNA-seq approaches in stem cell heterogeneity research.
Bulk RNA-seq remains a powerful, cost-effective technology ideally suited for differential expression analysis, biomarker discovery, and large cohort profiling in stem cell research. Its technical advantages in sensitivity, cost efficiency, and analytical simplicity make it particularly valuable for studies requiring robust population-level comparisons. However, researchers investigating complex cellular heterogeneity within stem cell populations should consider either supplementing bulk approaches with scRNA-seq or utilizing computational deconvolution methods to resolve cell-type specific expression patterns. The optimal approach depends on specific research questions, with integrated strategies often providing the most comprehensive insights into stem cell biology and therapeutic applications.
Stem cells are fundamentally heterogeneous, characterized by variation between individual cells even within the same population [27]. This cellular diversity is a basic characteristic of stem cells, but traditional bulk RNA sequencing methods average gene expression across thousands of cells, effectively masking critical differences between rare subpopulations and distinct cellular states [27] [18]. The emergence of single-cell RNA sequencing (scRNA-seq) has revolutionized our ability to dissect this complexity, providing unprecedented resolution to identify novel stem cell subtypes, trace developmental trajectories, and uncover rare but functionally critical populations that drive regeneration, disease, and therapeutic responses [27] [28]. This comparison guide objectively examines the technical and practical considerations when choosing between scRNA-seq and bulk RNA-seq for stem cell heterogeneity research, providing researchers with the experimental framework needed to unmask the rare and elusive cellular populations that have previously remained hidden.
Technical Comparison: scRNA-seq vs. Bulk RNA-seq
Table 1: Key Technical Differences Between Bulk and Single-Cell RNA Sequencing
| Feature | Bulk RNA Sequencing | Single-Cell RNA Sequencing |
|---|---|---|
| Resolution | Population average [18] [2] | Individual cell level [18] [2] |
| Cost per Sample | Lower (~1/10th of scRNA-seq) [2] | Higher [2] |
| Cell Heterogeneity Detection | Limited [2] | High [2] |
| Rare Cell Type Detection | Limited; masked by abundant populations [2] | Possible; identifies rare subtypes [18] [2] |
| Gene Detection Sensitivity | Higher; detects more genes per sample [2] | Lower per cell, but provides cell-specific data [2] |
| Sample Input Requirement | Higher [2] | Lower; can work with minimal material [2] |
| Data Complexity | Lower; simpler processing [2] | Higher; requires specialized computational methods [2] |
| Ideal Application | Homogeneous samples, differential expression in bulk [2] | Complex tissues, cellular heterogeneity, developmental trajectories [2] |
Table 2: scRNA-seq Methodologies for Stem Cell Research
| Method Category | Examples | Key Characteristics | Best for Stem Cell Applications |
|---|---|---|---|
| Full-Length Transcript | SMART-seq2 [27] [28], SMART-seq [28] | High sensitivity, detects more genes per cell, identifies splicing variants [27] [28] | Deep characterization of pluripotency networks, isoform usage in differentiation [27] |
| 3'/5'-End (Tag-Based) | 10X Genomics [3] [28], Drop-seq [27] [28], CEL-seq2 [28] | High-throughput, incorporates UMIs for accurate quantification, cost-effective for large cell numbers [28] | Large-scale heterogeneity studies, rare population discovery in complex organoids [3] |
| Integrated Functional | Patch-seq [27] | Combines scRNA-seq with patch-clamp electrophysiology and morphology [27] | Linking electrophysiology, morphology, and transcriptomics in neuronal stem cell derivatives [27] |
Experimental Evidence: Case Studies in Stem Cell Research
Identifying Rare Pluripotent States in Embryonic Stem Cells
In mouse embryonic stem cell (mESC) studies, bulk RNA sequencing provides an average transcriptome that assumes relative homogeneity. However, when scRNA-seq was applied to the same mESC populations, researchers identified a rare subpopulation of just 3 cells that highly expressed Zscan4 genes [2]. This previously masked population exhibited greater differentiation potential than the majority of ESCs, representing a rare but functionally critical state in pluripotency maintenance and cell fate decisions [2]. This discovery was only possible through single-cell approaches, as the signal from these rare cells was diluted beyond detection in bulk measurements.
Decoding Early Embryonic Development
The precise timing of initial cell fate decisions during embryonic development has been extensively debated. scRNA-seq of individual blastomeres in mouse 2- and 4-cell embryos revealed that gene expression differences between cells begin as early as the 2-cell stage [27]. These differential expression patterns in the earliest divisions were found to persist into later developmental stages, contributing to the formation of inner cell mass and trophoblast lineages [27]. Such findings demonstrate scRNA-seq's unique capability to trace lineage commitment from the very beginning of development, using extremely limited sample material that would be impossible to study with bulk methods.
Discovering Rare Disease-Associated Cells
In pulmonary research, scRNA-seq identified CFTR-expressing pulmonary ionocytes - a rare cell type occurring at a frequency of approximately 1 in 200 human lung epithelial cells - as potential key mediators of cystic fibrosis pathology [2]. Similarly, in cancer stem cell research, scRNA-seq has revealed rare drug-tolerant persister cells that survive initial treatment and may contribute to relapse [3]. These discoveries highlight scRNA-seq's transformative potential for identifying rare but clinically relevant cellular populations that drive disease mechanisms.
Experimental Design and Workflow Considerations
Sample Preparation and Single-Cell Isolation
The initial steps of single-cell preparation are critical for successful scRNA-seq experiments. Tissue dissociation must be optimized to maintain cell viability while avoiding stress responses that alter transcriptional profiles [28]. For stem cell cultures and organoids, enzymatic digestion with collagenase or trypsin-EDTA is commonly employed, followed by washing and resuspension in appropriate buffers.
Multiple approaches exist for single-cell isolation:
- Microfluidics (10X Genomics, Fluidigm C1): Most popular for high-throughput applications; uses nanoliter droplets containing single cells and barcoded beads [28]
- Fluorescence-Activated Cell Sorting (FACS): Enables selection of specific pre-defined populations using cell surface markers
- Manual cell picking: Lowest throughput but maximum control for rare precious samples
- Laser-capture microdissection: Preserves spatial information that is lost in dissociation-based methods
Recommended scRNA-seq Workflow for Stem Cell Research
The following diagram illustrates a comprehensive experimental and computational workflow for scRNA-seq studies focused on identifying rare stem cell subpopulations:
Computational Analysis Pipeline
The analysis of scRNA-seq data requires specialized bioinformatics approaches distinct from bulk RNA-seq:
Quality Control and Preprocessing: Filtering low-quality cells, removing doublets, and correcting for ambient RNA contamination using tools like DoubletFinder and DecontX [29]. Cells with high mitochondrial gene percentage or low detected genes are typically excluded.
Normalization and Integration: Addressing technical variation between batches using methods like SCTransform (Seurat) or Harmony [29]. This step is crucial when comparing stem cell samples across different differentiation time courses or experimental conditions.
Dimensionality Reduction and Clustering: Principal Component Analysis (PCA) followed by graph-based clustering in reduced dimensions (UMAP/t-SNE) to identify distinct cell populations [29]. Stem cell subpopulations often form continuum states rather than discrete clusters.
Rare Population Identification: Subclustering approaches focused on specific lineages can reveal rare subtypes. Differential expression analysis between clusters identifies marker genes.
Trajectory Inference: Tools like Monocle or PAGA reconstruct developmental paths from stem cells to differentiated progeny, ordering cells along pseudotemporal axes [18].
The Scientist's Toolkit: Essential Research Reagents and Solutions
Table 3: Key Research Reagent Solutions for scRNA-seq in Stem Cell Research
| Reagent/Category | Function | Example Products/Technologies |
|---|---|---|
| Cell Dissociation Reagents | Gentle dissociation of stem cell clusters into single-cell suspensions | Collagenase IV, Trypsin-EDTA, Accutase, Enzyme-free dissociation buffers |
| Viability Stains | Distinguish live/dead cells during quality control | Propidium Iodide, 7-AAD, DAPI, Fluorescent viability dyes |
| Single-Cell Partitioning | Isolate individual cells with barcoded reagents | 10X Genomics Chromium, BD Rhapsody, Drop-seq, inDrop |
| Reverse Transcription & Amplification | Convert minimal RNA to sequencing-ready cDNA | SMARTer Ultra Low RNA Kit, SuperScript II reverse transcriptase [30] |
| Library Preparation | Prepare barcoded libraries for high-throughput sequencing | Nextera XT, Illumina library prep kits, Platform-specific reagents |
| Cell Surface Marker Panels | Pre-sort specific populations before scRNA-seq | Antibody panels for stem cell markers (CD34, CD133, EpCAM) |
| Bioinformatics Tools | Process, analyze, and interpret scRNA-seq data | Seurat, Scanpy, Cell Ranger, Monocle, SCENIC [29] |
Decision Framework: Choosing the Right Approach for Your Research Questions
The following decision tree provides a systematic approach for researchers selecting between bulk and single-cell RNA sequencing methods:
While scRNA-seq provides unparalleled resolution for identifying novel stem cell subpopulations and states, bulk RNA-seq remains valuable for hypothesis generation and validation across larger sample cohorts [31]. The most powerful approach often combines both methodologies: using bulk sequencing to identify global expression patterns and pathways of interest, then applying scRNA-seq to pinpoint which specific cells drive those changes [31] [32]. As single-cell technologies continue to evolve, decreasing costs and increasing throughput will further enable researchers to unmask the rare and elusive cellular populations that hold the keys to understanding stem cell biology, regenerative medicine, and therapeutic development.
Stem cell populations are fundamentally heterogeneous, containing mixtures of cells in different states of pluripotency, differentiation, and metabolic activity. Traditional bulk RNA sequencing methods average gene expression across thousands of cells, obscuring critical cellular subtypes and transitional states that drive lineage commitment. The emergence of single-cell RNA sequencing (scRNA-seq) has revolutionized stem cell research by enabling researchers to investigate this cellular heterogeneity at unprecedented resolution. Pseudotime and trajectory analysis computational tools transform static scRNA-seq snapshots into dynamic models of cellular differentiation, allowing scientists to reconstruct the continuum of stem cell fate decisions, identify key branching points in developmental pathways, and discover novel regulatory mechanisms. This guide compares how scRNA-seq and bulk RNA-seq approach the critical task of understanding stem cell heterogeneity, with particular focus on methodology, applications, and limitations for reconstructing lineage relationships.
Fundamental Technology Comparison: Bulk vs. Single-Cell RNA Sequencing
Bulk RNA sequencing and single-cell RNA sequencing employ fundamentally different approaches to transcriptome analysis, each with distinct implications for studying stem cell heterogeneity.
Bulk RNA-seq analyzes the average gene expression from a population of thousands to millions of cells [1] [4]. In this approach, RNA is extracted from entire tissue samples or cell populations, processed into sequencing libraries, and sequenced to provide a population-level transcriptome profile. While cost-effective and technically straightforward, this method inherently masks cellular heterogeneity by averaging expression signals across all cells in the sample [3] [2]. When applied to heterogeneous stem cell populations, bulk RNA-seq can identify differentially expressed genes between conditions but cannot resolve distinct subpopulations or transitional states.
Single-cell RNA-seq isolates and profiles individual cells, preserving their unique transcriptional identities [1] [4]. Through specialized isolation techniques (such as droplet-based microfluidics in 10X Genomics platforms or well-based methods in Smart-seq2), each cell's transcriptome is barcoded, amplified, and sequenced separately [7] [3]. This enables identification of rare cell types, characterization of continuous transitional states, and reconstruction of developmental trajectories through computational methods like pseudotime analysis [33].
Table 1: Technical Comparison of Bulk RNA-seq vs. Single-Cell RNA-seq
| Feature | Bulk RNA-seq | Single-Cell RNA-seq |
|---|---|---|
| Resolution | Population average [1] | Individual cell level [1] |
| Heterogeneity Detection | Limited; masks cellular diversity [3] | High; reveals subpopulations and rare cells [3] |
| Cost per Sample | Lower (~1/10th of scRNA-seq) [2] | Higher [2] |
| Data Complexity | Lower; standard bioinformatics pipelines [4] | Higher; specialized computational methods needed [4] |
| Gene Detection Sensitivity | Higher genes detected per sample [2] | Lower due to dropout events [2] |
| Ideal Applications | Differential expression between conditions, biomarker discovery [1] | Cell type identification, developmental trajectories, heterogeneity mapping [1] |
Workflow comparison between bulk and single-cell RNA sequencing approaches.
Pseudotime Analysis: From Static Snapshots to Dynamic Processes
Conceptual Foundation of Pseudotime
Pseudotime analysis is a computational approach that orders individual cells along an inferred trajectory representing a continuous biological process such as differentiation, activation, or cell cycle progression [34]. Unlike actual chronological time, pseudotime represents the relative progression of each cell through a biological transition, with cells positioned based on transcriptomic similarity rather than physical timepoints [34]. This approach enables researchers to reconstruct developmental pathways from snapshot scRNA-seq data, revealing the sequence of molecular events that drive cell fate decisions.
The methodology involves several key steps: (1) dimensionality reduction to project cells into a lower-dimensional space; (2) construction of a trajectory graph (often a minimum spanning tree or principal curve) that connects cell states through the continuum; and (3) projection of cells onto this graph to assign pseudotime values [34]. Cells with smaller pseudotime values are considered "earlier" in the process, while those with larger values are "later," enabling the study of dynamic gene expression patterns along the trajectory [34].
Key Computational Methods for Trajectory Inference
Multiple computational algorithms have been developed for pseudotime analysis, each with distinct strengths and methodological approaches:
TSCAN uses a cluster-based minimum spanning tree (MST) approach, first grouping cells into clusters, computing cluster centroids, then constructing the most parsimonious tree connecting these centroids [34]. Cells are projected onto the closest edge of the MST, and pseudotime is calculated as the distance along the tree from a user-defined root node [34]. This approach offers computational efficiency and robustness to noise but depends heavily on clustering granularity.
Monocle, the tool that originally introduced the pseudotime concept, employs reversed graph embedding to learn the structure of the data and order cells along a trajectory [35]. It can identify branching points and genes that define cell fate decisions, making it particularly valuable for studying differentiation pathways in stem cell biology [35].
Slingshot implements a principal curves approach, effectively fitting a smooth, non-linear curve through the cloud of cells in the reduced-dimensional space [34]. This method is especially useful for modeling complex branching processes and does not rely on pre-clustering of cells.
Lamian addresses the critical challenge of multi-sample pseudotime analysis by incorporating statistical frameworks that account for sample-to-sample variability [36]. This enables rigorous comparison of trajectories across different experimental conditions while controlling for false discoveries that may arise from biological and technical variations between samples [36].
Table 2: Comparison of Pseudotime Analysis Algorithms
| Algorithm | Core Methodology | Strengths | Limitations |
|---|---|---|---|
| TSCAN [34] | Cluster-based minimum spanning tree | Computationally efficient; robust to noise | Dependent on clustering granularity |
| Monocle [35] | Reversed graph embedding | Identifies branching points and fate genes | Complex parameter tuning |
| Slingshot [34] | Principal curves | Models complex branching; clustering-independent | May overfit with sparse data |
| Lamian [36] | Multi-sample functional mixed models | Accounts for cross-sample variability; reduces false discoveries | Increased computational complexity |
Generalized workflow for pseudotime analysis with major computational methods.
Experimental Evidence: Case Studies in Stem Cell Research
Resolving Pluripotency Transitions with scRNA-seq
A compelling demonstration of pseudotime analysis comes from a 2025 study comparing human embryonic stem cells (ESCs) and feeder-free extended pluripotent stem cells (ffEPSCs) using Smart-seq2-based scRNA-seq [7]. Researchers performed high-resolution sequencing on both cell types, followed by dimensionality reduction and clustering analysis. Pseudotime analysis successfully mapped the transition process from primed pluripotency (ESCs) to an extended pluripotent state (ffEPSCs), revealing critical molecular pathways involved in this fundamental state transition [7].
The analysis identified distinct subpopulations within both ESC and ffEPSC populations that were indistinguishable by bulk RNA-seq. Trajectory reconstruction revealed a continuous progression between states rather than a binary switch, with cells positioned along the pseudotime axis according to their expression of pluripotency factors and early developmental markers [7]. This application exemplifies how scRNA-seq can uncover the continuum of cellular states within supposedly homogeneous stem cell populations and identify molecular drivers of pluripotency transitions.
Deconvoluting Cardiomyopathy Heterogeneity Through Integrated Analysis
A comprehensive 2024 study on dilated cardiomyopathy (DCM) illustrates the power of integrating both scRNA-seq and bulk RNA-seq approaches [10]. Researchers constructed a single-cell transcriptional atlas from 7 DCM and 3 normal heart tissue samples, totaling 70,958 individual cells. They identified 9 distinct cell subtypes, including fibroblasts, endothelial cells, myeloid cells, and cardiomyocytes [10].
Pseudotime analysis revealed dynamic transitions in fibroblast subpopulations, with proliferative F3 cells implicated in the early fibroblast transition process in DCM, while myofibroblast F6 cells promoted transition to a late pathological state [10]. Additionally, the study identified two novel M2 macrophage subpopulations (M2-like1 and M2-like2) with distinct functional properties, where M2-like2 cells were enriched in glycolysis and fatty acid metabolism pathways and promoted fibrosis [10].
The researchers then applied computational deconvolution methods (xCell, EPIC, MCP-counter, and CIBERSORT) to bulk RNA-seq datasets, using their scRNA-seq findings as a reference. This integration confirmed a significant increase in M2-like2 subpopulations in DCM samples, validating the biological relevance of these scRNA-seq-defined subpopulations in a larger cohort [10]. This study demonstrates a powerful framework where scRNA-seq discovers novel cell states and trajectories, while bulk RNA-seq validates these findings across larger sample sizes.
Experimental Protocols for Stem Cell Trajectory Analysis
Sample Preparation and Sequencing
Stem Cell Culture and Preparation: Maintain human ESCs (e.g., H9 line) on Matrigel-coated plates in mTeSR1 medium [7]. For transition studies, dissociate single cells using Accutase and transfer to transition media (e.g., LCDM-IY for ffEPSC transition) [7]. Critical parameters include cell viability (>90%), single-cell suspension quality, and minimization of stress responses during dissociation.
Single-Cell Library Preparation: Use either droplet-based (10X Genomics Chromium) or full-length transcript (Smart-seq2) protocols depending on research goals [7] [3]. For 10X Genomics, load viable single-cell suspensions onto microfluidic chips to generate Gel Beads-in-emulsion (GEMs) where cell lysis, barcoding, and reverse transcription occur [3]. For Smart-seq2, manually pick individual cells into lysis buffer, followed by oligo-dT primed reverse transcription and PCR pre-amplification [7].
Sequencing and Alignment: Sequence libraries on appropriate Illumina platforms (NovaSeq for large-scale studies, HiSeq for deeper coverage). Align sequences to reference genomes (GRCh38) using HISAT2 or STAR aligners, then quantify transcript counts using featureCounts or similar tools [7].
Computational Analysis Pipeline
Data Preprocessing: Filter low-quality cells based on mitochondrial percentage, unique gene counts, and total UMIs. Normalize using count depth scaling to 10,000 counts per cell (CP10K) followed by log transformation: ln(CP10K + 1) [7]. Identify highly variable genes (4,000-5,000 genes) for downstream analysis.
Dimensionality Reduction and Clustering: Perform principal component analysis (PCA) on variable genes, then use the top principal components for graph-based clustering [7]. Visualize using UMAP or t-SNE. Calculate silhouette scores to evaluate clustering quality [7].
Trajectory Analysis: Select appropriate algorithm (Monocle, TSCAN, or Slingshot) based on expected trajectory complexity. For TSCAN, construct minimum spanning tree on cluster centroids in reduced dimension space, then project cells to nearest edge [34]. For multi-sample studies, use Lamian to account for cross-sample variability and test for differential topology, cell density, and gene expression patterns [36].
Differential Expression and Pathway Analysis: Identify genes varying along pseudotime using functional mixed effects models [36]. Perform gene set enrichment analysis (GSEA) using packages like fgsea to identify pathways associated with trajectory progression [7].
Essential Research Reagents and Computational Tools
Table 3: Essential Research Reagents and Tools for Stem Cell scRNA-seq
| Category | Specific Products/Tools | Application Purpose |
|---|---|---|
| Stem Cell Culture | mTeSR1 medium, Matrigel, Accutase, Y-27632 (ROCK inhibitor) | Maintain pluripotency and viability during passaging |
| Single-Cell Platforms | 10X Genomics Chromium, Smart-seq2 protocols | Partition individual cells and barcode transcripts |
| Sequencing Reagents | Illumina sequencing kits, Kapa HyperPrep Kit | Generate sequencing-ready libraries |
| Alignment Tools | HISAT2, STAR, SAMtools, featureCounts | Process raw sequences into gene expression matrices |
| Quality Control | FastQC, Seurat QC metrics, DoubletFinder | Assess data quality and remove technical artifacts |
| Normalization | SCTransform, LogNormalize | Remove technical variations between cells |
| Dimensionality Reduction | PCA, UMAP, t-SNE | Visualize and identify patterns in high-dimensional data |
| Trajectory Inference | Monocle, TSCAN, Slingshot, Lamian | Reconstruct developmental trajectories and pseudotime |
| Differential Expression | Seurat FindMarkers, Monocle BEAM, tradeSeq | Identify genes associated with specific trajectories |
The reconstruction of lineage and fate decisions in stem cell biology has been fundamentally transformed by single-cell RNA sequencing and pseudotime analysis. While bulk RNA-seq remains valuable for large-scale differential expression studies and biomarker discovery, scRNA-seq provides unprecedented resolution for mapping cellular heterogeneity, identifying rare transitional states, and reconstructing developmental trajectories. The strategic integration of both approaches—using scRNA-seq to discover novel cell states and trajectories, then validating these findings in larger cohorts through bulk RNA-seq with computational deconvolution—represents a powerful framework for advancing stem cell research. As computational methods continue to evolve, particularly for multi-sample trajectory analysis and integration of additional omics modalities, researchers will gain increasingly sophisticated tools to decode the complex regulatory programs governing stem cell fate decisions.
Stem cell populations are fundamentally heterogeneous, containing diverse cell types and states at varying degrees of differentiation and functionality. Traditional bulk RNA sequencing methods, which analyze the average gene expression across thousands of cells, inevitably mask this critical cellular diversity [13]. For researchers investigating developmental biology, regenerative medicine, and cellular reprogramming, this limitation represents a significant barrier to understanding the complex dynamics of stem cell populations. The emergence of single-cell RNA sequencing (scRNA-seq) has revolutionized this field by enabling the precise characterization of gene expression at the individual cell level, revealing previously inaccessible subpopulations and rare cell types that drive biological processes [1] [3].
This case study examines a pivotal experiment where scRNA-seq successfully identified a rare subpopulation of mouse embryonic stem cells (mESCs) characterized by high expression of Zscan4 genes—a population that had been undetectable using conventional bulk RNA-seq approaches [2]. We will analyze the comparative performance of scRNA-seq versus bulk RNA-seq in detecting cellular heterogeneity, provide detailed experimental protocols, and quantify the technological advantages that make such discoveries possible.
Technical Comparison: scRNA-seq vs. Bulk RNA-seq
Fundamental Technological Differences
The core distinction between these sequencing approaches lies in their resolution and sample processing. Bulk RNA-seq analyzes the collective RNA from a population of cells, producing an averaged gene expression profile that represents the entire sample [1] [2]. In contrast, scRNA-seq isolates individual cells before RNA capture and sequencing, enabling the reconstruction of distinct transcriptional profiles for each cell [1] [3]. This fundamental difference in sample processing creates dramatic variations in the types of biological information each method can capture.
Workflow Comparison:
Performance Metrics and Quantitative Comparison
The following table summarizes the critical performance differences between the two technologies, illustrating why scRNA-seq is uniquely suited for detecting rare cell populations:
Table 1: Technical comparison between bulk RNA-seq and single-cell RNA-seq
| Feature | Bulk RNA-seq | Single-Cell RNA-seq | Experimental Evidence |
|---|---|---|---|
| Resolution | Population average | Individual cell level | scRNA-seq identified rare Zscan4+ mESCs (3 cells in cluster) that were masked in bulk data [2] |
| Rare Cell Detection | Limited | High sensitivity | Detected CFTR-expressing pulmonary ionocytes (1/200 cells) and rare CAR T cells (~1/10,000 cells) [2] |
| Cost per Sample | Lower (~$300) | Higher ($500-$2000) | Significant cost differential impacts experimental design choices [2] |
| Gene Detection Sensitivity | Higher genes per sample | Lower genes per cell | Bulk detects ~13,378 genes/sample vs. scRNA-seq ~3,361 genes/cell in PBMCs [2] |
| Data Complexity | Lower, established pipelines | Higher, requires specialized tools | scRNA-seq data is sparse, noisy, high-dimensional requiring advanced computational methods [2] [13] |
| Cell Heterogeneity Detection | Limited | Comprehensive | Revealed intratumoral heterogeneity in glioblastoma invisible to bulk sequencing [2] |
| Experimental Workflow | Simpler sample prep | Complex single-cell suspension | scRNA-seq requires viable single cells, precise partitioning [1] |
Case Study Analysis: Discovery of Zscan4-Expressing mESCs
Experimental Design and Methodology
The groundbreaking experiment that identified the rare Zscan4-expressing subpopulation employed a sophisticated scRNA-seq approach with the following key methodological components:
Cell Preparation and Quality Control:
- mESCs were cultured under standard conditions and dissociated into single-cell suspensions
- Cell viability exceeding 80% was confirmed using automated cell counters and fluorescence-based viability staining
- Cells were adjusted to optimal concentration (700-1,200 cells/μL) for single-cell partitioning [1]
Single-Cell Partitioning and Library Preparation:
- Single cells were partitioned into nanoliter-scale Gel Beads-in-emulsion (GEMs) using a microfluidics system (10X Genomics Chromium platform)
- Each GEM contained a single cell, a gel bead with barcoded oligonucleotides, and reverse transcription reagents
- Cell-specific barcodes (10X barcodes) and unique molecular identifiers (UMIs) were incorporated during reverse transcription to label transcripts from individual cells [3]
- Barcoded cDNA was amplified and converted to sequencing libraries compatible with Illumina platforms
Sequencing and Data Analysis:
- Libraries were sequenced to sufficient depth (typically 50,000 reads/cell) to capture transcriptional diversity
- Raw sequencing data was processed using Cell Ranger pipeline to generate gene expression matrices
- Downstream analysis included dimensionality reduction (PCA, t-SNE, UMAP), clustering, and differential gene expression analysis [13]
- The Zscan4-high subpopulation was identified through unsupervised clustering and marker gene expression analysis
Key Findings and Biological Significance
The scRNA-seq analysis revealed a small cluster of just three cells that exhibited exceptionally high expression of Zscan4 genes—a transcriptional signature that was completely undetectable in matched bulk RNA-seq data from the same cell population [2]. This finding was biologically significant because Zscan4 activation is associated with:
- Maintenance of telomere length and genomic stability in embryonic stem cells
- Enhanced differentiation potential and developmental plasticity
- A transient cellular state that may regulate stem cell potency
The discovery demonstrated that apparently homogeneous mESC cultures contain functionally distinct subpopulations with specialized roles, challenging previous understanding based on bulk sequencing data alone.
Experimental Protocols for scRNA-seq
Detailed Step-by-Step Workflow
Sample Preparation Protocol:
- Tissue Dissociation: Use enzymatic (e.g., collagenase, trypsin) or mechanical dissociation appropriate for the specific tissue type to generate single-cell suspension [1]
- Cell Quality Control: Assess viability using trypan blue or fluorescence-based methods (≥80% viability recommended), remove dead cells and debris using density gradient centrifugation or dead cell removal kits
- Cell Counting: Precisely quantify cell concentration using automated counters or hemocytometers, adjusting to 700-1,200 cells/μL for 10X Chromium system
Single-Cell Partitioning and Barcoding (10X Genomics Platform):
- GEM Generation: Load single-cell suspension, gel beads, and partitioning oil into Chromium chip, generating up to 80,000 GEMs per channel [3]
- Cell Lysis and Barcoding: Within each GEM, cells are lysed, releasing RNA that binds to poly-dT primers on gel beads; each primer contains a cell barcode, UMI, and poly-dT sequence
- Reverse Transcription: Perform reverse transcription within GEMs to produce barcoded cDNA, maintaining cell-of-origin information
Library Preparation and Sequencing:
- cDNA Amplification: Break emulsions, purify barcoded cDNA, and amplify via PCR
- Library Construction: Fragment cDNA, add sequencing adapters, and index samples
- Quality Control: Assess library quality using Bioanalyzer or TapeStation, quantify by qPCR
- Sequencing: Load libraries onto Illumina sequencers (NovaSeq, HiSeq, or NextSeq), aiming for 50,000 reads/cell as a standard depth
Critical Reagents and Equipment
Table 2: Essential research reagents and solutions for scRNA-seq experiments
| Category | Specific Product/Kit | Function | Critical Features |
|---|---|---|---|
| Dissociation | Collagenase IV, Trypsin-EDTA, Accumax | Tissue dissociation into single cells | Tissue-specific optimization required to maintain viability [1] |
| Viability Assessment | Trypan blue, Propidium iodide, Calcein AM | Distinguish live/dead cells | Fluorescence methods more accurate for delicate cells [1] |
| Platform-Specific Kits | 10X Genomics Chromium Next GEM Single Cell 3' or 5' Kits | Single-cell partitioning and barcoding | Determine 3' or 5' bias based on research question [1] [3] |
| Beads | Dynabeads MyOne SILANE | cDNA purification | Efficient recovery of barcoded cDNA [3] |
| Amplification | KAPA HiFi HotStart ReadyMix | cDNA amplification | High-fidelity polymerase minimizes errors [3] |
| Library Prep | Illumina Nextera XT DNA Library Preparation Kit | Sequencing library construction | Compatible with Illumina sequencing platforms [3] |
| Quality Control | Agilent High Sensitivity DNA Kit, Qubit dsDNA HS Assay | Quantify cDNA and libraries | Accurate quantification essential for optimal sequencing [13] |
Data Analysis Workflow
The analytical pipeline for scRNA-seq data involves multiple specialized steps to transform raw sequencing data into biological insights:
Primary Analysis:
- Demultiplexing BCL files to FASTQ format using bcl2fastq
- Alignment to reference genome (STAR, Cell Ranger align)
- Gene counting and UMI deduplication to generate expression matrices [13]
Quality Control and Filtering:
- Remove low-quality cells based on UMI counts, gene detection, and mitochondrial percentage
- Filter out doublets and multiplets using computational tools (DoubletFinder, Scrublet)
- Normalize data using methods accounting for sequencing depth variation (SCTransform, Seurat normalization) [13]
Dimensionality Reduction and Clustering:
- Identify highly variable genes driving heterogeneity
- Perform principal component analysis (PCA) to reduce dimensionality
- Apply graph-based clustering (Leiden, Louvain) to identify cell subpopulations
- Visualize using UMAP or t-SNE for intuitive representation [13]
Differential Expression and Pathway Analysis:
- Identify marker genes for each cluster using Wilcoxon rank-sum tests
- Perform functional enrichment analysis (GO, KEGG) on marker gene sets
- Conduct trajectory inference to reconstruct developmental pathways (Monocle, PAGA) [13]
Comparative Performance in Stem Cell Research
Quantitative Assessment of scRNA-seq Advantages
The superior performance of scRNA-seq in detecting rare stem cell populations can be quantified across multiple dimensions:
Table 3: Performance comparison for rare cell population detection
| Performance Metric | Bulk RNA-seq | scRNA-seq | Impact on Stem Cell Research |
|---|---|---|---|
| Detection Limit for Rare Cells | Masks populations <5% | Identifies populations <0.01% | Enabled discovery of Zscan4+ mESCs (~0.1% frequency) [2] |
| Heterogeneity Resolution | Limited to major differences | Resolves subtle transcriptional states | Reveals continuum of differentiation states in stem cell lineages |
| Lineage Tracing Capability | Indirect inference | Direct reconstruction via pseudotime | Maps developmental trajectories from pluripotent to differentiated states |
| Cell Type Identification | Requires physical separation | Unbiased classification from data | Identifies novel stem cell subtypes without prior knowledge |
| Technical Noise | Lower | Higher (dropout events) | Requires specialized statistical methods for accurate analysis [2] |
Integrated Approaches and Future Directions
While scRNA-seq provides unparalleled resolution for cellular heterogeneity, bulk RNA-seq remains valuable for large-scale studies, biomarker discovery, and validating findings across sample cohorts [2] [21]. The most powerful contemporary approaches integrate both technologies:
- Reference-Based Deconvolution: Using scRNA-seq data as a reference to infer cell type proportions from bulk data (CIBERSORT, EPIC algorithms) [10]
- Cross-Validation: Confirming scRNA-seq discoveries with bulk analysis in larger sample sets
- Multi-Omic Integration: Combining scRNA-seq with epigenetic and proteomic data for comprehensive profiling
Emerging methodologies like spatial transcriptomics are now bridging the gap between single-cell resolution and tissue context, representing the next frontier in stem cell research [3].
The case study of Zscan4-expressing mESC discovery exemplifies the transformative power of scRNA-seq for stem cell research. While bulk RNA-seq remains a valuable tool for population-level studies and large-scale screening, scRNA-seq provides an essential technology for unraveling cellular heterogeneity, identifying rare stem cell populations, and reconstructing developmental lineages. The technical advances enabling single-cell partitioning, barcoding, and computational analysis have created new possibilities for understanding stem cell biology at unprecedented resolution, opening new pathways for regenerative medicine and therapeutic development.
As sequencing costs decrease and analytical methods mature, scRNA-seq is positioned to become a standard approach in stem cell research, particularly for investigations of cellular plasticity, heterogeneity, and lineage commitment that were previously intractable with bulk sequencing methodologies.
The transition from bulk RNA sequencing (bulk RNA-seq) to single-cell RNA sequencing (scRNA-seq) represents a paradigm shift in biological research, moving from a population-average view to a high-resolution, single-cell perspective. This evolution is particularly crucial in stem cell research and oncology, where cellular heterogeneity is a fundamental property influencing development, disease progression, and therapeutic response. Bulk RNA-seq provides a population-level average of gene expression, effectively masking the diversity of individual cellular responses and rare but critical cell subpopulations [1] [37]. In contrast, scRNA-seq dissects this complexity by capturing the transcriptomic landscape of each individual cell, enabling researchers to identify novel cell types, trace developmental trajectories, and uncover the cellular origins of drug resistance [37] [6] [3]. This guide provides an objective comparison of these technologies, focusing on their application to stem cell heterogeneity and the subsequent impact on understanding disease mechanisms and drug responses.
Technical Comparison: Bulk RNA-seq vs. Single-Cell RNA-seq
The fundamental difference between these technologies lies in their resolution. While bulk RNA-seq processes a population of cells as a single entity, scRNA-seq isolates and barcodes individual cells, allowing for the deconvolution of heterogeneous samples.
Table 1: Core Technical and Performance Characteristics
| Feature | Bulk RNA-seq | Single-Cell RNA-seq (10x Genomics) |
|---|---|---|
| Resolution | Population average [1] | Single-cell level [1] |
| Key Output | Average gene expression for the entire sample [1] | Gene expression profile for each individual cell [1] |
| Sample Input | Pooled cells from a sample [1] | Viable single-cell suspension [1] |
| Cell Partitioning | Not applicable | Microfluidic GEMs (Gel Beads-in-emulsion) [1] [3] |
| Cell Barcoding | Not applicable | Cell-specific barcodes on gel beads [3] |
| Ideal for Detecting | - Differential gene expression between conditions [1]- Novel transcripts & gene fusions [1] [3]- Biomarker discovery [1] | - Cellular heterogeneity & rare cell types [1] [37]- Developmental trajectories [1] [37]- Cell-specific drug responses [38] [39] |
| Limitations | Masks cellular heterogeneity [1] [37] | Higher cost and more complex data analysis [1] |
Experimental Workflows: From Sample to Data
A clear understanding of the distinct experimental protocols is essential for selecting the appropriate methodology.
Bulk RNA-seq Workflow
In a standard bulk RNA-seq experiment, the biological sample (e.g., a piece of tissue) is processed to extract the total RNA or enriched mRNA. This RNA pool, representing the average transcriptome of thousands to millions of cells, is then converted to cDNA and prepared into a sequencing library. After sequencing, the resulting data provides a single gene expression profile for the entire sample [1].
Single-Cell RNA-seq Workflow
The scRNA-seq workflow involves several critical steps to ensure high-quality data from individual cells:
- Single-Cell Suspension: The sample must be dissociated into a viable suspension of single cells, requiring enzymatic or mechanical digestion. Cell counting and quality control are crucial to ensure high viability and absence of clumps or debris [1] [6].
- Cell Partitioning and Barcoding: In platforms like 10x Genomics Chromium, single cells are partitioned into nanoliter-scale GEMs (Gel Beads-in-emulsion) within a microfluidic chip. Each GEM contains a single cell, a gel bead coated with cell-barcoded oligonucleotides, and reagents for reverse transcription. The cell is lysed within the GEM, and its RNA is captured and tagged with the cell-specific barcode [1] [3].
- Library Preparation and Sequencing: The barcoded cDNA from all cells is pooled, amplified, and prepared into a sequencing library. High-throughput sequencing is followed by computational analysis, where the cell barcodes are used to attribute each sequence read back to its cell of origin, reconstructing thousands of individual transcriptomes [1] [3].
Diagram 1: Core workflow comparison between Bulk and Single-Cell RNA-seq.
Case Studies: Resolving Stem Cell Heterogeneity and Drug Response
Defining Stem Cell Subpopulations with Functional Consequences
Mesenchymal stem/stromal cells (MSCs) are promising for regenerative medicine but exhibit significant functional heterogeneity in vitro. A scRNA-seq study of human primary Wharton’s jelly–derived MSCs (WJMSCs) revealed distinct subpopulations with diverse functional characteristics related to proliferation, development, and inflammation response [6]. Guided by scRNA-seq data, researchers sorted WJMSCs into CD142+ and CD142− subpopulations. Functional experiments confirmed that these subpopulations exhibited distinct proliferation capacity and "wound healing" potential in vitro, directly linking transcriptional heterogeneity to functional differences [6]. This demonstrates scRNA-seq's power to identify and characterize functionally distinct stem cell subtypes that are obscured in bulk analyses.
Predicting Drug Response by Integrating Bulk and Single-Cell Data
A major application of scRNA-seq is predicting and understanding heterogeneous drug responses. The scDEAL framework employs deep transfer learning to predict cancer drug responses at the single-cell level by integrating large-scale bulk cell-line data (e.g., from GDSC and CCLE) [38]. The model harmonizes drug-related bulk RNA-seq data with scRNA-seq data, transferring knowledge of gene expression–drug response relations from the bulk level to predict responses in individual cells [38]. This approach has been benchmarked on multiple scRNA-seq datasets, achieving high accuracy (e.g., an average F1-score of 0.892 and AUROC of 0.898 across six datasets) in predicting whether a cell is sensitive or resistant to a drug [38]. Furthermore, the model can infer signature genes involved in drug resistance mechanisms, providing both predictive and interpretable results.
Table 2: Computational Tools for Drug Response Prediction from RNA-seq Data
| Tool/Method | Primary Approach | Key Features | Applicable Data |
|---|---|---|---|
| scDEAL [38] | Deep Transfer Learning | Transfers drug response knowledge from bulk to single-cell data; infers signature genes. | Bulk & scRNA-seq |
| scDrug [39] | Integrated Bioinformatics Pipeline | One-step scRNA-seq analysis, cluster-specific drug prediction using GDSC/PRISM models. | scRNA-seq |
| ATSDP-NET [40] | Attention-based Transfer Learning | Uses multi-head attention to identify key genes; enhances prediction accuracy and interpretability. | Bulk & scRNA-seq |
| Beyondcell & CaDRReS-Sc [39] | Drug Sensitivity Scoring | Predicts drug sensitivity scores for cell subpopulations based on transcriptomic signatures. | scRNA-seq |
Diagram 2: Knowledge transfer from bulk to single-cell data for drug response prediction.
Successful experimentation, particularly with complex scRNA-seq protocols, relies on a suite of trusted reagents and platforms.
Table 3: Key Research Reagent Solutions for RNA-seq Studies
| Reagent / Solution | Function | Application Notes |
|---|---|---|
| UltraCULTURE Serum-free Medium [6] | For the culture and expansion of sensitive primary cells like MSCs. | Helps maintain undifferentiated state and reduces experimental variability. |
| TrypLE Select [6] | A recombinant enzyme for gentle cell dissociation. | Prevents damage to cell surface proteins and increases post-dissociation viability, critical for scRNA-seq. |
| Chromium Single Cell 3' Reagent Kits [1] [6] | Integrated solutions for single-cell partitioning, barcoding, and library prep. | Provides a robust, instrument-enabled workflow (e.g., on Chromium X series) for consistent results. |
| Demonstrated Protocols (10x Genomics) [1] | Optimized, step-by-step sample preparation methods. | Includes over 40 protocols tailored to different starting materials (tissues, cells, nuclei), maximizing success. |
| GEM-X Technology [1] | Gel Bead-in-emulsion chemistry for single-cell partitioning. | Enhances transcript capture sensitivity and reduces errors in 10x Genomics workflows. |
| Harmony Algorithm [41] [39] | Computational tool for batch effect correction. | Integrates multiple scRNA-seq datasets by removing technical variation, crucial for robust meta-analyses. |
| Seurat R Package [41] [6] | Comprehensive toolbox for scRNA-seq data analysis. | Used for quality control, normalization, clustering, differential expression, and visualization. |
The choice between bulk RNA-seq and single-cell RNA-seq is not a matter of one being universally superior to the other, but rather of selecting the right tool for the biological question at hand. Bulk RNA-seq remains a powerful, cost-effective method for identifying average expression differences between sample groups, discovering biomarkers, and characterizing novel transcripts. However, for investigating the cellular heterogeneity that underpins stem cell biology, tumor resistance, and complex disease mechanisms, scRNA-seq is indispensable. The ability to profile individual cells reveals not just what cell types are present, but also how they interact, transition between states, and differentially respond to therapeutic agents. The ongoing development of integrated computational models, like those employing transfer learning, further bridges the gap between rich bulk-level pharmacogenomic resources and the high-resolution single-cell world, paving the way for more precise and effective therapeutic strategies.
Navigating Technical Challenges: Cost, Complexity, and Experimental Design in Stem Cell Sequencing
For researchers investigating complex systems like stem cell populations, choosing the right RNA sequencing method is crucial. While bulk RNA-seq provides a cost-effective overview of average gene expression, single-cell RNA sequencing (scRNA-seq) is uniquely powerful for resolving cellular heterogeneity, identifying rare stem cell subtypes, and uncovering novel cell states—insights that are completely lost in bulk analysis averages [1] [3] [2]. However, the superior resolution of scRNA-seq comes with higher costs and greater experimental complexity [2].
This guide objectively compares these technologies and provides actionable strategies for designing cost-effective scRNA-seq studies without compromising scientific value.
Bulk vs. Single-Cell RNA-Seq: A Direct Comparison for Heterogeneity Research
The choice between bulk and single-cell RNA-seq hinges on your research goals, and this is particularly true for stem cell research where cellular heterogeneity is a primary focus. The table below summarizes the core differences.
Table 1: Key Differences Between Bulk RNA-seq and Single-Cell RNA-seq
| Feature | Bulk RNA-Seq | Single-Cell RNA-Seq |
|---|---|---|
| Resolution | Average gene expression across a population of cells [1] [2] | Gene expression measured at the level of individual cells [1] [2] |
| Cost (per sample) | Lower (estimated ~1/10th of scRNA-seq) [2] | Higher [2] |
| Detection of Cellular Heterogeneity | Limited; masks differences between cells [3] [2] | High; reveals distinct cell types, states, and rare populations [3] [2] |
| Rare Cell Type Identification | Not possible; signals are diluted by dominant cell types [2] | Possible; can identify rare stem cell subpopulations even at frequencies of 1 in 10,000 cells [2] |
| Ideal Application | Differential gene expression analysis in homogeneous samples, biomarker discovery from tissue averages [1] [3] | Characterizing complex tissues, defining cellular hierarchies, discovering novel and rare cell types (e.g., stem cell subpopulations) [1] [3] [2] |
| Data Complexity | Lower; more straightforward statistical analysis [2] | Higher; requires specialized computational tools for sparse and noisy data [2] |
The fundamental difference lies in resolution. As illustrated below, while bulk RNA-seq provides a composite profile, scRNA-seq deconvolutes this into the distinct expression profiles of individual cells, making it the only suitable choice for directly studying stem cell heterogeneity.
Quantitative Cost and Performance Analysis of scRNA-seq Technologies
A significant portion of scRNA-seq cost is determined by the choice of commercial platform, which varies in throughput, required hardware, and cost-per-cell. The table below compares major platforms based on 2025 data [42].
Table 2: Comparison of Commercial scRNA-seq Platforms (Data sourced from 2025 analysis [42])
| Commercial Solution | Capture Platform | Hardware Needed? | Throughput (Cells/Run) | Capture Efficiency (%) | Fixed Cell Support? |
|---|---|---|---|---|---|
| 10x Genomics Chromium | Microfluidic oil partitioning | Yes | 500–20,000 | 70–95 | Yes [42] |
| BD Rhapsody | Microwell partitioning | Yes | 100–20,000 | 50–80 | Yes [42] |
| Parse Evercode | Multiwell-plate | No | 1,000–1,000,000+ | >90 | Yes [42] |
| Fluent/PIPseq (Illumina) | Vortex-based oil partitioning | No | 1,000–1,000,000+ | >85 | Yes [42] |
Platform selection has a direct impact on budget. High-throughput droplet-based systems (e.g., 10x Genomics GEM-X v4) reduce the cost-per-cell when processing thousands of cells [42]. For projects with limited starting material or those that cannot be processed immediately, fixed cell protocols (e.g., 10x Genomics Gene Expression Flex) are a valuable option, providing flexibility and preventing the loss of precious samples [43].
Key Methodologies and Experimental Protocols for Cost-Efficiency
Pilot Studies and Sample Multiplexing
Running a small-scale pilot study with a limited number of cells is a highly recommended strategy to optimize dissociation protocols and library preparation before committing to a full-scale, expensive experiment [43]. Furthermore, multiplexing samples within a single sequencing run using cell hashing or genetic barcoding can drastically reduce per-sample costs. Some platforms allow up to 16 samples to be processed together [42].
Strategic Cell Capture and Sequencing Depth
Rather than blindly maximizing cell numbers, carefully consider the biological question. For identifying major cell types, 5,000-10,000 cells may be sufficient. Deeper sequencing is required for detecting lowly expressed genes or subtle subpopulations, but for standard cell type classification, a sequencing depth of 20,000-50,000 reads per cell is often adequate [42]. Using Unique Molecular Identifiers (UMIs) during reverse transcription is critical to correct for PCR amplification bias and ensure quantitative accuracy, preventing wasted resources on technically inflated counts [44].
The Scientist's Toolkit: Essential Research Reagent Solutions
The following reagents and materials are fundamental for a successful and efficient scRNA-seq workflow.
Table 3: Essential Reagents and Materials for scRNA-seq Experiments
| Item | Function | Key Considerations |
|---|---|---|
| Viability Stain (e.g., DAPI, Propidium Iodide) | Distinguishes live from dead cells during FACS or counting. | Critical for ensuring high initial cell viability (>80%), which is a major determinant of final data quality [1]. |
| Enzymatic Dissociation Cocktail | Breaks down extracellular matrix to create a single-cell suspension. | Must be optimized for each tissue type; performing digestions on ice can help minimize stress-induced transcriptional artifacts [44] [42]. |
| Single-Cell Barcoding Beads | Source of oligonucleotides with cell barcodes and UMIs. | Platform-specific (e.g., Gel Beads for 10x Genomics). The barcodes assign all reads from a single cell to its cell of origin [3]. |
| Cell Lysis Buffer | Breaks open cells to release RNA for capture. | Must be compatible with the chosen platform and is typically incorporated into the partitioning step in droplet-based methods [3]. |
| Reverse Transcription (RT) Reagents | Converts captured mRNA into stable, barcoded cDNA. | The initial step in preserving the transcriptome information; efficiency here impacts gene detection sensitivity [44]. |
| Library Preparation Kit | Amplifies and adds sequencing adapters to the barcoded cDNA. | Platform-specific. Newer kits (e.g., GEM-X Flex) are designed for higher sensitivity and better utilization of sequencing budgets [1]. |
The interplay of these reagents and key decision points in a cost-optimized workflow can be visualized as follows:
While scRNA-seq presents a higher cost barrier than bulk sequencing, its ability to unravel cellular heterogeneity in stem cell research is unparalleled. By strategically selecting platforms based on project scale, employing cost-saving practices like pilot studies and multiplexing, and carefully planning sequencing depth, researchers can effectively manage budgets. The evolving landscape of commercial solutions continues to drive down costs, making this powerful technology an increasingly feasible option for answering fundamental questions in biology and drug development.
In stem cell research, delineating heterogeneity is paramount for understanding developmental biology, disease modeling, and regenerative medicine. Bulk RNA sequencing (bulk RNA-seq) has traditionally been used to study transcriptomes, but it averages gene expression across all cells in a sample, masking the distinct subpopulations and rare cell states that are hallmarks of stem cell ecosystems [1]. Single-cell RNA sequencing (scRNA-seq) resolves this by profiling gene expression in individual cells, uncovering the cellular diversity within heterogeneous stem cell populations. However, the journey from tissue to transcriptome data is fraught with technical challenges, primarily centered on sample preparation. The choice between whole-cell and single-nucleus approaches (snRNA-seq) can determine the success or failure of a study. This guide objectively compares these methods, providing a detailed examination of experimental protocols, performance data, and strategic solutions to navigate the central hurdles of tissue dissociation and cell viability.
The Core Hurdles in Single-Cell Sample Preparation
Tissue Dissociation and Its Impact on Cell Viability
The fundamental prerequisite for scRNA-seq is the creation of a high-quality single-cell suspension. This process involves breaking down the extracellular matrix and cell-cell adhesions through a combination of enzymatic digestion and mechanical disruption [45] [46]. Achieving this without compromising cell integrity is a delicate balance.
Harsh dissociation conditions—whether prolonged enzymatic exposure or aggressive mechanical force—lead to significant cell death and the induction of technical artifacts, including stress-related gene expression [45]. For instance, studies on Drosophila imaginal discs found that the dissociation process itself could trigger artificial expression of stress genes, confounding biological interpretation [45]. Furthermore, cell type-specific susceptibility means that the very populations of interest, such as fragile stem or progenitor cells, may be lost or underrepresented, skewing the perceived cellular heterogeneity of the sample [46].
The Single-Nucleus Alternative
Single-nucleus RNA sequencing (snRNA-seq) has emerged as a powerful alternative, particularly for samples where whole-cell dissociation is impractical or undesirable [47]. This method involves lysing cells and capturing RNA directly from individual nuclei.
- Advantages for Challenging Samples: snRNA-seq is ideally suited for tissues that are difficult to dissociate (e.g., neuronal, adipose, or fibrous tissues), archived frozen samples where cell membranes are compromised, and large cells that are physically difficult to capture in droplet-based systems [46] [47].
- Reduction of Artifacts: Because it bypasses the need for enzymatic dissociation and cytoplasmic RNA capture, snRNA-seq minimizes the induction of stress-response genes and reduces biases related to cell size and fragility [45] [47].
Table 1: Key Differences Between scRNA-seq and snRNA-seq Sample Preparation
| Feature | scRNA-seq (Whole Cell) | snRNA-seq |
|---|---|---|
| Starting Material | Fresh, viable tissue [46] | Fresh or frozen tissue [48] [47] |
| Major Challenge | Maintaining cell viability during dissociation [45] [49] | Isulating intact nuclei; capturing intronic RNA [48] [47] |
| Dissociation | Enzymatic & mechanical (tissue-specific) [46] | Chemical lysis & mechanical homogenization [48] [47] |
| Risk of Stress Genes | Higher [45] | Lower [45] [47] |
| Ideal for Rare/ Frozen Samples | Limited | Yes [48] |
Experimental Protocols and Performance Data
Optimized Workflows for scRNA-seq
Success in scRNA-seq requires a tailored dissociation strategy for each tissue type. A comprehensive study profiling eight human tumor types established a decision-tree framework for protocol customization [46]. The process begins with mincing the fresh tissue, followed by testing different enzymatic cocktails.
- Enzymatic Mixtures: The choice of enzymes depends on the tissue's extracellular matrix composition. For example, Liberase TM was effective for breaking down collagen in breast cancer samples, while papain was used for glioblastoma [46].
- Quality Control: The performance of different protocols is evaluated not just by cell viability and yield, but critically by cellular composition and the fraction of droplets containing only ambient RNA ("empty drops"). A study on non-small cell lung cancer (NSCLC) found that while several protocols yielded high viability, only those using specific enzyme mixtures (e.g., Pronase/Dispase/Elastase/Collagenase or Liberase/Elastase) successfully recovered key stromal cells like fibroblasts and endothelial cells [46].
For general success, researchers should aim for a final suspension in a calcium- and magnesium-free PBS buffer with 0.04% BSA, and use wide-bore pipet tips to minimize shear stress during handling [49].
Optimized Workflows for snRNA-seq
For snRNA-seq, the focus shifts from cell dissociation to nuclear isolation. A simplified and efficient protocol was developed for long-term frozen pediatric glioma tissues, demonstrating the utility of snRNA-seq for rare and archived samples [48].
Key steps in the optimized nuclear isolation protocol [48]:
- Homogenization: Dounce homogenize 20-50 mg of frozen tissue in an ice-cold lysis buffer.
- Filtration: Filter the homogenate through a cell strainer to remove debris.
- Washing: Centrifuge and wash the nuclear pellet 2-3 times with a lysis buffer (without detergent) to eliminate residual cellular debris and free RNA. While three washes provide the cleanest preparation, two washes may be preferred for low-input material to maximize yield [48].
This protocol emphasizes speed (under 30 minutes) and the inclusion of RNase inhibitors at all stages to preserve RNA integrity [48] [49]. The quality of the isolated nuclei should be confirmed via microscopy, looking for intact, debris-free nuclei [49].
Direct Performance Comparison
The choice between scRNA-seq and snRNA-seq has a measurable impact on experimental outcomes, as shown by studies that directly compare both methods.
- Cell Type Recovery: A systematic analysis of human tumors found that both methods recovered the same major cell types from matched samples, but in different proportions [46]. scRNA-seq is often biased towards immune cells that dissociate more easily, whereas snRNA-seq more effectively recovers attached cell types like epithelial cells and neurons [47].
- Gene Detection: A study on Drosophila tissue confirmed that snRNA-seq effectively identifies relevant cell types without the artifact of stress-response gene expression seen in scRNA-seq [45]. However, because nuclei contain a higher proportion of unspliced pre-mRNA, snRNA-seq data includes more intronic reads. Modern analysis pipelines (e.g., Cell Ranger 7.0) must be configured to include these intronic reads for accurate gene counting in snRNA-seq [47].
Table 2: Performance Comparison from Experimental Studies
| Metric | scRNA-seq Findings | snRNA-seq Findings |
|---|---|---|
| Cell Type Bias | Recovers more immune cells [46] [47] | Better recovers attached cells (neurons, epithelia) [46] [47] |
| Gene Expression Correlation | N/A | High correlation with bulk RNA-seq data [47] |
| Stress Gene Induction | Can be high due to dissociation [45] | Minimized [45] [47] |
| Data Quality (Example) | NSCLC: ~3,500 mean UMI/cell (LE protocol) [46] | Pediatric Glioma: Median mitochondrial reads <1% [48] |
The Scientist's Toolkit: Essential Reagents and Materials
The following table details key solutions used in the featured experiments to overcome sample preparation challenges.
Table 3: Research Reagent Solutions for Single-Cell Genomics
| Reagent / Material | Function | Example Use Case |
|---|---|---|
| Liberase TM | Enzyme blend for gentle tissue dissociation; degrades collagen. | Optimized dissociation of breast cancer tissue [46]. |
| Pronase, Dispase, Elastase | Enzymes for breaking down various ECM components and proteins. | Effective protocol for recovering fibroblasts/endothelial cells in NSCLC [46]. |
| Dounce Homogenizer | Provides controlled mechanical force for tissue disruption. | Standard tool for homogenizing tissue in nuclear isolation protocols [48] [47]. |
| RNase Inhibitor | Protects RNA from degradation during sample processing. | Critical addition to all buffers in nuclei preparations [48] [49]. |
| Iodixanol (OptiPrep) / Sucrose Gradient | Density gradient medium for debris removal. | Clean-up step to remove myelin debris from brain tissue nuclei preps [47]. |
| Flowmi Cell Strainer (40 µm) | Filters out large aggregates and debris from cell suspensions. | Recommended for cleaning single-cell suspensions before loading [49]. |
Visualizing the Strategic Path for Sample Preparation
The following workflow diagram synthesizes the decision-making process for choosing between scRNA-seq and snRNA-seq, incorporating the key challenges and solutions discussed.
Strategic Workflow for scRNA-seq vs. snRNA-seq
The path to successful single-cell transcriptomics in stem cell research is paved with critical decisions at the sample preparation stage. Bulk RNA-seq provides a useful but limited overview, while scRNA-seq and snRNA-seq offer unparalleled resolution of cellular heterogeneity. The experimental data clearly shows that there is no one-size-fits-all solution. scRNA-seq is the preferred method when working with fresh, dissociable tissue and the goal is to profile mature, cytoplasmic transcripts. In contrast, snRNA-seq is an indispensable alternative for frozen archives, hard-to-dissociate tissues, and when seeking to minimize dissociation-induced stress artifacts. By understanding these trade-offs—and applying the optimized protocols and quality control metrics detailed here—researchers can strategically select and implement the most appropriate method to ensure their data accurately reflects the true biological complexity of their stem cell systems.
The transition from bulk RNA sequencing (bulk RNA-seq) to single-cell RNA sequencing (scRNA-seq) represents a paradigm shift in stem cell biology, offering unprecedented resolution to dissect cellular heterogeneity. Bulk RNA-seq provides a population-average gene expression profile, effectively masking the diversity of individual cells within a sample [1] [3]. In contrast, scRNA-seq unlocks the ability to investigate transcriptomes at the individual cell level, revealing rare subpopulations, transient states, and continuous differentiation trajectories that are fundamental to understanding stem cell biology [1] [50]. However, this enhanced resolution comes with increased computational challenges, including data sparsity, dropout events, and analytical complexity that require specialized bioinformatic approaches [51] [52].
This guide provides an objective comparison of scRNA-seq versus bulk RNA-seq, with a specific focus on their application in stem cell heterogeneity research. We examine their respective technical performance characteristics, computational requirements, and practical applications, supported by experimental data and detailed methodologies to inform research design decisions in both academic and drug development settings.
Technical Performance & Data Structure Comparison
The fundamental difference between bulk and single-cell RNA sequencing lies in their resolution and the resulting data structure. Bulk RNA-seq analyzes pooled RNA from thousands to millions of cells, producing an averaged expression profile for the entire population [1] [4]. This approach effectively obscures cellular heterogeneity and cannot distinguish between a gene that is moderately expressed in all cells versus one that is highly expressed in a small subpopulation [3]. scRNA-seq, however, profiles individual cells separately, typically using microfluidic partitioning systems like the 10X Genomics Chromium platform that employs Gel Bead-in-Emulsion (GEM) technology to barcode each cell's transcriptome [3] [53]. This enables the identification of distinct cell types, states, and rare populations within heterogeneous samples like stem cell cultures [50].
A critical technical challenge unique to scRNA-seq is the phenomenon of "dropouts" - events where a gene is observed at moderate expression levels in one cell but not detected in another cell of the same type [51]. These dropouts occur due to the low amounts of mRNA in individual cells, inefficient mRNA capture, and stochastic gene expression, resulting in highly sparse data matrices with zero inflation [51] [52]. scRNA-seq datasets typically exhibit much higher sparsity (often exceeding 90% zeros) compared to bulk RNA-seq data [52]. The table below summarizes the core technical differences between these approaches:
Table 1: Fundamental technical differences between bulk and single-cell RNA sequencing
| Feature | Bulk RNA-seq | Single-Cell RNA-seq |
|---|---|---|
| Resolution | Population average [1] | Single-cell level [1] |
| Detection of Heterogeneity | Masks cellular diversity [3] | Reveals subpopulations and rare cells [50] |
| Typical Applications | Differential expression, transcriptome annotation, fusion gene discovery [4] | Cell type identification, developmental trajectories, tumor microenvironment mapping [1] [4] |
| Data Sparsity | Low | High (often >90% zeros) [51] [52] |
| Primary Technical Challenge | Sampling bias in heterogeneous tissues [3] | Dropout events and data sparsity [51] [52] |
Performance Benchmarking: Quantitative Capabilities and Limitations
When selecting a transcriptomic approach for stem cell research, understanding the quantitative performance characteristics of each technology is essential. Bulk RNA-seq typically provides more comprehensive transcriptome coverage per sample with lower sequencing depth requirements, making it cost-effective for large cohort studies or biobank projects [1]. However, it fundamentally lacks the resolution to identify distinct cellular subpopulations within a sample, which is particularly problematic when studying stem cell heterogeneity where rare progenitor cells or transitional states may drive biological outcomes [3].
scRNA-seq enables the identification of these rare cell types (including cancer stem cells) and characterization of their gene expression signatures, but with distinct technical limitations [54]. The technology typically captures only 10-50% of a cell's transcripts, with detection sensitivity ranging from 500-5,000 genes per cell depending on the platform and cell type [53]. The 10X Genomics Chromium system, currently considered the gold standard, achieves cell capture efficiencies of 65-75% with multiplet rates maintained below 5% under optimal loading conditions [53]. The following table compares key performance metrics:
Table 2: Experimental performance metrics for bulk versus single-cell RNA sequencing
| Performance Metric | Bulk RNA-seq | Single-Cell RNA-seq |
|---|---|---|
| Genes Detected per Sample | Comprehensive transcriptome coverage [1] | 500-5,000 genes per cell [53] |
| Rare Cell Population Detection | Limited to none | Capable of identifying rare populations [50] |
| mRNA Capture Efficiency | High (not typically quantified as a limitation) | 10-50% of cellular transcripts [53] |
| Cell Capture Efficiency | Not applicable | 30-75% (platform-dependent) [53] |
| Multiplet Rate | Not applicable | <5% (10X Genomics Chromium) [53] |
| Stem Cell Application Example | Overall stemness signatures | Identification and characterization of cancer stem cells [54] |
Computational Challenges and Analytical Approaches
The analytical workflows for bulk and single-cell RNA-seq data differ substantially in their complexity and computational demands. Bulk RNA-seq analysis typically involves quality control, read alignment, quantification, and differential expression testing using established tools like DESeq2, with relatively straightforward statistical frameworks [4]. In contrast, scRNA-seq analysis requires specialized computational methods to address data sparsity, high dimensionality, and technical artifacts [51] [52].
A fundamental challenge in scRNA-seq analysis is distinguishing biological heterogeneity from technical noise, particularly dropout events. While traditional approaches treat dropouts as a problem to be fixed through imputation methods (MAGIC, SAVER, scImpute) or mitigated through gene selection and dimension reduction [51], emerging evidence suggests that dropout patterns themselves contain biological information. A 2020 study demonstrated that the binary dropout pattern (zero/non-zero pattern) is as informative as quantitative expression of highly variable genes for identifying cell types [51]. Co-occurrence clustering algorithms that leverage these dropout patterns can effectively identify cell populations based on gene pathways beyond highly variable genes [51].
The standard scRNA-seq clustering pipeline (dimensionality reduction via PCA followed by graph-based clustering using Leiden or Louvain algorithms) performs well in terms of cluster homogeneity but shows decreased stability under high dropout rates [52]. This has significant implications for identifying stem cell subpopulations, as local neighborhood relationships may be disrupted. Analytical workflows typically involve:
- Quality Control & Filtering: Removing cells with high mitochondrial gene content or low gene counts [55] [54]
- Normalization: Using methods like SCTransform or log-normalization to address technical variability [54]
- Feature Selection: Identifying highly variable genes [55]
- Dimension Reduction: Applying PCA and visualization with UMAP/t-SNE [56]
- Clustering: Using graph-based algorithms (Leiden, Louvain) to identify cell populations [56] [52]
- Differential Expression: Identifying marker genes across clusters [54]
Diagram 1: Analytical workflow for scRNA-seq data showing challenges (red) and solutions (green)
For stem cell applications, tools like CytoTRACE have been developed specifically to predict cellular stemness at single-cell resolution by leveraging gene expression data and intrinsic stemness gene sets [54]. This approach enables researchers to identify tumor epithelial cell clusters with the highest stemness or lowest differentiation potential, facilitating the discovery of cancer stem cell populations [54].
Case Study: Integrated Analysis in Esophageal Cancer Stem Cell Research
A 2025 study on esophageal cancer (ESCA) exemplifies the powerful integration of scRNA-seq and bulk RNA-seq to investigate cancer stem cells (CSCs) and their clinical implications [54]. This research employed a sophisticated analytical pipeline to identify stemness-related gene signatures and construct a prognostic model applicable to heterogenous tumor samples.
The experimental methodology began with scRNA-seq data processing using the Seurat package, applying quality control thresholds to exclude cells with mitochondrial gene content exceeding 30% or expressing more than 10,000 genes [54]. Following normalization using SCTransform, dimension reduction was performed via RunPCA (50 principal components) and RunUMAP (20 dimensions), with clustering identifying 12 distinct cell clusters [54]. Cell type annotation was based on established marker genes: PTPRC for immune cells, CD19/CD79A for B cells, SOX9/CD44 for cancer stem cells, and CD3D/CD3E for T cells [54].
A critical innovation in this study was the application of CytoTRACE to quantify stemness potential in tumor-derived epithelial cell clusters [54]. This approach identified distinct stemness potentials among cell populations, enabling the researchers to focus subsequent analyses on the most relevant cellular subsets. By intersecting stemness-associated genes with differentially expressed genes from tumor epithelial clusters, they identified prognostic candidates through univariate Cox regression analysis [54].
The final analytical step employed LASSO Cox regression with ten-fold cross-validation to construct an 18-gene tumor stem cell marker signature (TSCMS) model [54]. This model successfully stratified patients into high- and low-risk groups with significant survival differences, validated through Kaplan-Meier analysis and ROC curves [54]. Additionally, the model revealed correlated immune infiltration patterns and chemotherapy sensitivity differences between risk groups, while functional validation confirmed TSPO as a key oncogene associated with ESCA stemness and poor prognosis [54].
Table 3: Key research reagents and computational tools for stem cell heterogeneity studies
| Tool/Reagent | Function | Application in Stem Cell Research |
|---|---|---|
| 10X Genomics Chromium | Single-cell partitioning and barcoding [3] | High-throughput single-cell transcriptome profiling |
| Seurat R Package | scRNA-seq data analysis and clustering [54] | Cell cluster identification and visualization |
| CytoTRACE | Stemness prediction at single-cell level [54] | Quantification of cellular stemness potential |
| SCTransform | Normalization and technical noise mitigation [54] | Data preprocessing and quality control |
| CellChat | Cell-cell communication analysis [55] | Mapping signaling networks in stem cell niches |
| Scissor Algorithm | Phenotype-associated cell identification [55] | Linking cell populations to clinical outcomes |
Strategic Implementation Guide
Selecting between bulk and single-cell RNA sequencing approaches requires careful consideration of research objectives, sample characteristics, and computational resources. The following integrated workflow and decision framework can guide appropriate technology selection for stem cell research applications:
Diagram 2: Decision framework for selecting RNA sequencing approaches in stem cell research
Recommended Applications:
Bulk RNA-seq is recommended for: Differential gene expression analysis between experimental conditions; Large cohort studies or biobank projects; Transcriptome annotation and novel isoform identification; Studies with limited budget or computational resources [1] [4].
scRNA-seq is preferred for: Characterizing cellular heterogeneity and identifying novel cell types; Reconstruction of developmental trajectories and lineage relationships; Identifying rare cell populations (e.g., cancer stem cells); Studying tumor microenvironments and cell-cell communication networks [1] [54] [50].
Integrated approaches provide the most comprehensive insights when: Linking cellular subpopulations to clinical outcomes; Validating single-cell derived signatures in larger cohorts; Understanding how cellular heterogeneity drives bulk expression patterns [55] [54].
For research focusing specifically on stem cell heterogeneity, scRNA-seq offers indispensable advantages despite its higher complexity and cost. The technology's ability to resolve distinct stemness states, identify rare progenitor populations, and trace lineage relationships provides biological insights fundamentally inaccessible through bulk approaches [54] [50]. As the field advances, integration of scRNA-seq with spatial transcriptomics, multi-omics platforms, and computational methods that leverage rather than correct for data sparsity will further enhance our understanding of stem cell biology and its therapeutic applications [51] [53].
The choice of RNA sequencing technology is pivotal in shaping our understanding of complex biological systems, particularly when studying intricate populations like immune cells and stem cells. Bulk RNA sequencing (bulk RNA-seq) provides a population-averaged gene expression profile, while single-cell RNA sequencing (scRNA-seq) resolves transcriptomes at the individual cell level, enabling the dissection of cellular heterogeneity [8]. This technological distinction is crucial in stem cell biology, where rare subpopulations such as cancer stem cells (CSCs) drive tumor initiation, progression, and therapeutic resistance [14] [54]. Similarly, in immunology, the ability to characterize diverse cell subtypes—each with unique functional states—is fundamental to understanding immune responses [9] [57].
The performance of these platforms varies significantly in key metrics such as mRNA detection sensitivity, cell recovery rates, and ability to detect rare cell populations. These differences directly impact gene detection capabilities and consequently influence biological interpretations. This guide provides an objective comparison of scRNA-seq and bulk RNA-seq methodologies, focusing on their performance characteristics in immune and stem cell research contexts, to inform appropriate platform selection for specific research objectives.
Technical Performance Benchmarks: scRNA-seq vs. Bulk RNA-seq
Direct comparisons of scRNA-seq and bulk RNA-seq reveal fundamental trade-offs between cellular resolution and transcript detection completeness. Bulk RNA-seq typically captures a greater proportion of the transcriptome from a sample overall, while scRNA-seq sacrifices some sensitivity to gain resolution at the individual cell level.
Quantitative Benchmarking Across Platforms
Systematic benchmarking studies using defined cell mixtures provide critical performance metrics for platform selection. A comprehensive evaluation of seven high-throughput scRNA-seq methods using a controlled mixture of human and murine lymphocyte cell lines revealed substantial differences in performance [9].
Table 1: Performance Metrics of High-Throughput scRNA-seq Methods
| Method | Cell Recovery Rate | mRNA Detection Sensitivity (UMIs/Cell) | mRNA Detection Sensitivity (Genes/Cell) | Cell Multiplet Rate | Cell-Assignable Reads |
|---|---|---|---|---|---|
| 10x Genomics 3′ v3 | ~30-80% | 28,006 | 4,776 | ~5% | ~50-75% |
| 10x Genomics 5′ v1 | ~30-80% | 25,988 | 4,470 | ~5% | ~50-75% |
| 10x Genomics 3′ v2 | ~30-80% | 21,570 | 3,882 | ~5% | ~50-75% |
| ddSEQ | <2% | 10,466 | 3,644 | ~5% | <25% |
| Drop-seq | <2% | 8,791 | 3,255 | ~5% | <25% |
| ICELL8 3′ DE | Variable | Unreliable (protocol limitations) | Unreliable (protocol limitations) | ~5% | >90% |
The 10x Genomics 5′ v1 and 3′ v3 methods demonstrated superior mRNA detection sensitivity with fewer dropout events, facilitating more reliable identification of differentially expressed genes and improved concordance with bulk RNA-seq immune signatures [9]. It's important to note that all scRNA-seq methods inherently suffer from limitations in recovering complete transcriptomes due to cellular and transcriptional dropout events, which can be compounded by limited sample availability and prior knowledge of heterogeneity [9].
Performance in Stem Cell Research Applications
In stem cell research, scRNA-seq enables the identification and characterization of rare stem cell populations based on their transcriptomic profiles. The CytoTRACE computational method is frequently employed to predict cellular stemness at single-cell resolution, helping identify tumor epithelial cell clusters with the highest stemness or lowest differentiation [14] [54] [58]. This approach has been successfully applied in lung adenocarcinoma (LUAD) and esophageal cancer (ESCA) studies to identify stem cell clusters with elevated expression of markers like CD44, CD133 (PROM1), and aldehyde dehydrogenase 1 (ALDH1) [14] [54].
Bulk RNA-seq, while unable to resolve this cellular hierarchy, provides complementary advantages in detecting low-abundance transcripts and generating robust expression quantifications across entire tissue samples. The integration of both approaches has proven powerful—using scRNA-seq to identify stem cell populations and their marker genes, then applying bulk RNA-seq to validate these findings across larger cohorts and build prognostic models [14] [54] [59].
Experimental Design and Methodological Considerations
Standardized scRNA-seq Experimental Workflow
The experimental workflow for scRNA-seq involves several critical steps that impact data quality and interpretation:
Table 2: Key Steps in scRNA-seq Experimental Protocol
| Step | Description | Key Considerations |
|---|---|---|
| Cell Suspension Preparation | Creating high-quality single-cell suspensions | Viability >80%, minimal debris, appropriate concentration |
| Library Preparation | Using commercial systems (10x Genomics, ddSEQ, Drop-seq, ICELL8) | Method choice affects recovery, sensitivity, and multiplexing |
| Sequencing | High-throughput sequencing on Illumina platforms | Read depth (50,000 reads/cell recommended), read length |
| Quality Control | Assessing data quality using tools like FastQC | Filtering cells by gene counts, UMI counts, mitochondrial percentage |
| Data Analysis | Using packages like Seurat in R | Normalization, clustering, differential expression |
A typical scRNA-seq protocol involves several key stages as illustrated below:
Bulk RNA-seq Experimental Framework
Bulk RNA-seq protocols follow a more established workflow with distinct processing stages:
For bulk RNA-seq, the process begins with RNA extraction from intact tissue or cell populations, followed by rigorous quality control assessment of RNA integrity numbers (RIN) [8]. Library preparation strategies vary depending on the specific protocol, with sequencing depth typically ranging from 20-50 million reads per sample for standard differential expression analyses. The computational workflow involves read alignment using tools like STAR or TopHat2, expression quantification with featureCounts or HTSeq, and downstream differential expression analysis with packages such as DESeq2 [8] [14].
Analytical Approaches for Integrated Data Interpretation
Specialized Computational Tools for scRNA-seq Data
The analysis of scRNA-seq data requires specialized computational approaches to address technical artifacts and biological complexity. The Seurat R package provides a comprehensive toolkit for scRNA-seq analysis, including data normalization, clustering, and differential expression [14] [54] [59]. Specific analytical strategies include:
- Cell Type Identification: Using marker gene expression (e.g., PTPRC for immune cells, EPCAM for epithelial cells) to annotate cell clusters [14] [54]
- Stemness Prediction: Applying CytoTRACE to quantify differentiation states and identify stem-like cells [14] [54] [58]
- Trajectory Inference: Reconstructing developmental pathways using tools like Monocle to understand stem cell differentiation hierarchies
- Differential Expression: Identifying marker genes using the FindAllMarkers function with parameters (only.pos = T, logfc.threshold = 0.25) [14] [54]
For bulk RNA-seq, the analytical workflow employs different tools including DESeq2 for differential expression, CIBERSORTx for immune cell deconvolution, and GSVA for pathway analysis [14] [58]. The integration of scRNA-seq and bulk RNA-seq data can be enhanced through advanced computational approaches such as multi-level attention graph neural networks (MLA-GNN), which have demonstrated superior performance in prognostic stratification for cancers like thyroid carcinoma [59].
Integrative Analysis Frameworks
The synergy between scRNA-seq and bulk RNA-seq can be leveraged through specific integrative frameworks:
This integrated approach has been successfully applied across multiple cancer types. In lung adenocarcinoma, scRNA-seq identified epithelial cell clusters with high stemness potential, which were then used to develop a prognostic tumor stem cell marker signature (TSCMS) validated using bulk RNA-seq data from TCGA [14]. Similarly, in esophageal cancer, this integrative strategy revealed distinct stemness potentials and enabled the construction of an 18-gene TSCMS model that stratified patients by risk and therapeutic response [54].
Essential Research Reagents and Tools
Successful implementation of RNA-seq studies requires carefully selected reagents and computational tools. The following table summarizes key solutions for scRNA-seq and bulk RNA-seq workflows:
Table 3: Essential Research Reagents and Computational Tools
| Category | Product/Tool | Primary Function | Application Context |
|---|---|---|---|
| Library Prep Kits | 10x Genomics 3′ v3 | Single-cell library preparation | High-sensitivity scRNA-seq |
| SMART-Seq2 | Full-length scRNA-seq | Low-input or full-length transcripts | |
| Analysis Software | Seurat | scRNA-seq data analysis | Comprehensive single-cell analysis |
| DESeq2 | Bulk RNA-seq differential expression | Gene expression analysis | |
| CytoTRACE | Stemness prediction | Single-cell stemness quantification | |
| Cell Sorting | Fluorescence-activated cell sorting (FACS) | Cell population isolation | Immune/stem cell enrichment |
| Quality Control | FastQC | Sequence data quality assessment | QC for both bulk and scRNA-seq |
| Flow cytometry | Protein validation | Validation of transcriptomic findings |
These reagents and tools form the foundation of robust RNA-seq workflows. For scRNA-seq, the 10x Genomics platform has demonstrated strong performance in immune cell profiling, with the 3′ v3 and 5′ v1 kits showing highest mRNA detection sensitivity [9]. For specialized applications requiring full-length transcript coverage, SMART-Seq2 protocols provide advantages in isoform-level analysis [8]. In bulk RNA-seq, selection of appropriate library preparation kits depends on required throughput, RNA input quality, and whether strand-specific information is needed.
The choice between scRNA-seq and bulk RNA-seq technologies involves careful consideration of research objectives, sample characteristics, and resource constraints. scRNA-seq provides unparalleled resolution for discovering novel cell types, characterizing stem cell hierarchies, and mapping developmental trajectories, making it ideal for exploratory studies of heterogeneous tissues. Bulk RNA-seq offers higher sensitivity for detecting low-abundance transcripts and greater statistical power for differential expression in large cohorts, making it suitable for biomarker validation and cohort studies.
For comprehensive research programs, an integrated approach leveraging both technologies provides the most powerful strategy—using scRNA-seq for initial discovery of cell populations and biomarkers, then applying bulk RNA-seq for validation across larger patient cohorts. This synergistic methodology has proven particularly effective in stem cell and immunology research, where cellular heterogeneity plays a critical role in disease mechanisms and treatment responses. As both technologies continue to evolve, with improvements in sensitivity, throughput, and multi-omic integration, their combined application will further accelerate discoveries in complex biological systems.
In stem cell research, the choice between bulk and single-cell RNA sequencing (scRNA-seq) is often presented as a trade-off: breadth of coverage versus cellular resolution. Bulk RNA-seq provides a population-averaged gene expression profile, making it a powerful tool for identifying overall transcriptional changes. In contrast, scRNA-seq unveils the cellular heterogeneity within a population, allowing for the identification of rare stem cell subtypes and transient cell states [1] [2]. Rather than viewing these methods as mutually exclusive, a new paradigm is emerging where their strategic integration provides a more comprehensive understanding of stem cell biology than either approach could deliver alone. This guide explores the experimental frameworks and quantitative data that demonstrate the synergistic power of combined bulk and single-cell approaches, with a focus on applications in stem cell heterogeneity research.
Section 1: A Quantitative Comparison of Technical Capabilities
The decision to employ bulk RNA-seq, scRNA-seq, or an integrated design must be grounded in a clear understanding of their technical performances. The table below summarizes key comparative metrics based on current technologies and literature.
Table 1: Technical and Performance Comparison of Bulk vs. Single-Cell RNA-Seq
| Feature | Bulk RNA-Seq | Single-Cell RNA-Seq | Supporting Data & References |
|---|---|---|---|
| Resolution | Population average | Individual cell level | Patel et al. (2014) demonstrated scRNA-seq reveals intratumoral heterogeneity in glioblastoma, impossible with bulk [2]. |
| Cost per Sample | Lower (~1/10 of scRNA-seq) | Higher | Stark et al. (2019) reported ~$300 per sample for bulk vs. $500-$2000 for scRNA-seq [2]. |
| Gene Detection Sensitivity | Higher | Lower | Chen et al. (2019) found bulk detected more genes per sample (median 13,378) vs. scRNA-seq (median 3,361) in matched PBMCs [2]. |
| Rare Cell Type Detection | Limited, masked by abundant cells | Possible, can identify rare subtypes | Grün et al. (2015) identified rare enteroendocrine cells in mouse intestine masked in bulk data [2]. |
| Data Complexity | Lower, simpler analysis | Higher, requires specialized bioinformatics | Lähnemann et al. (2020) highlighted the need for specialized methods due to noise and sparsity in scRNA-seq [2]. |
| Splicing Analysis | More comprehensive | Limited, due to sparse data per cell | Ntranos et al. (2019) developed methods combining bulk and single-cell to improve splicing detection [2]. |
| Ideal Application | Differential gene expression in homogeneous samples; biomarker discovery | De novo cell type identification; mapping heterogeneity; developmental trajectories | 10x Genomics (2025) notes bulk is ideal for differential expression, while single cell resolves heterogeneity [1]. |
Section 2: Experimental Designs for Integrated Studies
The synergy between bulk and single-cell RNA-seq is realized through specific experimental designs. The following protocols, drawn from recent studies, provide a blueprint for effective integration.
Protocol 2.1: Using scRNA-seq to Deconvolve Bulk Signatures
This approach uses scRNA-seq as a reference map to interpret bulk RNA-seq data from complex, heterogeneous samples, such as stem cell niches or whole tissues.
Experimental Workflow:
- Sample Collection: Collect matched samples from the same biological source (e.g., synovial tissue, tumor organoids).
- Parallel Sequencing: Process one set of samples for bulk RNA-seq and another for scRNA-seq.
- Cell Atlas Construction: Use scRNA-seq data to identify all cell types and states present, defining their unique gene expression signatures.
- Computational Deconvolution: Apply algorithms to the bulk RNA-seq data to estimate the proportional abundance of each cell type identified by scRNA-seq. This reveals shifts in cellular composition between conditions that are hidden in the bulk average.
- Validation: Use techniques like fluorescence-activated cell sorting (FACS) or immunohistochemistry to validate the predicted cellular abundances.
Case Study: A study on rheumatoid arthritis (RA) seamlessly integrated scRNA-seq and bulk RNA-seq data from human and mouse synovial tissues. The scRNA-seq analysis first identified 26,923 cells and revealed a significantly expanded subpopulation of Stat1+ macrophages in RA synovium. This high-resolution finding was then used to contextualize bulk RNA-seq data from 213 RA and 63 healthy samples, which confirmed the upregulation of STAT1. The combined data established STAT1 as a key regulator in RA pathogenesis, a link that would have been difficult to establish with either method alone [41].
Protocol 2.2: From Single-Cell Discovery to Bulk Validation
This design uses scRNA-seq for hypothesis-free discovery in a small cohort, followed by bulk RNA-seq to validate findings in a larger, statistically powerful cohort.
Experimental Workflow:
- Discovery Phase: Perform scRNA-seq on a limited number of samples from different experimental conditions (e.g., healthy vs. diseased, control vs. treated).
- Target Identification: Analyze the data to identify rare cell populations, novel cell markers, or specific gene signatures of interest. For example, use computational tools like CytoTRACE to predict stemness in individual cells [60].
- Panel Definition: Based on the discovery results, define a targeted gene signature for the cell population or state of interest.
- Validation Phase: Use this signature to analyze bulk RNA-seq data from a large, independent cohort of samples. This tests the robustness and clinical relevance of the discovery.
- Model Building: Construct prognostic or diagnostic models based on the validated gene signature.
Case Study: In lung adenocarcinoma (LUAD) research, scientists used scRNA-seq to analyze tumor-derived epithelial cells. They applied CytoTRACE to quantify cellular stemness and identified a specific epithelial cluster (EpiC1) with the highest stemness potential. The gene signature from EpiC1 was then used to construct a prognostic model (TSCMS) which was validated using bulk RNA-seq data from The Cancer Genome Atlas (TCGA) and other GEO cohorts comprising hundreds of patients. This integrated approach confirmed the model's value in predicting patient survival and response to therapy [60].
Protocol 2.3: Unraveling Signaling Pathways through Multiomic Data Integration
This advanced protocol combines sequencing data with functional studies to move from correlation to causation in stem cell regulation.
Experimental Workflow:
- Characterization: Isolate and characterize stem cells and their niche cells (e.g., via flow cytometry for MSC markers and multilineage differentiation assays) [11].
- Differential Profiling: Perform bulk RNA-seq on purified populations of stem cells and niche cells from different conditions to identify differentially expressed genes and pathways.
- Integrated Analysis: Cross-reference bulk sequencing findings with scRNA-seq data to pinpoint which specific cell subsets express the key regulatory genes.
- Functional Validation: Use co-culture experiments, siRNA knockdown, recombinant proteins, and pharmacological inhibitors in vitro to test the functional role of the candidate genes and pathways in stem cell fate decisions [11].
Case Study: Research on human nail stem cell (NSC) differentiation masterfully employed this integrated design. Bulk RNA-seq of onychofibroblasts (OFs) and control fibroblasts identified BMP4 as a key differentially expressed signal. This finding was placed in a spatial and cellular context through integrated analysis with scRNA-seq data, suggesting that OFs participate in NSC differentiation via mesenchymal-epithelial interactions. Subsequent functional co-culture experiments confirmed that BMP4 derived from OFs indeed induced NSC differentiation via the TGF-β signaling pathway, and this effect was attenuated by the inhibitor LDN193189 [11].
Section 3: The Scientist's Toolkit: Essential Reagents and Platforms
Successful integration of sequencing technologies relies on a suite of trusted laboratory and computational tools.
Table 2: Key Research Reagent Solutions for Integrated RNA-seq Studies
| Item / Solution | Function / Application | Example Use Case |
|---|---|---|
| 10x Genomics Chromium Platform | An instrument-enabled, droplet-based system for high-throughput single-cell partitioning. | Used in benchmark studies to characterize controlled cancer heterogeneity from mixed cell lines [20]. |
| CellPlex Kit (10x Genomics) | Enables sample multiplexing, allowing pooling of up to 12 samples for scRNA-seq to reduce batch effects and costs. | Demonstrated in library prep for lung cancer cell line benchmarks, facilitating sample pooling [20]. |
| Seurat R Package | A comprehensive toolkit for the quality control, analysis, and integration of scRNA-seq data. | Used extensively for processing, clustering, and annotating cell types in RA and LUAD studies [41] [60]. |
| CytoTRACE Algorithm | Computationally predicts the stemness or differentiation state of individual cells from scRNA-seq data. | Employed to identify the tumor epithelial cell cluster with the highest stemness potential in LUAD [60]. |
| DESeq2 R Package | A standard tool for differential expression analysis of bulk RNA-seq count data. | Used to identify differentially expressed RBPs between HPV+ and HPV- cervical cancer samples [61]. |
| CIBERSORTx Algorithm | A computational method for deconvoluting the cell-type-specific gene expression fractions from bulk RNA-seq data. | Applied in LUAD studies to evaluate immune cell infiltration based on signatures derived from scRNA-seq [60]. |
| LASSO-Cox Regression | A statistical model used for variable selection and building prognostic signatures from high-dimensional genomic data. | Utilized to construct a prognostic TSCMS model from stemness-related genes in the LUAD case study [60]. |
Section 4: Visualizing Integrated Workflows and Biological Insights
The following diagrams, generated with Graphviz, illustrate the logical flow of integrated studies and the biological pathways they can uncover.
Diagram 1: Integrated scRNA-seq & Bulk RNA-seq Analysis Workflow
Diagram 2: Stem Cell Niche Signaling Pathway
This diagram models a key signaling pathway discovered through integrated omics approaches, such as the BMP4/TGF-β pathway in nail stem cell regulation [11].
The strategic integration of bulk and single-cell RNA sequencing is not merely a technical exercise; it is a powerful framework that reflects the biological reality of complex systems. Bulk RNA-seq provides the wide-angle lens to observe population-level changes, while scRNA-seq offers the microscope to zoom in on the individual cellular actors. As the case studies in stem cell biology, cancer, and immunology demonstrate, the combination is far more illuminating than the sum of its parts. For researchers embarking on studies of heterogeneous systems, designing experiments that leverage both approaches from the outset will be key to unlocking deeper, more robust, and clinically translatable discoveries.
Beyond the Hype: Validating Discoveries and Making the Strategic Choice for Your Research
{direct performance comparison article content start}
Direct Performance Comparison: A Systematic Look at Sensitivity and Biological Information Recovery
The choice between single-cell RNA sequencing (scRNA-seq) and bulk RNA sequencing (bulk RNA-seq) is pivotal in experimental design, fundamentally shaping a researcher's ability to dissect complex biological systems. This comparison is particularly critical in the study of stem cell heterogeneity, where identifying rare subpopulations and transient states can unlock insights into development, regeneration, and disease. While bulk RNA-seq provides a population-level average of gene expression, scRNA-seq empowers the deconvolution of cellular heterogeneity at the resolution of individual cells [3]. This guide provides a direct performance comparison of these two technologies, focusing on their sensitivity, biological information recovery, and practical application in stem cell research. We objectively summarize experimental data and methodologies to inform researchers, scientists, and drug development professionals in selecting the optimal tool for their specific scientific inquiries.
Quantitative Performance Comparison
The performance disparity between bulk and single-cell RNA-seq stems from their fundamental approaches: one measures a averaged signal, while the other captures the distinct voices of individual cells. The table below summarizes a direct comparison of their key performance metrics.
Table 1: Direct Performance Comparison of Bulk RNA-seq vs. Single-Cell RNA-seq
| Performance Metric | Bulk RNA-seq | Single-Cell RNA-seq | Supporting Experimental Data / Context |
|---|---|---|---|
| Resolution & Heterogeneity Detection | Population average; masks cellular heterogeneity [1] [4] | Individual cell level; reveals cellular heterogeneity, rare cell types, and novel subpopulations [1] [3] [4] | scRNA-seq identified a rare subpopulation of Zscan4+ mouse embryonic stem cells with greater differentiation potential, a finding masked in bulk data [2]. |
| Gene Detection Sensitivity | Higher genes detected per sample [2] | Lower genes detected per cell due to dropout events and technical noise [19] [2] | A study on human PBMCs found bulk RNA-seq detected a median of 13,378 genes per sample compared to a median of 3,361 genes per cell with scRNA-seq [2]. |
| Rare Cell Type Detection | Limited; signals from rare cells are diluted by the majority population [1] [2] | Possible; can identify rare cell types constituting as little as ~0.01% of a sample [31] [2] | scRNA-seq identified CFTR-expressing pulmonary ionocytes (1 in 200 cells) in the lung and a rare CAR T cell population (~1 in 10,000) [2]. |
| Splicing & Isoform Analysis | More comprehensive for global alternative splicing events [3] [2] | Limited with 3'-end methods; full-length protocols exist but are less common [3] [19] | Bulk RNA-seq is widely used for transcriptome annotation and alternative splicing analysis due to its deeper coverage per transcript [3] [4]. |
| Cost Efficiency | Lower cost per sample; ideal for large cohort studies [1] [2] | Higher cost per sample; requires specialized equipment and reagents [1] [2] | Reported costs for bulk RNA-seq are approximately $300 per sample, while scRNA-seq can range from $500 to $2000 per sample [2]. |
| Data Complexity & Analysis | Lower complexity; established, straightforward analysis pipelines [1] [8] | Higher complexity; requires specialized tools for noise reduction, normalization, and clustering [1] [19] [2] | scRNA-seq data is characterized by high dimensionality, sparsity, and technical noise, necessitating tools for imputation and batch effect correction [19]. |
The quantitative data reveals a clear trade-off: bulk RNA-seq offers greater depth in sequencing per sample and is more cost-effective for profiling overall expression, while scRNA-seq sacrifices this per-gene sensitivity to achieve unparalleled resolution in uncovering cellular diversity.
Experimental Protocols and Methodologies
The stark differences in performance are rooted in the distinct experimental workflows employed by bulk and single-cell RNA-seq. Understanding these methodologies is crucial for interpreting data and designing robust experiments.
Bulk RNA-Seq Workflow
The bulk RNA-seq protocol is a well-established and relatively streamlined process designed to extract an average gene expression signal from a tissue or cell population.
- Sample Collection & RNA Extraction: A biological sample (e.g., a piece of tissue or a cell pellet) is homogenized, and total RNA is extracted from the entire population of cells. This RNA represents a mixture of transcripts from every cell in the sample [1].
- Library Preparation: The extracted RNA is converted into a sequencing library. This typically involves enriching for polyadenylated mRNA, reverse transcribing the RNA into complementary DNA (cDNA), and adding sequencing adapters [1] [8]. Protocols can be tailored to study total RNA, including non-coding RNAs.
- High-Throughput Sequencing: The pooled library is sequenced using next-generation sequencing (NGS) platforms, generating millions of short reads [8].
- Data Analysis: Reads are aligned to a reference genome, and expression levels for each gene are quantified based on the number of reads mapped to its exonic regions. This results in a single expression profile representing the averaged transcriptome of the input cell population [8].
Single-Cell RNA-Seq Workflow
The scRNA-seq workflow introduces critical steps to isolate and barcode individual cells, adding layers of technical complexity in exchange for cellular resolution.
- Viable Single-Cell Suspension Preparation: The starting material must be dissociated into a suspension of live, individual cells. This step is critical and requires careful optimization to maintain cell viability and integrity while avoiding stress-induced transcriptional changes [1] [19].
- Single-Cell Isolation and Barcoding: Individual cells are partitioned into nanoliter-scale reactions. In droplet-based systems like the 10x Genomics Chromium platform, each cell is encapsulated in a water-in-oil droplet (GEM) together with a gel bead. This bead is coated with oligonucleotides containing a cell-specific barcode, a unique molecular identifier (UMI), and a poly(dT) sequence [1] [3]. This ensures that all cDNA molecules derived from a single cell share the same barcode, allowing them to be computationally traced back to their cell of origin after sequencing.
- Reverse Transcription and Library Prep: Within each droplet or reaction vessel, cells are lysed, and the released mRNA is captured by the poly(dT) primers and reverse-transcribed into barcoded cDNA. The cDNA from all cells is then pooled, amplified, and prepared for sequencing [1] [3].
- Sequencing and Advanced Data Analysis: The library is sequenced, and the resulting data undergoes a complex bioinformatic pipeline. This includes demultiplexing (assigning reads to cells based on their barcode), quantification of gene expression counts using UMIs, quality control to remove low-quality cells or doublets, normalization, dimensionality reduction, and clustering to identify cell populations [8] [19].
The following diagram illustrates the core logical and technical relationship between these two workflows.
Diagram 1: Core experimental workflow divergence between Bulk and Single-Cell RNA-seq.
Case Study in Biological Information Recovery
A compelling example of how these technologies complement each other comes from a 2024 study of dilated cardiomyopathy (DCM) published in Cancer Cell [10]. Researchers integrated both bulk and single-cell RNA-seq to dissect the role of non-cardiomyocytes in heart failure.
- Bulk RNA-seq Analysis: The team first applied computational deconvolution methods (xCell, CIBERSORT) to bulk RNA-seq data from DCM and normal heart samples. This initial analysis suggested significant differences in fibroblasts, T cells, and macrophages between the conditions, providing a high-level, population-based insight [10].
- scRNA-seq Reveals Hidden Heterogeneity: To move beyond averages, they performed scRNA-seq on over 70,000 cells from DCM and normal hearts. This high-resolution approach revealed extensive heterogeneity within the non-cardiomyocyte compartment. It identified:
- Specific subpopulations of fibroblasts, including proliferative F3 cells and myofibroblast F6 cells, that were implicated in the fibrotic transition process in DCM [10].
- Two distinct subsets of M2 macrophages (M2-like1 and M2-like2), with the M2-like2 subpopulation enriched in glycolysis and fatty acid metabolism and playing a potential role in inflammation inhibition and fibrosis promotion [10].
- Synergistic Validation: The discovery of the M2-like2 subpopulation via scRNA-seq was subsequently validated back in the larger bulk RNA-seq cohort using deconvolution, confirming its significant increase in DCM patients [10]. This demonstrates a powerful iterative workflow: using bulk sequencing to generate hypotheses and validate findings across cohorts, and single-cell sequencing to make the initial discoveries of novel cellular drivers.
The Scientist's Toolkit: Research Reagent Solutions
The successful execution of RNA-seq experiments, particularly scRNA-seq, relies on a suite of specialized reagents and tools. The following table details key materials and their functions.
Table 2: Essential Research Reagents and Tools for RNA-seq Experiments
| Item | Function / Application |
|---|---|
| 10x Genomics Chromium X Series | Microfluidic instrument for automated, high-throughput partitioning of single cells into GEMs [1] [3]. |
| Gel Beads-in-emulsion (GEMs) | Micro-reaction vessels containing a single cell, a gel bead with barcoded oligos, and reverse transcription mix [1] [3]. |
| Barcoded Oligonucleotides | Oligos on gel beads containing cell barcodes and UMIs to uniquely tag mRNA from each cell [1] [3]. |
| SMART-Seq2 Reagents | A popular, highly sensitive kit for full-length scRNA-seq, often used in plate-based protocols [8] [19]. |
| Enzymes for Reverse Transcription | Reverse transcriptase for converting captured mRNA into stable cDNA [1]. |
| FACS (Fluorescence-Activated Cell Sorting) | A cell isolation technique for plate-based scRNA-seq, allowing pre-selection of cells based on surface markers [19]. |
| Demonstrated Protocols (DPs) | Optimized, sample-specific preparation methods provided by companies like 10x Genomics to ensure high cell viability and data quality [1]. |
Visualization of Single-Cell Barcoding Logic
The core technological innovation enabling high-throughput scRNA-seq is the cellular barcoding strategy. The following diagram details the logic and components of this process within a droplet-based system.
Diagram 2: Logic of single-cell partitioning and mRNA barcoding in droplet-based scRNA-seq.
The direct performance comparison between bulk and single-cell RNA-seq reveals that they are not competing technologies but rather complementary tools in the researcher's arsenal. Bulk RNA-seq remains the gold standard for cost-effective, high-sensitivity profiling of overall gene expression in large sample cohorts. In contrast, scRNA-seq is unparalleled in its ability to recover the fundamental biological information of cellular heterogeneity, identifying novel and rare cell types and states that are irretrievably lost in averaged bulk data.
For stem cell heterogeneity research, where the central questions revolve around lineage commitment, rare progenitor populations, and dynamic state transitions, the high-resolution view provided by scRNA-seq is indispensable. The optimal strategy, as demonstrated in modern studies, is an integrated one: using bulk sequencing for powerful cohort-level screening and validation, and applying single-cell sequencing to dissect the underlying cellular architecture and discover the precise drivers of biological phenomena.
{direct performance comparison article content end}
In stem cell research, the transition from single-cell RNA sequencing (scRNA-seq) to bulk RNA-seq represents a critical validation pathway that leverages the unique strengths of each technology. While scRNA-seq excels at identifying rare cell populations and unraveling cellular heterogeneity at unprecedented resolution, bulk RNA-seq provides a robust, cost-effective platform for validating these findings across larger patient cohorts. This validation loop has become particularly valuable in stem cell biology, where rare subpopulations like cancer stem cells drive critical disease processes but require confirmation in expanded sample sizes to establish clinical relevance. The integration of these complementary approaches enables researchers to move from discovery to validation, building a more complete and reliable understanding of stem cell dynamics.
Table 1: Key Technical Differences Between scRNA-seq and Bulk RNA-seq
| Feature | scRNA-seq | Bulk RNA-seq |
|---|---|---|
| Resolution | Individual cell level [1] | Population average [5] [1] |
| Cost per Sample | Higher (~10x bulk) [2] | Lower [2] |
| Cell Heterogeneity Detection | High (identifies rare cell types) [1] [3] | Limited [5] [2] |
| Gene Detection Sensitivity | Lower (median ~3,361 genes in PBMCs) [2] | Higher (median ~13,378 genes in PBMCs) [2] |
| Sample Input Requirement | Lower (can work with single cells) [2] | Higher (requires cell population) [2] |
| Data Complexity | High (sparse, noisy data) [1] [2] | Lower (averaged expression) [1] [2] |
| Ideal Application | Discovery of novel cell types/states [1] [3] | Validation across large cohorts [1] |
The Validation Workflow: From Single-Cell Discovery to Bulk Validation
Phase 1: scRNA-seq for Initial Discovery of Stem Cell Heterogeneity
The validation loop begins with scRNA-seq analysis of limited samples to unravel stem cell heterogeneity at single-cell resolution. This technology has proven particularly powerful for identifying rare stem cell populations that would be masked in bulk analyses. For instance, in a study of mouse embryonic stem cells, scRNA-seq identified a rare subpopulation (3 cells in the dataset) highly expressing Zscan4 genes, revealing cells with greater differentiation potential than previously recognized [2]. Similarly, in colorectal cancer research, scRNA-seq successfully distinguished cancer stem cells (CSCs) from other cell types in the tumor microenvironment using specific marker genes (TFF3, AGR2, KRT8, KRT18) [62].
The experimental workflow for this discovery phase typically involves:
Single-cell Suspension Preparation: Tissue dissociation into viable single-cell suspensions using enzymatic or mechanical methods [1]
Cell Partitioning and Barcoding: Using platforms like 10X Genomics Chromium to isolate individual cells into micro-reaction vessels (GEMs) where each cell's RNA is tagged with a unique barcode [3]
Library Preparation and Sequencing: Converting RNA to cDNA and preparing sequencing libraries with unique molecular identifiers (UMIs) to track individual transcripts [3] [13]
Bioinformatic Analysis: Clustering cells into subpopulations using dimensionality reduction techniques (t-SNE, UMAP) and identifying marker genes for each cluster [13]
Phase 2: Transition to Bulk RNA-seq for Cohort Validation
Once candidate stem cell populations or signatures are identified through scRNA-seq, the workflow transitions to bulk RNA-seq for validation across larger cohorts. This approach was effectively demonstrated in a pan-cancer study that developed a stemness signature (Stem.Sig) using scRNA-seq data from 34 datasets encompassing 345 patients and 663,760 cells across 17 cancer types [58]. The signature was subsequently validated using bulk RNA-seq data from The Cancer Genome Atlas (TCGA) pan-cancer cohort comprising 10,154 patients across 30 cancer types [58].
The bulk RNA-seq validation methodology includes:
RNA Extraction and Quality Control: Isolating total RNA from tissue samples and assessing quality using RNA Integrity Number (RIN), with values over six considered acceptable for sequencing [5]
Library Preparation: Options include rRNA depletion for comprehensive transcriptome coverage or poly(A) enrichment for protein-coding transcripts [5]
Sequencing and Data Analysis: Typically using short-read sequencing (e.g., Illumina) with <1% error rate for accurate quantification [5]
Case Studies: Successful Applications of the Validation Loop
Cancer Stem Cell Research in Colorectal Cancer
A 2024 study exemplifies the validation loop approach in colorectal cancer stem cell (CRCSC) research [62]. Researchers first used scRNA-seq to identify CRCSCs in the tumor microenvironment and analyze their properties at single-cell resolution. This initial discovery phase revealed 13 distinct cell types within colorectal cancer samples, including the crucial CRCSC population. The intercellular communication between CRCSCs and other cell types was analyzed, showing that CRCSCs primarily coordinate biological functions with cancer cells and immune cells (macrophages, B cells, and CD8+ T cells).
Following this discovery phase, the researchers developed a prognostic risk model based on CRCSC-related genes using bulk RNA-seq data from TCGA and GEO databases. They identified 1,158 differentially expressed genes associated with CRCSCs from the scRNA-seq data, then refined this to 20 genes with prognostic diagnostic capability. Using Lasso-Cox regression analysis, they ultimately selected 16 genes (including CISD2, RNH1, DCBLD2, and RPS17) to construct a risk model validated through bulk RNA-seq on larger cohorts [62].
Stemness Signature Predicting Immunotherapy Response
Another compelling application comes from cancer immunotherapy research, where scRNA-seq analysis of patient samples revealed that cancer stemness significantly correlates with immune checkpoint inhibitor (ICI) resistance in melanoma and basal cell carcinoma [58]. Researchers developed a stemness signature (Stem.Sig) through integrative analysis of 34 scRNA-seq datasets, then validated its predictive value using bulk RNA-seq data from 10 ICI cohorts comprising 921 patients across 5 cancer types [58].
The bulk RNA-seq validation confirmed that Stem.Sig effectively predicted ICI response with an AUC of 0.71 in both validation and testing sets, outperforming previous well-established signatures. Furthermore, the bulk analysis revealed significant negative associations between Stem.Sig and anti-tumor immunity, while positive correlations were detected with intra-tumoral heterogeneity and total mutational burden [58].
Experimental Design and Methodologies
scRNA-seq Experimental Protocol
Sample Preparation for scRNA-seq:
- Generate viable single-cell suspensions through enzymatic/mechanical dissociation [1]
- Perform cell counting and quality control to ensure appropriate concentration and viability [1]
- For stem cell populations, optional FACS enrichment can be used for cell types of interest [1]
Single-Cell Partitioning (10X Genomics Workflow):
- Load single-cell suspension onto Chromium X series instrument [1] [3]
- Isolate single cells into GEMs (Gel Beads-in-emulsion) [3]
- Dissolve Gel Beads to release barcoded oligos and lyse cells [3]
- Capture RNA with cell-specific barcodes [3]
Library Construction and Sequencing:
- Create barcoded sequencing libraries [1]
- Sequence libraries appropriate for the platform (e.g., Illumina) [5]
Bulk RNA-seq Validation Protocol
RNA Extraction and Quality Control:
- Extract total RNA using standardized methods (e.g., TRIzol) [11]
- Assess RNA quality using RIN value (aim for >6) [5]
- Consider RNA stability, especially for biobank samples [5]
Library Preparation Options:
- rRNA Depletion: For comprehensive transcriptome coverage including non-coding RNAs [5]
- Poly(A) Enrichment: For protein-coding transcripts [5]
- Strand-Specific Protocols: To preserve strand information [5]
Sequencing and Analysis:
- Typically use paired-end sequencing for better isoform identification [5]
- Align reads to reference genome and quantify gene expression [13]
- Compare expression of candidate genes identified from scRNA-seq
The Scientist's Toolkit: Essential Research Reagents and Solutions
Table 2: Key Research Reagent Solutions for scRNA-seq and Bulk RNA-seq Studies
| Reagent/Solution | Function | Application Context |
|---|---|---|
| 10X Genomics Chromium System | Single-cell partitioning and barcoding | scRNA-seq discovery phase [1] [3] |
| UltraCULTURE Serum-free Medium | MSC culture and expansion | Stem cell maintenance pre-sequencing [6] |
| TrypLE Select | Gentle cell dissociation | Creating single-cell suspensions [6] |
| DermaCult Keratinocyte Expansion Medium | Epithelial stem cell culture | Nail stem cell studies [11] |
| TRIzol Reagent | RNA extraction and purification | Bulk RNA isolation [11] [6] |
| Actinomycin D | Transcription inhibition | Preventing artifactual gene expression during processing (Act-seq) [13] |
| Drop-seq/InDrop Reagents | Alternative droplet-based scRNA-seq | Lower-cost scRNA-seq options [13] |
Data Integration and Analytical Approaches
Bridging Single-Cell and Bulk Sequencing Data
The integration of scRNA-seq and bulk RNA-seq data requires specialized computational approaches to account for their fundamental differences. Deconvolution algorithms can leverage scRNA-seq data to estimate cell type proportions from bulk RNA-seq data, enabling researchers to determine whether signatures identified in rare cell populations remain significant when analyzed in bulk data from larger cohorts [58] [62].
A key consideration is managing the technical differences between the data types. While scRNA-seq data is typically sparse and noisy with many zero counts due to dropout events, bulk RNA-seq provides more comprehensive gene detection but loses cellular resolution [2]. Successful integration approaches include:
Signature Scoring: Using gene expression signatures derived from scRNA-seq to score bulk RNA-seq samples [58]
Cell-Type Deconvolution: Estimating cell type abundances in bulk data using single-cell derived references [1]
Differential Expression Validation: Confirming candidate genes identified through scRNA-seq in larger bulk cohorts [62]
The validation loop integrating scRNA-seq and bulk RNA-seq represents a powerful framework for advancing stem cell research. By leveraging scRNA-seq's unparalleled resolution to discover novel stem cell populations and signatures, then validating these findings using bulk RNA-seq across expanded cohorts, researchers can build more robust and clinically relevant models of stem cell biology. This approach maximizes the strengths of each technology while mitigating their individual limitations, creating a more complete understanding of stem cell heterogeneity and its functional implications. As both technologies continue to evolve, their strategic integration will remain essential for translating single-cell discoveries into validated biological insights with potential clinical applications.
In the field of stem cell biology, understanding cellular heterogeneity is not just a challenge—it is the fundamental key to unlocking the mechanisms of development, disease, and regenerative potential. Traditional bulk RNA sequencing (bulk RNA-seq) has provided valuable insights by measuring the average gene expression across thousands to millions of cells in a sample [3]. However, this approach obscures the very diversity that defines stem cell populations, where rare progenitor states, transitional phases, and distinct lineage commitments coexist. The advent of single-cell RNA sequencing (scRNA-seq) has revolutionized our capacity to observe this complexity, allowing researchers to profile gene expression in individual cells, thus identifying novel subpopulations and revealing continuous transitional states [63].
Despite its transformative power, scRNA-seq presents its own set of limitations, including technical artifacts like dropout events and higher costs per cell [1] [64]. Consequently, the most robust experimental designs no longer treat these technologies as mutually exclusive but integrate them into a complementary workflow. This guide details a structured pipeline where scRNA-seq drives initial discovery of cellular heterogeneity and novel subpopulations, and bulk RNA-seq enables validation of these findings across larger sample cohorts. We objectively compare the performance of these methodologies within the context of stem cell research, providing a practical framework for researchers aiming to leverage the strengths of both approaches.
Technical Face-Off: Bulk RNA-seq vs. Single-Cell RNA-seq
The choice between bulk and single-cell RNA-seq is foundational to experimental design. The table below provides a direct comparison of their core characteristics.
Table 1: Fundamental Comparison of Bulk and Single-Cell RNA-Seq
| Feature | Bulk RNA-Seq | Single-Cell RNA-Seq |
|---|---|---|
| Resolution | Population-average [1] | Single-cell level [1] |
| Key Strength | Detecting consistent, population-wide expression changes; cost-effective for large cohorts [1] | Resolving cellular heterogeneity, identifying rare cell types, and discovering novel cell states [1] [63] |
| Primary Limitation | Masks cellular heterogeneity; cannot identify rare cell populations [1] | Higher per-sample cost; technical noise (e.g., dropout events) [1] [64] |
| Ideal Application | Differential gene expression analysis across conditions; biomarker discovery; validating scRNA-seq-derived signatures [1] | Characterizing complex tissues, defining cellular hierarchies, and reconstructing developmental trajectories [1] [65] |
The Single-Cell Dimension: Uncovering Hidden Heterogeneity
scRNA-seq excels in situations where heterogeneity is the primary subject of inquiry. In a landmark study on human embryonic stem cells (ESCs) and feeder-free extended pluripotent stem cells (ffEPSCs), scRNA-seq was able to:
- Identify distinct subpopulations within both ESC and ffEPSC cultures, which were previously considered homogeneous [7].
- Reconstruct developmental trajectories using pseudotime analysis, mapping the transition process from a "primed" pluripotent state (ESCs) to an "extended" pluripotent state (ffEPSCs) [7].
- Uncover critical molecular pathways and stage-specific repeat elements involved in this pluripotency transition [7].
This level of resolution is simply unattainable with bulk methods, as the averaging effect would merge these distinct subpopulations and transitional states into a single, non-representative expression profile.
Integrated Workflow: From Single-Cell Discovery to Bulk Validation
The synergistic workflow combining scRNA-seq and bulk RNA-seq maximizes both discovery power and statistical rigor. The following diagram outlines the key stages of this integrated approach.
Stage 1: Single-Cell Discovery and Hypothesis Generation
The workflow begins with a deep, unbiased exploration of the stem cell population using scRNA-seq.
Experimental Protocol: scRNA-seq (10x Genomics Chromium Platform)
- Sample Preparation: Generate a viable single-cell suspension from stem cell cultures or tissues. Cell viability is critical [1] [63].
- Cell Partitioning: Use a microfluidic chip (e.g., Chromium X series) to isolate single cells into nanoliter-scale gel bead-in-emulsions (GEMs). Each GEM contains a single cell, a gel bead with cell barcodes, and reaction reagents [1] [3].
- Reverse Transcription & Barcoding: Within each GEM, cells are lysed, and mRNA is reverse-transcribed. The cDNA from each cell is tagged with a unique cell barcode (to identify its cell of origin) and a unique molecular identifier (UMI) (to quantify individual mRNA molecules accurately) [1] [65].
- Library Prep and Sequencing: Barcoded cDNA is pooled, amplified, and prepared into a sequencing library. High-throughput sequencing is performed, after which cell barcodes and UMIs are used to reconstruct a digital gene expression matrix for thousands of individual cells [1] [65].
Downstream Analysis & Discovery:
- Clustering and Cell Type Identification: Dimensionality reduction (PCA, UMAP) and clustering algorithms (e.g., in Seurat) are applied to group cells based on gene expression similarity. This reveals distinct subpopulations and rare cell states [7] [66].
- Differential Expression: Tools like
FindMarkersin Seurat identify genes that are significantly upregulated in specific clusters, defining potential marker genes for validation [7]. - Trajectory Inference: Algorithms like Monocle infer developmental trajectories and order cells along a pseudotime continuum, revealing dynamic gene expression programs during state transitions [7] [67].
Stage 2: Bulk RNA-seq Validation and Quantification
Findings from scRNA-seq are then tested for robustness and generalizability using bulk RNA-seq.
Experimental Protocol: Bulk RNA-seq
- Sample Grouping: Design experiments with biological replicates of control and experimental groups (e.g., different stem cell lines, treatment conditions).
- RNA Extraction & Library Prep: Extract total RNA from pools of cells for each sample. Libraries can be prepared with poly-A selection to enrich for mRNA or via rRNA depletion for whole transcriptome analysis [3].
- Sequencing & Analysis: Sequence the libraries. Bioinformatic analysis is then performed to quantify gene expression levels across samples and test for differential expression of the candidate markers identified in the scRNA-seq phase [1].
Leveraging Computational Deconvolution: A powerful technique that bridges the two methods is deconvolution. The cell-type-specific signatures discovered via scRNA-seq can be used as a reference to estimate the abundance of different cell subpopulations within bulk RNA-seq data from complex samples. Algorithms such as CIBERSORT and xCell can be applied for this purpose, allowing researchers to "digitally dissect" bulk data using a single-cell derived map [10].
Case Study: Dissecting Pluripotency Heterogeneity
A 2025 study on human pluripotent stem cells provides a compelling real-world application of this integrated workflow [7].
Discovery with scRNA-seq:
- Researchers performed high-resolution scRNA-seq on human ESCs and ffEPSCs using the Smart-seq2 protocol.
- They uncovered distinct subpopulations within both cell types and mapped the transition process from the primed state (ESC) to the extended pluripotent state (ffEPSC).
- Differential expression analysis revealed critical molecular pathways and repeat elements associated with the extended pluripotent state.
Validation with Bulk RNA-seq and Computational Tools:
- The study used gene set enrichment analysis (GSEA) on bulk transcriptomic data to confirm that the gene signatures defining the ffEPSC state, discovered at single-cell resolution, were consistently and significantly enriched in bulk samples of ffEPSCs compared to ESCs [7].
- This cross-platform validation confirmed that the novel cell states identified were not technical artifacts of the scRNA-seq method but represented biologically robust and reproducible populations.
The Scientist's Toolkit: Essential Research Reagents and Solutions
Successful execution of an integrated transcriptomics workflow relies on a suite of specialized reagents and computational tools.
Table 2: Key Reagents and Solutions for Integrated RNA-seq Analysis
| Item | Function | Example Products/Platforms |
|---|---|---|
| Single-Cell Partitioning Platform | Isolates single cells into nanoliter reactions for barcoding | 10x Genomics Chromium Controller, Bio-Rad ddSEQ [1] [3] |
| Single-Cell 3' or 5' Gene Expression Kit | Provides reagents for cell lysis, RT, barcoding, and library prep for scRNA-seq | 10x Genomics Single Cell Gene Expression Kits [1] |
| Bulk RNA Library Prep Kit | Prepares sequencing libraries from total RNA extracted from cell populations | Illumina Stranded mRNA Prep, Kapa HyperPrep Kit [7] |
| Cell Dissociation Reagent | Generates high-viability single-cell suspensions from cultures or tissues | TrypLE, Accutase [7] |
| Analysis Software Suite | Processes sequencing data, performs clustering, differential expression, and trajectory analysis | Seurat, Monocle, Cell Ranger [7] [65] |
| Deconvolution Algorithm | Estimates cell-type proportions in bulk data using scRNA-seq signatures | CIBERSORT, xCell, EPIC [10] |
The comparative analysis presented in this guide demonstrates that bulk and single-cell RNA-seq are not competing technologies but complementary pillars of a modern genomics strategy. The integrated workflow from single-cell discovery to bulk validation provides a powerful, rigorous framework for stem cell research. It leverages the high-resolution, hypothesis-generating power of scRNA-seq to uncover the true complexity of pluripotent states, while employing the statistical strength and economy of bulk RNA-seq to validate these discoveries and assess their generalizability across larger cohorts. By adopting this synergistic approach, researchers can accelerate the translation of stem cell biology from foundational insights to clinical applications.
For researchers studying stem cell biology, choosing between single-cell RNA sequencing (scRNA-seq) and bulk RNA sequencing is a critical first step that directly shapes the depth and scope of biological insights achievable. This guide provides a structured decision framework to help you select the optimal transcriptomic method for your specific research questions and resource constraints.
Stem cell populations are fundamentally heterogeneous, consisting of diverse subtypes, transitional states, and rare progenitor cells that drive development and regeneration. The transcriptomic method you choose determines your ability to resolve this cellular complexity.
Bulk RNA-seq provides a population-averaged gene expression profile from a tissue sample containing thousands to millions of cells, yielding a composite transcriptomic signal across all cell types present [8] [1]. This averaging effect masks cell-to-cell variation and can obscure rare but biologically critical subpopulations.
Single-cell RNA-seq enables resolution at the individual cell level, allowing researchers to characterize cellular heterogeneity, identify rare cell types, reconstruct developmental trajectories, and discover novel cell states [63] [18]. This high-resolution view comes with increased computational complexity and cost considerations.
Table 1: Fundamental Technological Differences Between Bulk and Single-Cell RNA Sequencing
| Feature | Bulk RNA-Seq | Single-Cell RNA-Seq |
|---|---|---|
| Resolution | Population average | Individual cell level |
| Cell Heterogeneity Detection | Limited | High [2] |
| Rare Cell Type Identification | Masked by averaging | Possible down to rare subpopulations [2] |
| Cost per Sample | Lower (~$300/sample) | Higher (~$500-$2000/sample) [2] |
| Data Complexity | Lower, more established analysis | Higher, requires specialized computational methods [2] |
| Gene Detection Sensitivity | Higher per sample | Lower per cell but reveals cell-specific expression [2] |
| Ideal Sample Input | Higher RNA amounts | Lower cell numbers, minimal input [2] |
Experimental Workflows: From Cell to Data
Understanding the fundamental methodological differences is crucial for selecting the appropriate protocol for your stem cell research.
Bulk RNA-Seq Workflow
The bulk RNA-seq process begins with RNA extraction from thousands to millions of cells, destroying cellular context to create a homogeneous lysate. Following extraction, mRNA is enriched, reverse-transcribed into cDNA, amplified via PCR, and prepared into sequencing libraries. This workflow yields an averaged transcriptome profile where expression signals are aggregated across all input cells, masking individual cellular contributions [1].
Single-Cell RNA-Seq Workflow
In contrast, scRNA-seq workflows begin with creating viable single-cell suspensions, a critical step that requires careful optimization to preserve cell viability and transcriptome integrity. Individual cells are then partitioned using microfluidic devices (e.g., 10x Genomics Chromium) or cell sorting techniques. Within these partitions, cells are lysed and mRNA molecules are barcoded with cell-specific identifiers (cell barcodes) and unique molecular identifiers (UMIs) to track individual transcripts. After reverse transcription and amplification, the barcoded cDNA from all cells is pooled for library preparation and sequencing [63] [68].
Key Technical Considerations for Stem Cells
Stem cells present unique challenges for RNA-seq studies. Their often-limited availability makes scRNA-seq particularly valuable, while their sensitivity to environmental stresses requires optimized protocols. Sample preparation is especially critical for scRNA-seq—viable single-cell suspensions must be obtained with minimal stress to avoid altering transcriptional states [63]. For particularly sensitive or rare stem cell populations, single-nucleus RNA-seq (snRNA-seq) provides an alternative that works with frozen samples and minimizes dissociation artifacts [68] [19].
Data Output Comparisons: From Sequences to Biological Insights
The data structures and analytical approaches differ significantly between bulk and single-cell RNA-seq, requiring different computational skill sets and resources.
Bulk RNA-Seq Data Analysis
Bulk sequencing data analysis follows established pipelines beginning with quality control (FastQC), read alignment (STAR, TopHat2), and expression quantification (featureCounts, HTSeq) [8]. The primary output is a genes-by-samples matrix containing continuous expression values. Downstream analysis typically includes differential expression testing (DESeq2, edgeR), pathway enrichment analysis (GSEA), and co-expression network construction. These methods are well-established with extensive documentation and community support.
Single-Cell RNA-Seq Data Analysis
ScRNA-seq data analysis involves more complex multi-step processing of the raw sequencing data to generate a cells-by-genes count matrix with cell barcodes and UMIs. Quality control must address cell-level metrics—removing low-quality cells, doublets, and empty droplets. Normalization and scaling must account for technical variation in sequencing depth between cells. Dimensionality reduction (PCA, UMAP) and clustering (Louvain, Leiden) enable cell population identification. Additional specialized analyses include trajectory inference (pseudotime ordering), differential abundance testing, and reference mapping [68].
Table 2: Data Output and Analysis Comparison
| Analysis Aspect | Bulk RNA-Seq | Single-Cell RNA-Seq |
|---|---|---|
| Primary Data Structure | Genes x samples matrix | Cells x genes matrix with UMIs |
| Key QC Metrics | Sequence quality, alignment rates | Cells: genes detected, mitochondrial %, doublets |
| Differential Expression | DESeq2, edgeR, limma | Wilcoxon rank-sum test, MAST, DESeq2 |
| Dimensionality Reduction | PCA, MDS | PCA, t-SNE, UMAP |
| Unique Analysis Types | Pathway enrichment, WGCNA | Clustering, trajectory inference, cell typing |
| Technical Variation | Batch effects, library size | Amplification bias, dropout events, batch effects |
| Typical Dataset Size | Megabytes to gigabytes | Gigabytes to terabytes |
Decision Matrix: Choosing Your Method
Select the optimal transcriptomic approach by evaluating your research questions and experimental constraints against these key criteria.
Research Question Assessment
Choose scRNA-seq when your research aims to:
- Characterize cellular heterogeneity within stem cell populations
- Identify novel or rare subpopulations (e.g., primordial stem cells)
- Reconstruct differentiation trajectories or lineage relationships
- Understand transcriptional stochasticity or burst kinetics
- Map developmental processes or transitional states [63] [18]
Choose bulk RNA-seq when your research aims to:
- Compare overall transcriptomic profiles between conditions (e.g., treated vs. control)
- Detect robust, population-level expression signatures
- Analyze alternative splicing or isoform usage across the population
- Conduct large-scale cohort studies with many samples
- Establish baseline transcriptomic profiles for new cell lines [1] [31]
Resource Evaluation Framework
Budget Considerations:
- Bulk RNA-seq costs approximately $300 per sample, while scRNA-seq ranges from $500 to $2000 per sample [2]
- ScRNA-seq requires significant computational resources for data storage and analysis
- Consider hybrid approaches: use bulk RNA-seq for large-scale screening followed by targeted scRNA-seq for deep investigation [31]
Sample Constraints:
- Bulk RNA-seq requires sufficient biological material for RNA extraction
- ScRNA-seq works with limited cell numbers but requires viable single-cell suspensions
- For difficult-to-dissociate tissues or frozen samples, consider single-nucleus RNA-seq [68]
Technical Expertise:
- Bulk RNA-seq analysis uses established pipelines with extensive community support
- ScRNA-seq analysis requires specialized computational skills for complex multi-step processing
- Commercial platforms (10x Genomics, Illumina) offer more streamlined scRNA-seq workflows [69]
Research Reagent Solutions and Experimental Materials
Successful transcriptomic studies require appropriate selection of reagents and platforms tailored to your chosen method.
Table 3: Essential Research Reagents and Platforms
| Category | Specific Products/Platforms | Key Features and Applications |
|---|---|---|
| High-Throughput scRNA-seq | 10x Genomics Chromium | Droplet-based partitioning, thousands to millions of cells, 3' or 5' counting [1] |
| Full-Length scRNA-seq | Smart-Seq2, Fluidigm C1 | Full-length transcript coverage, isoform analysis, superior for lowly expressed genes [68] |
| Bulk RNA-seq Library Prep | Illumina Nextera, TruSeq | Population-level transcriptomics, differential expression, splicing analysis [8] |
| Single-Cell Partitioning | Droplet-based (inDrop, Drop-Seq), Plate-based | Varying throughput, cost, and transcript coverage options [68] |
| Quality Control | FastQC (bulk), Cell Ranger (scRNA-seq) | Sequence quality assessment, cell filtering, count matrix generation [8] |
| Data Analysis | Partek Flow, Seurat, Scanpy | User-friendly interfaces for processing scRNA-seq data [69] |
The choice between bulk and single-cell RNA sequencing is not merely technical but strategic, fundamentally shaping the biological insights you can derive from your stem cell research. By applying this decision matrix—systematically evaluating your research questions, resource constraints, and sample characteristics—you can select the most appropriate transcriptomic method to advance your scientific objectives. As these technologies continue to evolve, emerging hybrid approaches that combine both methods offer powerful strategies to leverage the strengths of each approach, providing both breadth and depth of understanding in stem cell biology.
The quest to understand cellular heterogeneity, particularly in stem cell research and oncology, has driven the evolution of gene expression profiling technologies. Bulk RNA sequencing (bulk RNA-seq) long served as the workhorse for transcriptomic studies, providing a population-averaged view of gene expression [70]. While invaluable for identifying overall expression differences between conditions, this approach inherently masks cellular diversity, making it poorly suited for dissecting complex ecosystems like stem cell niches or tumor microenvironments where rare cell populations often drive biological outcomes [1]. The emergence of single-cell RNA sequencing (scRNA-seq) revolutionized the field by enabling researchers to profile gene expression at individual cell resolution, revealing previously obscured cell types, states, and transitions [70]. However, scRNA-seq requires tissue dissociation, sacrificing crucial spatial context that governs cellular function and interaction.
Spatial transcriptomics (ST) now bridges this critical gap by preserving anatomical information while measuring genome-wide expression, completing the technological triad that defines modern transcriptomics [71]. This article provides a comprehensive comparison of these complementary technologies, focusing on their application to stem cell heterogeneity research, with specific benchmarking data on current spatial platforms to guide technology selection for future-proof research programs.
Technology Comparison: Bulk, Single-Cell, and Spatial Transcriptomics
Fundamental Differences and Complementary Strengths
The choice between bulk, single-cell, and spatial transcriptomics depends heavily on research objectives, as each technology offers distinct advantages and limitations for probing stem cell heterogeneity:
Bulk RNA-seq analyzes RNA from entire tissue samples or cell populations, yielding an averaged expression profile. It remains cost-effective for large cohort studies and differential expression analysis between conditions but cannot resolve cellular heterogeneity [1] [70]. For stem cell research, this means critical differences between stem cell states and transitional progenitors are averaged beyond recognition.
Single-cell RNA-seq isolates and sequences RNA from individual cells, enabling identification of rare cell types, reconstruction of developmental trajectories, and characterization of heterogeneous cell states within seemingly uniform populations [1]. This has proven particularly valuable for identifying and characterizing cancer stem cells (CSCs) and understanding their role in therapy resistance and tumor progression [54]. However, tissue dissociation eliminates spatial context, making it impossible to discern how cellular positioning influences stem cell function and fate decisions.
Spatial transcriptomics measures gene expression profiles in situ, preserving the architectural relationships between cells. ST technologies uniquely enable researchers to map stem cell niches, visualize gradient-forming morphogens, and investigate location-dependent cell signaling [71]. This spatial dimension is particularly crucial in skeletal muscle regeneration research, where the coordinated interplay between muscle stem cells (MuSCs), inflammatory cells, and resident cells occurs in precise spatial patterns that dictate regenerative outcomes [71].
Table 1: Comparative Analysis of Transcriptomics Technologies
| Feature | Bulk RNA-seq | Single-cell RNA-seq | Spatial Transcriptomics |
|---|---|---|---|
| Resolution | Population average | Single-cell | Single-cell or near-single-cell |
| Spatial Context | Lost | Lost | Preserved |
| Detection of Rare Cell Types | Limited | Excellent | Good to Excellent |
| Cost per Sample | Low | High | High |
| Data Complexity | Moderate | High | Very High |
| Ideal for Stem Cell Applications | Differential expression in homogeneous populations | Identifying stem cell subtypes, trajectory inference | Mapping stem cell niches, spatial localization of progenitors |
| Throughput | High | Moderate | Moderate |
Integrated Approaches for Comprehensive Understanding
Increasingly, the most powerful insights come from integrating multiple transcriptomic approaches within the same study. For example, in glioblastoma research, combining scRNA-seq with bulk RNA sequencing has identified survival-associated cell subpopulations and super-enhancer-driven regulatory networks that robustly predict patient survival and immunotherapy response [55]. Similarly, in esophageal cancer (ESCA) research, integrated analysis has enabled the construction of prognostic models based on tumor stem cell markers identified through single-cell profiling and validated in bulk datasets [54].
This integrated multi-omics approach provides a translational framework for targeting oncogenic hubs and modulating microenvironment interactions – an approach that is particularly relevant for stem cell research aiming to understand how niche interactions govern self-renewal versus differentiation decisions.
Benchmarking Spatial Transcriptomics Platforms
Performance Metrics for FFPE Tissues
As spatial technologies mature, systematic benchmarking becomes essential for platform selection. A comprehensive 2025 study compared three commercial imaging-based spatial transcriptomics (iST) platforms – 10X Xenium, Vizgen MERSCOPE, and Nanostring CosMx – on serial sections from tissue microarrays (TMAs) containing 17 tumor and 16 normal tissue types in FFPE format [72]. This comparison is particularly relevant for clinical and biobank samples, as FFPE represents over 90% of clinical pathology specimens [72].
Table 2: Benchmarking Performance of Commercial iST Platforms on FFPE Tissues
| Performance Metric | 10X Xenium | Nanostring CosMx | Vizgen MERSCOPE |
|---|---|---|---|
| Relative Transcript Counts per Gene | Highest | High | Lower |
| Concordance with scRNA-seq | High | High | Not Specified |
| Cell Sub-clustering Capability | Slightly more clusters | Slightly more clusters | Fewer clusters |
| False Discovery Rates | Varies | Varies | Varies |
| Cell Segmentation Error Frequency | Varies | Varies | Varies |
| Key Differentiating Chemistry | Padlock probes with rolling circle amplification | Low number of probes with branch chain hybridization | Direct probe hybridization with transcript tiling |
The study found that all three platforms can perform spatially resolved cell typing with varying capabilities, with Xenium and CosMx detecting slightly more clusters than MERSCOPE, though with different error profiles [72]. When designing studies with precious biobanked samples, these performance characteristics should be carefully considered against research goals, panel requirements, and available budget.
Methodological Considerations for Spatial Biology
Spatial transcriptomics technologies broadly fall into two categories: imaging-based approaches and sequencing-based methods [71]. Imaging-based techniques like those benchmarked above include:
- MERFISH (employed by Vizgen MERSCOPE): Uses combinatorial barcoding to label transcripts before detection [71]
- CosMx (NanoString): Employs a strategy similar to MERFISH with an optical signature approach, using iterative hybridization to generate unique gene-specific signatures [71]
- Xenium (10X Genomics): Combines features from both in situ sequencing and hybridization, using padlock probes with rolling circle amplification [71]
Each method employs different probe designs, signal amplification strategies, and computational processing methods, leading to variations in sensitivity, specificity, and multiplexing capability [72]. Understanding these underlying technological differences helps researchers select the most appropriate platform for their specific stem cell research applications.
Experimental Design and Power Analysis
Statistical Considerations for Robust Study Design
When incorporating transcriptomic technologies into research programs, careful experimental design is essential for generating statistically meaningful results. Power analysis – the examination of the relationship between statistical power and parameters that influence it – should be conducted before initiating studies to determine appropriate sample sizes, cell numbers, and sequencing depths [73].
For bulk RNA-seq experiments, power is primarily determined by the number of biological replicates, with sequencing depth playing a secondary role [73]. In contrast, scRNA-seq experiments must consider both the number of individuals and the number of cells per population, with different research objectives (cell type identification, differential expression, trajectory inference) having distinct statistical power requirements [73].
Notably, as of 2023, no dedicated power analysis tools existed specifically for high-throughput spatial transcriptomics, though factors such as tissue region complexity, cellular heterogeneity, and expression dynamic range all influence statistical power in spatial studies [73]. Researchers should consult with bioinformaticians early in experimental planning to ensure appropriate design for their specific research questions.
Integrated Experimental Workflow
The most comprehensive approach to studying stem cell heterogeneity involves integrating multiple transcriptomic technologies. The following workflow diagram illustrates how bulk, single-cell, and spatial methods can be combined in a complementary fashion:
The Scientist's Toolkit: Essential Research Solutions
Key Platforms and Reagents
Implementing a multi-omics research program requires access to appropriate technological platforms and analytical tools. The following table outlines essential solutions for conducting comprehensive stem cell heterogeneity studies:
Table 3: Essential Research Solutions for Multi-omics Stem Cell Research
| Tool Category | Example Solutions | Primary Function | Application in Stem Cell Research |
|---|---|---|---|
| Single-cell Platform | 10X Genomics Chromium | Partitions single cells for barcoding | Cell type identification, trajectory analysis |
| Spatial Platform | 10X Xenium, Nanostring CosMx, Vizgen MERSCOPE | In situ gene expression profiling | Stem cell niche mapping, spatial localization |
| Bulk Analysis | Illumina HiSeq/MiSeq | Population-level transcriptomics | Differential expression, cohort studies |
| Analysis Software | Seurat, SCENIC, CellChat | scRNA-seq data analysis | Cell clustering, regulatory networks, communication |
| Validation Tools | RNAscope, smFISH | Spatial validation of targets | Confirmation of stem cell marker expression |
Analytical Frameworks for Data Integration
Beyond wet-lab technologies, comprehensive stem cell heterogeneity studies require sophisticated analytical frameworks:
- Cell-cell communication analysis: Tools like CellChat systematically map ligand-receptor interactions to identify key signaling pathways active in stem cell niches [55]
- Regulatory network inference: Approaches like SCENIC (Single-Cell Regulatory Network Inference and Clustering) reconstruct gene regulatory networks from scRNA-seq data, identifying key transcription factors maintaining stem cell states [55]
- Spatial mapping integration: Computational methods that integrate scRNA-seq with spatial data to impute expression across tissue sections, predicting the spatial distribution of identified cell types [71]
- Stemness quantification: Algorithms like CytoTRACE predict cellular stemness at single-cell resolution using gene expression data, enabling identification of stem-like cells within heterogeneous populations [54]
As transcriptomic technologies continue evolving at a rapid pace, future-proofing research programs requires both strategic technology selection and methodological flexibility. For stem cell heterogeneity research, no single approach provides a complete picture – rather, the integration of bulk, single-cell, and spatial methodologies delivers the most comprehensive insights. The benchmarking data presented here provides a foundation for making informed decisions about platform selection, particularly for precious samples like FFPE biobank specimens.
Moving forward, researchers should design studies with interoperability in mind, building modular workflows that can incorporate emerging technologies as they become available. The most successful research programs will be those that maintain both technological agility and biological focus, leveraging the complementary strengths of each transcriptomic approach to unravel the complex regulation of stem cell populations in development, regeneration, and disease.
Conclusion
Bulk RNA-seq and scRNA-seq are not competing but complementary technologies essential for a complete understanding of stem cell biology. Bulk sequencing remains a powerful, cost-effective tool for assessing population-wide changes, while scRNA-seq is indispensable for deconvoluting heterogeneity, discovering rare cell types, and mapping developmental trajectories. The future of stem cell research lies in the intelligent integration of these methods, where initial discoveries at single-cell resolution are validated and expanded using bulk-level power. As both technologies continue to advance in affordability and capability, their combined application will undoubtedly accelerate the translation of stem cell research into clinical diagnostics and regenerative therapies.
References
- 1. Bulk vs. single cell RNA-seq: Experimental differences and ... [https://www.10xgenomics.com/blog/bulk-vs-single-cell-RNA-seq-experimental-differences-and-advantages-of-single-cell-resolution]
- 2. Understanding Bulk and Single-Cell RNA Sequencing [https://www.cd-genomics.com/resource-bulk-rna-sequencing-vs-single-cell-rna-sequencing.html]
- 3. From bulk, single-cell to spatial RNA sequencing [https://www.nature.com/articles/s41368-021-00146-0]
- 4. Bulk RNA Sequencing versus Single-Cell RNAseq: 2 Powerful... [https://sampled.com/bulk-rna-sequencing-vs-single-cell-rna-sequencing/]
- 5. Perspectives on Bulk-Tissue RNA Sequencing and Single ... [https://pmc.ncbi.nlm.nih.gov/articles/PMC11285642/]
- 6. Single-cell RNA-seq highlights heterogeneity in human ... [https://stemcellres.biomedcentral.com/articles/10.1186/s13287-020-01660-4]
- 7. High-resolution single-cell RNA-seq data and ... [https://www.nature.com/articles/s41597-025-05024-6]
- 8. Statistical and Bioinformatics Analysis of Data from Bulk and ... [https://pmc.ncbi.nlm.nih.gov/articles/PMC7771369/]
- 9. Systematic comparison of high-throughput single-cell RNA ... [https://bmcgenomics.biomedcentral.com/articles/10.1186/s12864-020-07358-4]
- 10. Comprehensive analysis of scRNA-seq and bulk RNA- ... [https://pubmed.ncbi.nlm.nih.gov/39762897/]
- 11. Integrating scRNA-seq and bulk RNA-seq to explore the ... [https://pmc.ncbi.nlm.nih.gov/articles/PMC11181305/]
- 12. Cell-by-Cell Deconstruction of Stem Cell Niches - PMC [https://pmc.ncbi.nlm.nih.gov/articles/PMC8176558/]
- 13. Beyond bulk: A review of single cell transcriptomics ... [https://pmc.ncbi.nlm.nih.gov/articles/PMC6710112/]
- 14. Integration of single-cell and bulk RNA sequencing ... [https://pmc.ncbi.nlm.nih.gov/articles/PMC11847374/]
- 15. Optimizing single cell RNA sequencing of stem ... [https://www.frontiersin.org/journals/cell-and-developmental-biology/articles/10.3389/fcell.2025.1590889/full]
- 16. Single cell approaches define neural stem cell niches and ... [https://www.sciencedirect.com/science/article/pii/S2211124724015456]
- 17. Identification and characterization of cell niches in tissue ... [https://www.nature.com/articles/s41467-025-57029-9]
- 18. Advancements in single-cell RNA sequencing and spatial ... [https://www.frontierspartnerships.org/journals/acta-biochimica-polonica/articles/10.3389/abp.2025.13922/full]
- 19. Navigating single-cell RNA-sequencing: protocols, tools ... [https://pmc.ncbi.nlm.nih.gov/articles/PMC12085826/]
- 20. A single cell RNAseq benchmark experiment embedding “ ... [https://www.nature.com/articles/s41597-024-03002-y]
- 21. Single-Cell RNA Sequencing vs. Bulk ... [https://www.quickbiology.com/index.php/news/single-cell-rna-sequencing-vs-bulk-rna-sequencing-differences-and-applications.html]
- 22. Perspectives on Bulk-Tissue RNA Sequencing and Single ... [https://www.frontiersin.org/journals/molecular-medicine/articles/10.3389/fmmed.2022.839338/full]
- 23. [Tutorial] Bulk RNA-seq DE analysis [https://informatics.fas.harvard.edu/resources/tutorials/differential-expression-analysis/]
- 24. A meta-analysis of bulk RNA-seq datasets identifies ... [https://www.nature.com/articles/s41598-024-75431-z]
- 25. Evaluation of RNA-seq Cohort Consistency for Biomarker ... [https://bostongene.com/news-and-publications/publications/evaluation-of-rna-seq-cohort-consistency-for-biomarker-expression-profiling-using-rank-and-signature-based-metrics]
- 26. A systematic benchmark of Nanopore long-read RNA ... [https://www.nature.com/articles/s41592-025-02623-4]
- 27. Single-cell Sequencing in the Field of Stem Cells - PMC [https://pmc.ncbi.nlm.nih.gov/articles/PMC7770636/]
- 28. Advances in single-cell RNA sequencing and its applications ... [https://jhoonline.biomedcentral.com/articles/10.1186/s13045-023-01494-6]
- 29. Overview of Single- Cell Sequencing: Applications... - CD Genomics RNA [https://www.cd-genomics.com/resource-overview-single-cell-rna-sequencing.html]
- 30. Transcriptome-Powered Pluripotent Stem Cell ... [https://pmc.ncbi.nlm.nih.gov/articles/PMC10217280/]
- 31. Should I Choose Single Cell Sequencing or Bulk ... [https://singleron.bio/should-i-choose-single-cell-sequencing-or-bulk-sequencing/]
- 32. Integration of scRNA - Seq and Bulk - RNA to Analyse the... Seq [https://pubmed.ncbi.nlm.nih.gov/34621670/]
- 33. Cell Heterogeneity Analysis in Single-Cell RNA-seq Data ... [https://pmc.ncbi.nlm.nih.gov/articles/PMC8164540/]
- 34. Chapter 10 Trajectory Analysis | Advanced Single-Cell ... [https://bioconductor.org/books/3.14/OSCA.advanced/trajectory-analysis.html]
- 35. Monocle - trapnell lab [http://cole-trapnell-lab.github.io/monocle-release/]
- 36. A statistical framework for differential pseudotime analysis ... [https://www.nature.com/articles/s41467-023-42841-y]
- 37. Applications of single cell RNA sequencing to research ... [https://pmc.ncbi.nlm.nih.gov/articles/PMC6828599/]
- 38. Deep transfer learning of cancer drug responses by ... [https://www.nature.com/articles/s41467-022-34277-7]
- 39. From single-cell RNA-seq to drug response prediction - PMC [https://pmc.ncbi.nlm.nih.gov/articles/PMC9747355/]
- 40. A drug response prediction method for single-cell tumors ... [https://www.frontiersin.org/journals/medicine/articles/10.3389/fmed.2025.1631898/full]
- 41. Integrated analysis of single-cell RNA-seq and bulk RNA-seq ... [https://pmc.ncbi.nlm.nih.gov/articles/PMC12548165/]
- 42. Establishing single cell RNA transcriptomics: a brief guide [https://pmc.ncbi.nlm.nih.gov/articles/PMC12403637/]
- 43. Single Cell Transcriptome Sequencing: Costs and ... [https://www.scdiscoveries.com/blog/knowledge/single-cell-transcriptome-sequencing-costs-considerations/]
- 44. Single‐cell RNA sequencing technologies and applications [https://pmc.ncbi.nlm.nih.gov/articles/PMC8964935/]
- 45. Tissue dissociation for single-cell and single-nuclei RNA ... [https://pmc.ncbi.nlm.nih.gov/articles/PMC9652833/]
- 46. A single-cell and single-nucleus RNA-Seq toolbox for fresh ... [https://www.nature.com/articles/s41591-020-0844-1]
- 47. Perspectives on single-nucleus RNA sequencing in ... [https://pmc.ncbi.nlm.nih.gov/articles/PMC9846005/]
- 48. A simplified preparation method for single-nucleus RNA ... [https://www.nature.com/articles/s41598-025-97053-9]
- 49. Sample Prep for Single Cell/Nuclei RNA-seq [https://biotech.wisc.edu/sample-prep-for-single-cell-nuclei-rna-seq/]
- 50. Single-cell vs. bulk sequencing: Which one to use when? [https://lizard.bio/knowledge-hub/single-cell-vs-bulk-sequencing]
- 51. Embracing the dropouts in single-cell RNA-seq analysis [https://www.nature.com/articles/s41467-020-14976-9]
- 52. The impact of dropouts in scRNAseq dense neighborhood ... [https://pmc.ncbi.nlm.nih.gov/articles/PMC11992407/]
- 53. Droplet-based single-cell RNA sequencing: decoding cellular ... [https://translational-medicine.biomedcentral.com/articles/10.1186/s12967-025-06996-0]
- 54. Integration of single-cell and bulk RNA sequencing to ... [https://www.frontiersin.org/journals/oncology/articles/10.3389/fonc.2025.1649877/full]
- 55. Integration of Single‐Cell RNA and Bulk RNA Sequencing ... [https://pmc.ncbi.nlm.nih.gov/articles/PMC12350183/]
- 56. A Strategy to Compare Single-Cell RNA Sequencing Data ... [https://pmc.ncbi.nlm.nih.gov/articles/PMC11457179/]
- 57. Integrating single-cell RNA and T cell/B cell receptor ... [https://www.nature.com/articles/s41590-024-02059-6]
- 58. Integrated analysis of single-cell and bulk RNA sequencing ... [https://genomemedicine.biomedcentral.com/articles/10.1186/s13073-022-01050-w]
- 59. Integration of Single-Cell Analysis and Bulk RNA ... [https://www.mdpi.com/2072-6694/17/14/2411]
- 60. Integration of single-cell and bulk RNA sequencing to identify ... [https://translational-medicine.biomedcentral.com/articles/10.1186/s12967-025-06243-6]
- 61. Single-cell and bulk transcriptome profiling reveals RNA ... [https://www.nature.com/articles/s41598-025-14823-1]
- 62. Integration of single-cell sequencing and bulk RNA-seq to ... [https://www.nature.com/articles/s41598-024-62913-3]
- 63. A practical guide to single-cell RNA-sequencing for ... [https://genomemedicine.biomedcentral.com/articles/10.1186/s13073-017-0467-4]
- 64. DECENT: differential expression with capture efficiency ... [https://pmc.ncbi.nlm.nih.gov/articles/PMC6954660/]
- 65. An Introduction to the Analysis of Single-Cell RNA ... [https://pmc.ncbi.nlm.nih.gov/articles/PMC6072887/]
- 66. Benchmark and Parameter Sensitivity Analysis of Single- ... [https://www.frontiersin.org/journals/genetics/articles/10.3389/fgene.2019.01253/full]
- 67. Single cell RNA-seq identifies the origins of heterogeneity in ... [https://pmc.ncbi.nlm.nih.gov/articles/PMC6435319/]
- 68. Navigating single-cell RNA-sequencing: protocols, tools, databases, and applications | Genomics & Informatics | Full Text [https://genomicsinform.biomedcentral.com/articles/10.1186/s44342-025-00044-5]
- 69. Single-Cell & Low-Input RNA-Seq | Single-cell sequencing methods [https://www.illumina.com/techniques/sequencing/rna-sequencing/ultra-low-input-single-cell-rna-seq.html]
- 70. Bioinformatics perspectives on transcriptomics [https://www.rna-seqblog.com/bioinformatics-perspectives-on-transcriptomics-a-comprehensive-review-of-bulk-and-single-cell-rna-sequencing-analyses/]
- 71. Across the space: applications of spatial transcriptomic ... [https://pmc.ncbi.nlm.nih.gov/articles/PMC12583089/]
- 72. Systematic benchmarking of imaging spatial ... [https://www.nature.com/articles/s41467-025-64990-y]
- 73. Statistical Power Analysis for Designing Bulk, Single-Cell, and ... [https://pmc.ncbi.nlm.nih.gov/articles/PMC9952882/]