Smart-seq2 Protocol: Capturing Full-Length Stem Cell Transcriptomes for Advanced Research
This article provides a comprehensive guide to the Smart-seq2 protocol, detailing its foundational principles, optimized workflow for stem cell applications, and strategic position in the modern single-cell RNA sequencing landscape.
Smart-seq2 Protocol: Capturing Full-Length Stem Cell Transcriptomes for Advanced Research
Abstract
This article provides a comprehensive guide to the Smart-seq2 protocol, detailing its foundational principles, optimized workflow for stem cell applications, and strategic position in the modern single-cell RNA sequencing landscape. Aimed at researchers and drug development professionals, the content explores the protocol's superior sensitivity and full-length transcript coverage, which are crucial for detecting splice isoforms, allelic variants, and rare transcripts in heterogeneous stem cell populations. It further offers practical troubleshooting and optimization strategies, a comparative analysis with successor methods like Smart-seq3 and FLASH-seq, and validates its ongoing relevance in target discovery and disease modeling.
Understanding Smart-seq2: Why Full-Length Transcriptomics is a Game-Changer for Stem Cell Biology
This application note details the core principle of template-switching in conjunction with oligo(dT) priming, a mechanism foundational to full-length cDNA capture in modern transcriptomics. Framed within the context of the Smart-seq2 protocol, we explain how this combination overcomes the historical challenge of 5' end under-representation in cDNA libraries. The technical discussion is supplemented with structured quantitative data, optimized protocol methodologies, and essential reagent solutions, providing a comprehensive resource for researchers employing full-length transcriptome analysis in stem cell research and drug development.
Conventional cDNA construction methods often result in the significant under-representation of the 5' end sequences of mRNA molecules [1]. This bias poses a major technical obstacle for the accurate quantification of individual transcripts and the confident identification of novel isoforms or transcription start sites, which is critical in sensitive applications like stem cell transcriptome research. The Smart-seq2 protocol and related technologies were developed to address this precise limitation by leveraging a natural enzymatic process to ensure complete transcript coverage [1] [2].
The Core Mechanism: A Synergy of Enzymatic Activity and Oligo Design
The process of full-length cDNA capture is enabled by the unique properties of the Moloney Murine Leukemia Virus (MMLV) reverse transcriptase and strategically designed oligonucleotides.
Key Components and Their Functions
Table 1: Essential Research Reagent Solutions for Template-Switching Protocols
| Reagent / Component | Function / Role in cDNA Capture |
|---|---|
| MMLV Reverse Transcriptase | Enzyme with reverse transcriptase and terminal transferase activity; synthesizes cDNA and adds non-templated nucleotides [1] [3]. |
| Oligo(dT) Primer | A primer that binds to the poly(A) tail of mRNA to initiate reverse transcription; often includes a VN anchor to improve specificity and a universal adapter sequence for downstream amplification [4] [2]. |
| Template-Switching Oligo (TSO) | A chimeric oligonucleotide that binds the non-templated C-rich overhang; provides a universal primer-binding site for amplifying only full-length cDNAs [1] [4]. |
| Locked Nucleic Acid (LNA) | A modified nucleotide (e.g., +G) incorporated at the 3'-end of the TSO to enhance thermostability and anchoring efficiency [1] [4] [5]. |
| Betaine | An additive used in Smart-seq2 to reduce secondary structures in the RNA template, facilitating more processive reverse transcription and higher cDNA yields [5]. |
| MgCl₂ | A cofactor for reverse transcriptase; its increased concentration in Smart-seq2 optimizes enzymatic activity and template-switching efficiency [5]. |
The Step-by-Step Mechanism
The following diagram illustrates the coordinated sequence of events that enables full-length cDNA capture.
- Primer Annealing and Initiation: The process begins with an oligo(dT) primer annealing to the poly(A) tail of messenger RNA (mRNA). This primer contains a defined adapter sequence at its 5' end for subsequent PCR amplification [2].
- First-Strand cDNA Synthesis: The MMLV reverse transcriptase initiates DNA synthesis from the oligo(dT) primer, progressing along the RNA template towards its 5' end [1] [3].
- Non-Templated Nucleotide Addition: Upon reaching the 5' terminus of the RNA template, the terminal transferase activity of the MMLV RT appends a short stretch of non-templated nucleotides—typically deoxycytidines (dC)—to the 3' end of the newly synthesized cDNA strand [1] [3] [6].
- Template-Switching Oligo (TSO) Annealing: A chimeric template-switching oligo (TSO), which features several riboguanosines (rGrGrG) at its 3' end, base-pairs with the dC-overhang on the cDNA. Optimized protocols often use a locked nucleic acid (LNA) at the final position to strengthen this interaction [1] [4] [5].
- Template Switch and Synthesis Completion: The reverse transcriptase "switches" its template from the original mRNA to the annealed TSO. It then continues DNA synthesis, copying the TSO sequence and thereby appending a universal 5' adapter sequence to the cDNA [1] [3].
- Result: The resulting single-stranded cDNA product contains the complete sequence of the original mRNA transcript, flanked by known universal adapter sequences at both its 3' and 5' ends. This allows for the subsequent PCR amplification of only full-length cDNAs, using primers targeting these universal adapters [1] [2].
Optimized TSO Designs and Comparative Performance
The composition of the TSO is critical for efficiency and specificity. Research has led to several optimized designs.
Table 2: Evolution and Performance of Template-Switching Oligos (TSOs)
| TSO Type / Feature | Chemical Composition | Key Advantage / Rationale | Protocol Application |
|---|---|---|---|
| Standard DNA/RNA Chimeric | 5'-...ACATrGrGrG-3' | Original design; superior specificity for capped 5' ends [1]. | Foundational to SMART technology [1]. |
| LNA-Modified | 5'-...rGrG+G-3' (+G = LNA-G) | Enhanced thermostability for short anchoring sequence; improves binding [1] [4]. | Smart-seq2 [5]. |
| Iso-Nucleotide Modified | 5'-(iso-dC)(iso-dG)AAG...-3' | Reduces background by preventing TSO concatenation; isomers pair only with each other [1] [3]. | Modified Smart-seq2 for low-background samples [3]. |
| Smart-seq3 TSO | Includes an 11-bp tag and an 8-bp UMI | Introduces Unique Molecular Identifiers (UMIs) for digital counting and bias correction [7] [5]. | Smart-seq3 [5]. |
| FLASH-seq TSO | Simplified design, LNA replaced with riboguanosine | Reduces strand-invasion artifacts, simplifies synthesis [5]. | FLASH-seq [5]. |
Application in Smart-seq2 Protocol for Stem Cell Research
The principles above are integrated into a complete workflow. The following diagram outlines the automated high-throughput Smart-seq3 protocol, an evolution of Smart-seq2, demonstrating a real-world application.
Detailed Protocol: Reverse Transcription and Template-Switching
The following critical steps are adapted from published modified Smart-seq2 and HT Smart-seq3 protocols [4] [7].
Part I: Reverse Transcription and cDNA Amplification
Cell Lysis and Primer Annealing:
- Prepare a cell lysis master mix. For a single reaction, combine:
- 2.0 µL of UltraPure water
- 0.5 µL of 10 mM dNTPs
- 0.5 µL of 10 µM Oligo(dT) Primer (e.g., 5'-AAGCAGTGGTATCAACGCAGAGTACT30VN-3')
- 0.25 µL of RNase Inhibitor
- Dispense 3.25 µL of this master mix into each well of a PCR plate.
- Transfer single cells into each well using FACS or micromanipulation.
- Incubate the plate at 72°C for 3 minutes, then immediately place on ice. This step lyses cells and denatures RNA secondary structures.
- Prepare a cell lysis master mix. For a single reaction, combine:
Reverse Transcription and Template-Switching:
- Prepare the RT-TS master mix. For a single reaction, combine:
- 1.0 µL of Maxima RNase H-minus RT 5x Buffer
- 0.5 µL of 20 U/µL Maxima RNase H-minus Reverse Transcriptase
- 0.5 µL of 10 µM Template-Switching Oligo (e.g., 5'-AAGCAGTGGTATCAACGCAGAGTACATrGrG+G-3')
- 0.5 µL of 1 M Betaine
- 0.15 µL of 1 M MgCl2
- 0.1 µL of RNase Inhibitor
- Add 2.75 µL of the RT-TS master mix to each well containing the lysed cell for a total reaction volume of 6.0 µL.
- Run the following thermocycler program:
- 42°C for 90 minutes (Reverse Transcription)
- 10 cycles of: 50°C for 2 minutes, 42°C for 2 minutes
- 70°C for 15 minutes (Enzyme inactivation)
- Prepare the RT-TS master mix. For a single reaction, combine:
cDNA Amplification:
- Prepare the PCR master mix. For a single reaction, combine:
- 12.5 µL of Kapa HiFi HotStart ReadyMix (2x)
- 2.5 µL of 10 µM ISPCR Primer (5'-AAGCAGTGGTATCAACGCAGAGT-3')
- 4.0 µL of UltraPure water
- Add 19.0 µL of the PCR master mix to each 6.0 µL RT reaction.
- Run the following PCR program:
- 98°C for 3 minutes
- 21-25 cycles of: 98°C for 20 seconds, 67°C for 15 seconds, 72°C for 4 minutes
- 72°C for 5 minutes
- Hold at 4°C
- Prepare the PCR master mix. For a single reaction, combine:
Part II: Quality Control and Normalization (Critical for Reproducibility)
As emphasized in the HT Smart-seq3 protocol, the following steps are essential for generating high-quality, reproducible data from precious samples like stem cells [7].
- cDNA Purification: Purify the PCR-amplified cDNA using a solid-phase reversible immobilization (SPRI) method, such as with AMPure XP beads, to remove enzymes, salts, and unused primers.
- cDNA Quantification: Quantify the purified cDNA using a fluorescence-based assay (e.g., Qubit dsDNA HS Assay). This serves as a critical quality control checkpoint to confirm successful cDNA generation before proceeding to costly library preparation.
- cDNA Normalization: Precisely normalize all samples to a uniform concentration (e.g., 100 pg/µL) using a liquid handler. This ensures even representation in the final sequencing library and eliminates the need for post-library normalization.
The combination of oligo(dT) priming and template-switching provides a robust, ligation-independent method for capturing complete RNA transcripts. This principle, central to the Smart-seq2 protocol and its successors, has enabled groundbreaking research in single-cell biology, including the detailed characterization of stem cell heterogeneity and differentiation.
For stem cell researchers, the key advantages include:
- Full-Length Coverage: Enables detection of alternative splice variants, single-nucleotide polymorphisms (SNPs), and allelic expression, which are crucial for understanding cell fate decisions [7] [5].
- High Sensitivity: Allows for the profiling of cells with low RNA content, a common feature of quiescent or early stem cells [4] [7].
- Low-Input Compatibility: Protocols can be scaled down to work with rare cell populations, such as directly isolated tissue-resident stem cells [4] [8].
Continued evolution of this technology, such as the integration of UMIs in Smart-seq3 and the use of more processive reverse transcriptases, further enhances its quantitative accuracy and applicability, solidifying its role as a cornerstone method in modern functional genomics and drug discovery pipelines.
Single-cell RNA sequencing (scRNA-seq) has revolutionized our ability to study cellular heterogeneity, a fundamental aspect of stem cell biology. This application note details the implementation and advantages of the Smart-seq2 protocol, a full-length scRNA-seq method, within the context of stem cell research. We provide a comprehensive examination of its superior sensitivity and capability for long transcript detection, a detailed experimental protocol, a comparative analysis with alternative technologies, and a visualization of the underlying workflow. The content is structured to serve researchers, scientists, and drug development professionals seeking to leverage deep transcriptomic profiling in their investigations of stem cell populations, their regulatory networks, and differentiation trajectories.
Stem cell populations are inherently heterogeneous, encompassing varying states of potency, differentiation, and metabolic activity. A complete understanding of these dynamics requires a transcriptomic method that does not just count genes but captures their full molecular identity. The Smart-seq2 protocol, developed by Picelli et al., has established itself as a gold standard for sensitive full-length transcriptome profiling in single cells [9]. Unlike 3'-end counting methods like those from 10X Genomics, Smart-seq2 enables the detection of splice isoforms, allelic variants, and single-nucleotide polymorphisms (SNPs) [10] [5] [11]. This capability is critical for stem cell research, where alternative splicing is a key regulatory mechanism and where identifying genetic variants can help trace lineage relationships. Furthermore, its high sensitivity makes it particularly suited for analyzing rare cell types or samples with low RNA content, common scenarios in developmental biology and regenerative medicine [12].
Key Advantages of Smart-seq2 for Stem Cell Research
The Smart-seq2 method offers distinct technical benefits that are directly applicable to addressing complex questions in stem cell biology.
Superior Sensitivity and Gene Detection
Smart-seq2 is renowned for its high sensitivity, which allows for the detection of a greater number of genes per cell compared to other platforms. This is crucial for identifying subtle transcriptional differences that define stem cell subpopulations.
Table 1: Comparative Performance of scRNA-seq Platforms
| Feature | Smart-seq2 | 10X Genomics Chromium | Smart-seq3 | FLASH-seq |
|---|---|---|---|---|
| Transcript Coverage | Full-length | 3'-end biased | Full-length with 5' UMIs | Full-length |
| Gene Detection Sensitivity | High (more genes/cell) [11] | Lower [11] | Higher than Smart-seq2 [5] | Highest reported [10] [5] |
| Isoform & SNP Detection | Yes [10] [11] | Limited | Yes [5] | Yes [10] |
| Throughput | 96-384 wells (plate-based) | High (thousands of cells) | 384-well plate (automated) [7] | 96- & 384-well plate [5] |
| Typical Workflow Duration | ~2 days [13] [14] | Varies | ~9-10 hours [5] | ~4.5-7 hours [10] [5] |
Enhanced Detection of Long Transcripts and Isoforms
A significant advantage for stem cell research is the protocol's optimized chemistry, which provides improved coverage across transcripts. This results in a more accurate representation of long genes and the ability to profile alternative splicing events [5]. The use of locked nucleic acid (LNA) in the template-switching oligonucleotide (TSO) and the addition of betaine were key optimizations that increased cDNA yield and length, enabling more comprehensive coverage of complex transcriptomes [9] [5].
Smart-seq2 Experimental Workflow Protocol
The following section outlines a detailed protocol for generating full-length RNA-seq libraries from single cells using Smart-seq2. The entire process, from cell picking to a final sequencing library, takes approximately two days [13] [14].
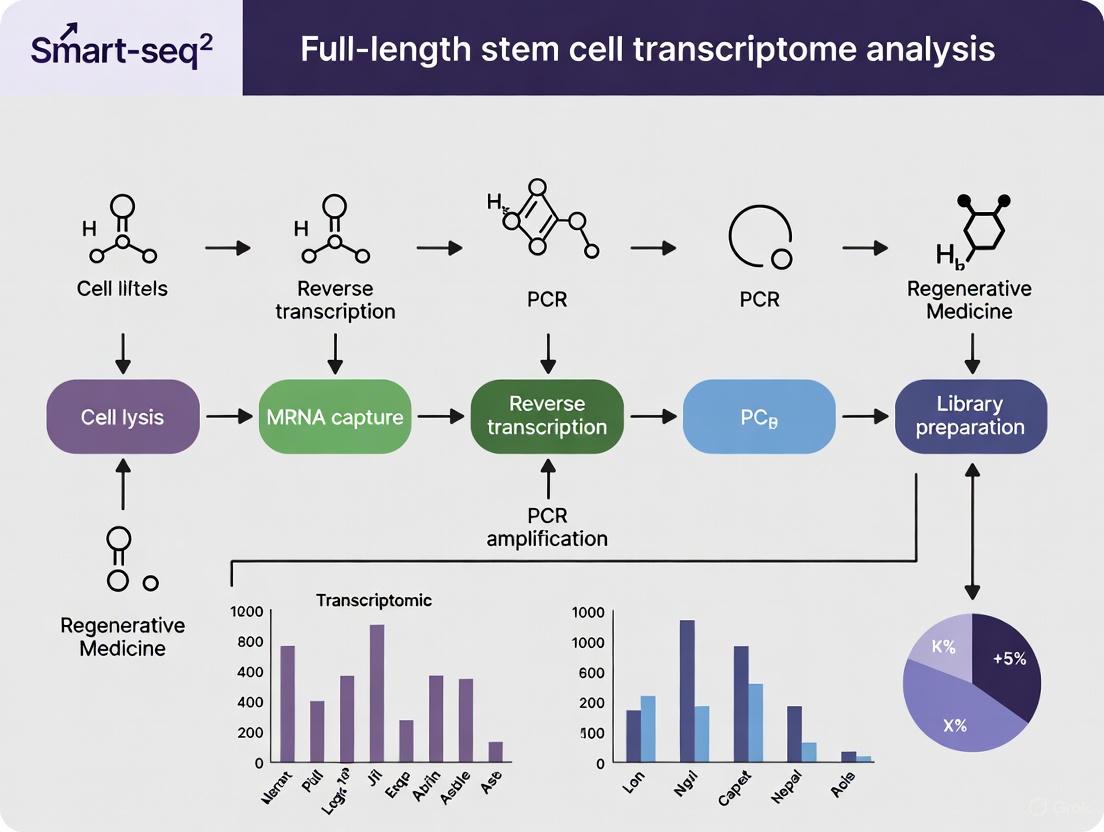
The diagram below illustrates the key stages of the Smart-seq2 protocol, from single-cell lysis to the final sequencing-ready library.
Step-by-Step Methodology
- Cell Lysis and Reverse Transcription. Individual cells are sorted into a lysis buffer containing dNTPs and an oligo-dT primer. Reverse transcription is performed, which adds a few non-templated cytosines to the 3' end of the first-strand cDNA [15].
- Template Switching. A template-switching oligonucleotide (TSO), featuring a locked nucleic acid (LNA) guanosine at its 3' end, binds to the non-templated C-overhang. This allows the reverse transcriptase to "switch" templates and copy the TSO sequence, thereby adding a universal priming site to the 5' end of the cDNA [9] [5] [15].
- cDNA Preamplification. The full-length cDNA is then amplified via a limited-cycle PCR using a primer that binds to the universal sequence added during template switching [15]. This step generates sufficient material for library construction.
- Library Preparation and Sequencing. The amplified cDNA is fragmented and prepared for sequencing using a tagmentation-based approach (e.g., Nextera XT), which efficiently adds sequencing adapters [15]. The final libraries are quantified, pooled, and sequenced on an Illumina platform to a desired depth.
The Scientist's Toolkit: Essential Reagents and Materials
The robustness of the Smart-seq2 protocol relies on a set of key reagents. The following table details critical components and their functions.
Table 2: Key Research Reagent Solutions for Smart-seq2
| Reagent / Material | Function | Key Characteristic / Optimization in Smart-seq2 |
|---|---|---|
| Oligo-dT Primer | Binds to the poly-A tail of mRNAs to initiate reverse transcription. | Contains a universal PCR handle at the 5' end for subsequent amplification [15]. |
| Template-Switching Oligo (TSO) | Provides a template for adding a universal sequence to the 5' end of cDNA. | Features a 3'-terminal Locked Nucleic Acid (LNA) guanosine to drastically improve template-switching efficiency [9] [5]. |
| Reverse Transcriptase | Synthesizes first-strand cDNA from mRNA templates. | Superscript II is used for its high processivity and ability to add non-templated nucleotides and perform template switching [9] [10]. |
| Betaine | Chemical additive in the RT and PCR reactions. | Reduces secondary structures in RNA and DNA, enhances full-length cDNA yield, and mitigates GC bias [9] [5]. |
| MgCl₂ | Divalent cation for PCR amplification. | Used at a higher concentration in combination with betaine to optimize PCR efficiency [5]. |
Comparative Analysis with Next-Generation Methods
While Smart-seq2 remains a robust and widely adopted method, newer protocols have been developed to address its limitations in throughput, cost, and quantitative accuracy.
- Smart-seq3 integrates Unique Molecular Identifiers (UMIs) at the 5' end of transcripts to correct for PCR amplification biases, improving quantitative accuracy. It also uses a revised reverse transcription mix for enhanced sensitivity [5]. However, the inclusion of UMIs can complicate the workflow and lead to strand-invasion artifacts if not carefully designed [10] [5].
- FLASH-seq represents a significant evolution, offering a faster workflow (under 4.5 hours for a low-amplification version), higher sensitivity, and greater cDNA yields than Smart-seq2 and Smart-seq3. It uses a more processive reverse transcriptase (Superscript IV) and a simplified TSO with riboguanosine to reduce artifacts [10] [5]. For labs considering high-throughput automation, FLASH-seq is a compelling modern alternative.
Smart-seq2 provides an exceptional balance of sensitivity, full-length transcript coverage, and technical robustness, making it a powerful tool for stem cell researchers. Its ability to detect a high number of genes, coupled with its proficiency in profiling long transcripts and splice variants, offers an unparalleled view into the transcriptional complexity of stem cells. While newer methods like Smart-seq3 and FLASH-seq offer improvements in quantification and speed, Smart-seq2's well-established, detailed protocol [13] and proven track record ensure it remains a vital method for hypothesis-driven research where maximum transcriptomic information from each individual cell is paramount.
Within the framework of full-length transcriptome analysis of stem cells, the Smart-seq2 protocol is a cornerstone technology due to its high sensitivity and ability to sequence full-length cDNA. This capability is crucial for applications such as identifying novel isoforms, detecting allele-specific expression, and characterizing somatic mutations in heterogeneous stem cell populations. However, two significant technical limitations—the lack of strand specificity and inherent transcript length bias—can introduce interpretive errors and affect data quantification. This Application Note details these limitations within the context of stem cell research, provides structured experimental data, and outlines validated protocols to diagnose and mitigate these issues, ensuring the highest data integrity for critical downstream analyses.
Core Technical Limitations of Smart-seq2
The Smart-seq2 method, while powerful, has specific technical characteristics that researchers must account for in their experimental design and data analysis. The table below summarizes the core limitations as established in the literature.
Table 1: Core Technical Limitations of Smart-seq2
| Limitation | Technical Description | Impact on Data | Key Citation |
|---|---|---|---|
| Lack of Strand Specificity | The protocol is not strand-specific; it does not preserve the original orientation of the RNA transcript during cDNA synthesis [15] [16]. | Inability to distinguish whether a read originated from the sense or antisense strand. This complicates the analysis of overlapping genes, antisense transcription, and can lead to misannotation of transcripts. | [15] |
| Transcript Length Bias | Preferential amplification of shorter transcripts and inefficient reverse transcription of reads over 4 kb [15]. | Under-detection of long mRNAs. Gene expression levels become biased towards shorter transcripts, skewing quantitative interpretations, especially critical in stem cells where long non-coding RNAs and other large transcripts may be functionally important. | [15] |
These limitations are foundational and are consistently noted in technical specifications from kit manufacturers and method-explorer databases [15] [16]. The subsequent sections provide experimental data and protocols to contextualize these limitations.
Quantitative Data on Protocol Performance
Benchmarking studies against other full-length scRNA-seq methods reveal key performance metrics. The following table synthesizes quantitative data from recent comparisons, highlighting how newer methods attempt to address Smart-seq2's limitations.
Table 2: Performance Comparison of Full-Length scRNA-seq Methods
| Method | Protocol Duration | Gene Detection Sensitivity (in HEK293T) | Key Technical Modifications | Citation |
|---|---|---|---|---|
| Smart-seq2 | ~7-8 hours | Baseline | Uses LNA in TSO; standard SSRT-II enzyme. | [10] [15] |
| Smart-seq3 | >7 hours | Comparable to Smart-seq2 | Incorporates UMIs for quantification; uses SSRT-IV; reduced reagent volumes. | [10] [7] |
| FLASH-seq (FS) | ~4.5 hours | Increased vs. Smart-seq2/3 | Combined RT-PCR step; uses SSRT-IV; shortened RT time; replaced LNA-guano with riboguanosine in TSO to reduce strand-invasion. | [10] |
| HT Smart-seq3 | Automated, reduced hands-on time | High, superior to 10X 3' kit | Automated high-throughput workflow; includes cDNA purification and normalization for consistency. | [7] |
The data demonstrates a trend towards faster, more sensitive, and more automated protocols. A key technical advancement is the move away from locked nucleic acids (LNA) in the template-switching oligonucleotide (TSO), as used in Smart-seq2, due to its propensity to cause strand-invasion artifacts [10]. FLASH-seq's substitution with riboguanosine mitigates this, which, while not the same as true strand-specificity, reduces a key source of artifactually antisense-mapped reads.
Experimental Strategies for Mitigation
Protocol for Diagnosing Strand-Invasion Artifacts
Strand-invasion is a specific artifact that can be misattributed to antisense transcription. The following protocol, adapted from Hagemann-Jensen et al., allows for its detection.
Principle: A TSO without a spacer sequence between its Unique Molecular Identifier (UMI) and the template-switching riboguanosines is prone to invading the cDNA strand during library construction, creating artifactual reads that map to the antisense strand, often in intronic regions [10].
Procedure:
- Library Preparation: Perform scRNA-seq using a protocol of interest (e.g., a version of Smart-seq3 or a custom protocol) with a TSO containing a 5' UMI sequence.
- Bioinformatic Analysis:
- UMI Sequence Analysis: Extract the UMI sequence and the first few bases of the genomic sequence adjacent to the read start site for all deduplicated 5' UMI reads.
- Motif Analysis: Check for an overabundance of a "GGG" motif adjacent to the start of the read, which is indicative of strand-invasion [10].
- UMI-Genomic Match: Calculate the percentage of reads where the UMI sequence perfectly matches, or has a high similarity to, the genomic sequence immediately upstream of the read's mapping position. A high percentage (>4.25% with a perfect match) indicates significant strand-invasion [10].
- Feature Distribution: Compare the distribution of 5' UMI reads across genomic features (5'UTR, CDS, intron, 3'UTR) with the distribution of internal reads. An elevated proportion of intronic reads in the UMI set suggests artifacts [10].
Interpretation: A high level of UMI-to-genome matching and an enrichment of intronic/antisense reads in the UMI fraction confirm strand-invasion. The recommended solution is to use a TSO with a short, non-homologous spacer sequence between the UMI and the riboguanosines [10].
Workflow for Assessing Transcript Length Bias
This protocol evaluates whether your scRNA-seq data exhibits a bias against long transcripts.
Principle: Compare the detected transcripts against a known set of long and short genes. Inefficient reverse transcription or amplification of long transcripts will result in their under-representation.
Procedure:
- Define Gene Sets: From a reference transcriptome (e.g., GENCODE), create two non-overlapping gene sets: a "Long Transcript" set (e.g., transcripts >4 kb) and a "Short Transcript" set (e.g., transcripts <2 kb).
- Generate ScRNA-seq Data: Process a homogeneous cell type (e.g., HEK293T) or a control RNA sample using the Smart-seq2 protocol.
- Data Normalization: Normalize the gene expression matrix using a standard method (e.g., CPM - Counts Per Million).
- Calculate Detection Rate: For each gene set, calculate the percentage of genes that are detected (expression > 0) in each cell.
- Compare Coverage: For a subset of genes, calculate the normalized read coverage from the 5' end to the 3' end of the transcript and plot the average coverage. A drop in coverage across the body of long transcripts is a sign of bias.
Interpretation: A significantly lower detection rate for the "Long Transcript" set and a non-uniform coverage plot indicate transcript length bias. Mitigation strategies include optimizing reverse transcriptase choice (e.g., using a more processive enzyme like Superscript IV [10]) and adjusting buffer compositions.
Visualizing Key Concepts and Workflows
Smart-seq2 Workflow and Key Limitations
Diagram 1: Smart-seq2 workflow and limitations.
Strand Invasion Artifact Mechanism
Diagram 2: Mechanism of strand invasion artifacts.
The Scientist's Toolkit: Research Reagent Solutions
Selecting the right reagents is critical for optimizing full-length scRNA-seq performance and mitigating the discussed limitations.
Table 3: Key Reagents for Advanced Full-Length scRNA-seq
| Reagent / Component | Function | Considerations for Mitigating Limitations |
|---|---|---|
| Reverse Transcriptase (e.g., Superscript IV) | Synthesizes first-strand cDNA from cellular mRNA. | A highly processive enzyme (like SSRT-IV) improves yield and coverage of long transcripts, directly addressing transcript length bias [10]. |
| Template-Switching Oligo (TSO) | Enables the addition of a universal primer sequence to the 5' end of cDNA. | Replacing the 3' terminal LNA-guanine with riboguanosine and adding a spacer between the UMI and switching bases reduces strand-invasion artifacts [10]. |
| Unique Molecular Identifiers (UMIs) | Short random nucleotide sequences used to tag individual mRNA molecules. | Allows for accurate digital counting of transcripts and is essential for identifying and filtering PCR duplicates and artifacts, improving quantification accuracy [10] [7]. |
| Preamplification PCR Mix | Amplifies full-length cDNA to generate sufficient material for library construction. | Optimizing the number of PCR cycles and using additives like betaine can help reduce amplification bias and maintain the representation of longer or GC-rich transcripts [10] [15]. |
| Tagmentation Enzyme (e.g., Tn5) | Fragments and tags amplified cDNA for NGS library preparation. | Titrating the amount of Tn5 used relative to cDNA input helps optimize library complexity and can prevent over-fragmentation, which may exacerbate biases [10]. |
The Critical Role of Reverse Transcriptase in cDNA Yield and Sensitivity
Within the framework of full-length single-cell transcriptome research, the Smart-seq2 protocol has established itself as a gold standard due to its sensitive profiling capabilities [9] [5]. The core of this method lies in its ability to generate high-yield, full-length cDNA from the minuscule amounts of RNA found in individual cells, a process critically dependent on the enzyme reverse transcriptase (RT). The choice of RT directly influences cDNA yield, sensitivity in gene detection, and the accuracy of the resulting transcriptome, making its optimization paramount for research aimed at uncovering cellular heterogeneity in stem cell populations [17].
This application note details the experimental protocols and presents consolidated quantitative data to guide researchers in selecting and optimizing reverse transcriptase for superior outcomes in Smart-seq2-based studies.
Key Technical Mechanisms and Workflows
The sensitivity of Smart-seq2 is fundamentally linked to the mechanism of template switching, which is facilitated by the intrinsic terminal transferase activity of certain reverse transcriptases.
The Template-Switching Mechanism
The following diagram illustrates the key molecular steps in cDNA synthesis using the Smart-seq2 protocol:
This mechanism allows for the selective amplification of full-length transcripts, as only cDNAs that have undergone the template-switching event will possess the universal priming sites on both ends [18] [15]. The efficiency of this entire process is governed by the activity of the reverse transcriptase.
Comparative Performance of Reverse Transcriptases
The performance of different M-MLV reverse transcriptases has been systematically evaluated in the context of ultralow-input RNA-seq, providing critical insights for single-cell studies.
Experimental Protocol: Evaluating Reverse Transcriptase Efficiency
Objective: To quantitatively compare the cDNA yield and sensitivity of gene detection across different reverse transcriptases using ultralow inputs of total RNA (0.5 pg to 5 pg) [17].
Materials:
- RNA Sample: Serial dilutions of high-quality total RNA (e.g., from mouse brain tissues).
- Reverse Transcriptases:
- Maxima H Minus
- SMARTScribe
- SuperScript II
- SuperScript III
- Template Switching RT
- Smart-seq2 Reagents:
- 3' SMART CDS Primer II A (12 µM)
- SMARTer II A Oligonucleotide (12 µM)
- SMARTer dNTP Mix (20 mM each)
- RNase Inhibitor (40 U/µl)
- 5X First-Strand Buffer
- Dithiothreitol (DTT, 100 mM)
- Preamplification Reagents:
- IS PCR Primer (12 µM)
- Advantage 2 PCR Kit
- SPRI Beads (e.g., Agencourt RNAClean XP and AMPure XP)
- qPCR Master Mix and probe sets for housekeeping genes (e.g., Hprt, 18S, GAPDH).
Methodology:
- Lysate Preparation: Distribute RNA dilutions in a 96-well PCR plate.
- Reverse Transcription: Perform first-strand cDNA synthesis using the SMARTer Ultra Low Input RNA kit with the respective RT enzyme.
- cDNA Amplification: Amplify the cDNA with a limited number of PCR cycles using the IS PCR primer.
- Purification: Clean up the amplified cDNA using SPRI beads.
- Quantitative Analysis:
- Measure cDNA yield using a fluorometric assay (e.g., Qubit dsDNA HS).
- Assess sensitivity via qPCR for high- and low-abundance genes.
- Construct and sequence libraries to determine the number of genes detected.
Results and Data Analysis
Table 1: cDNA Yield and Sensitivity of Different Reverse Transcriptases
| Reverse Transcriptase | cDNA Yield (at 0.5 pg Input) | Average Ct Value for Low-Abundance Gene (Hprt, 0.5 pg Input) | Number of Genes Detected (at 0.5 pg Input) |
|---|---|---|---|
| Maxima H Minus | Highest | Lowest | >2,000 |
| SuperScript III | Moderate | Moderate | ~1,800 |
| SuperScript II | Moderate | High | ~1,650 |
| Template Switching | Low (at <2 pg) | High | ~1,500 |
| SMARTScribe | Lowest | Highest | ~1,400 |
Table 2: Precision and Sensitivity in Gene Detection
| Reverse Transcriptase | Precision (at 0.5 pg Input) | Sensitivity (at 0.5 pg Input) | Ability to Detect Low-Abundance Genes (FPKM 0-5) |
|---|---|---|---|
| Maxima H Minus | Robust (>95%) | Highest | Superior |
| SuperScript III | Robust (>95%) | High | Good |
| SuperScript II | Robust (>95%) | Moderate | Moderate |
| Template Switching | Robust (>95%) | Low | Limited |
| SMARTScribe | Robust (>95%) | Lowest | Most Limited |
The data conclusively demonstrates that Maxima H Minus reverse transcriptase outperforms others in key metrics, particularly at the extremely low RNA inputs representative of single-cell analysis [17]. It generates a higher cDNA yield and enables the detection of a greater number of genes, including those with low abundance, without introducing significant 3'- or 5'-end bias.
The Scientist's Toolkit: Research Reagent Solutions
Table 3: Essential Reagents for Smart-seq2 Workflow
| Reagent / Kit | Function | Critical Notes |
|---|---|---|
| SMARTer Ultra Low Input RNA Kit | Provides core components for reverse transcription and template switching, including primers, oligonucleotides, and buffer. | Contains the 3' SMART CDS Primer II A and SMARTer II A Oligonucleotide essential for the protocol [18]. |
| Maxima H Minus Reverse Transcriptase | Catalyzes first-strand cDNA synthesis and enables efficient template switching. | Superior for low-input samples due to high sensitivity and robust yield; lacks RNase H activity to reduce RNA degradation [17]. |
| Agencourt RNAClean XP SPRI Beads | Purifies RNA and cDNA by size selection and cleanup; removes enzymes, salts, and short fragments. | Critical for maintaining sample integrity and preparing clean libraries for sequencing [18]. |
| Advantage 2 PCR Kit | Amplifies full-length cDNA with high fidelity using the universal IS PCR Primer. | Ensures uniform and efficient amplification of the cDNA library prior to tagmentation [18]. |
| Nextera XT DNA Library Prep Kit | Prepares sequencing-ready libraries via tagmentation of the amplified cDNA. | Enables rapid and efficient library construction from multiple samples in parallel [18]. |
The selection of Maxima H Minus reverse transcriptase represents a key optimization for maximizing cDNA yield and detection sensitivity in the Smart-seq2 protocol. This is especially critical in stem cell research, where accurately capturing the full transcriptomic diversity of rare cell states can lead to pivotal discoveries.
While Smart-seq2 remains a robust and widely adopted method, the field continues to evolve. Newer protocols like Smart-seq3 integrate unique molecular identifiers (UMIs) for more accurate transcript counting [5] [19], and FLASH-seq offers a faster, more sensitive, and automatable alternative by combining reverse transcription and preamplification into a single step and utilizing a more processive reverse transcriptase [5] [10]. Nevertheless, the foundational principles and optimizations discussed here remain directly applicable to these advanced methods, providing a critical framework for researchers pursuing full-length single-cell transcriptomics.
Executing Smart-seq2: A Step-by-Step Workflow from Single Stem Cell to Sequencing Library
In full-length stem cell transcriptome research, the initial stages of cell lysis and reverse transcription (RT) are critical determinants of success. The Smart-seq2 protocol has shaped the field by enabling deep, single-cell analysis of splice isoforms, allelic variants, and single-nucleotide polymorphisms. Recent methodological advancements have focused on enhancing the efficiency and sensitivity of these foundational steps to maximize cDNA yield and quality while reducing processing time and technical artifacts. This application note details optimized protocols for cell lysis and reverse transcription within the Smart-seq2 framework, providing researchers with practical guidance for stem cell research and drug development applications.
Technical Optimization of Lysis and Reverse Transcription
Cell Lysis Strategies for RNA Integrity
Effective cell lysis must rapidly disrupt cellular membranes while preserving RNA integrity and inactivating nucleases. The optimal lysis method depends on sample type and scale.
Direct Lysis Buffers: For high-throughput processing of 96-well plates, a simplified lysis solution containing 0.5% SDS, 10 mM DTT, and 1 mg/ml proteinase K in water efficiently releases RNA while degrading nucleases. Incubation at 50°C for 1 hour followed by enzyme inactivation at 90°C for 5 minutes provides high RNA yield with minimal degradation. The lysate is then neutralized with 20% Tween 20 before reverse transcription [20].
Commercial Kits: Integrated workflows like the CelluLyser Lysis and cDNA Synthesis Kit combine gentle cell lysis with downstream reactions, enabling processing from 1 to 10,000 cells in a single tube without RNA purification. This approach minimizes material loss, particularly beneficial for precious stem cell samples [21].
Reverse Transcription Enzyme Selection
The choice of reverse transcriptase significantly impacts cDNA yield, sensitivity for low-abundance genes, and coverage uniformity.
Table 1: Performance Comparison of Reverse Transcriptases for Low-Input RNA
| Reverse Transcriptase | Recommended RNA Input | Key Advantages | Gene Detection Performance | Bias Characteristics |
|---|---|---|---|---|
| Maxima H Minus [17] | 0.5 pg - 5 pg | Highest sensitivity for low-expression genes | Detects >11,700 genes from 5 pg input | No significant 3' or 5' bias |
| SuperScript IV [10] | Single-cell | High processivity, reduced reaction time | 8× more cDNA yield vs. Smart-seq2 | Improved gene-body coverage |
| SuperScript II/III [17] | 1 pg - 5 pg | Established performance | Moderate gene detection | Mild 5'-end bias |
| Template Switching [17] | 2 pg - 5 pg | High cDNA yield at higher inputs | Good for abundant transcripts | Reduced low-abundance gene detection |
| SMARTScribe [17] | Not recommended <2 pg | Lower efficiency at ultralow input | Lowest gene detection | Variable performance |
For stem cell applications where rare transcripts and low-abundance markers are significant, Maxima H Minus demonstrates superior sensitivity for detecting low-expression genes (FPKM 0-5) across dilution series from 5 pg to 0.5 pg total RNA [17]. Alternatively, SuperScript IV enables shorter RT reactions while generating significantly higher cDNA yields—approximately eight times more than Smart-seq2 with the same PCR cycles—making it ideal for samples with low RNA content [10].
Template-Switching Oligo (TSO) Design
The template-switching mechanism is fundamental to Smart-seq2 and its derivatives, with TSO design critically impacting strand-invasion artifacts and cDNA yield.
Strand-Invasion Reduction: Replacing the 3′-terminal locked nucleic acid guanidine in TSO with riboguanosine significantly reduces strand-invasion artifacts that can misrepresent transcript counts and isoforms [10].
Spacer Incorporation: Adding a 5-nucleotide spacer sequence between riboguanosines and unique molecular identifiers (UMIs) in UMI-containing TSOs (e.g.,
-NNNNNNNN-SPACER-rGrGrG) further prevents strand-invasion events. Protocols without spacers show >10.9% of UMIs partially matching upstream sequences, indicating artifactual incorporation [10].
Protocol Miniaturization and Automation
Miniaturization to 5μl reaction volumes maintains gene detection capabilities while significantly reducing reagent costs [10]. Automated high-throughput implementations (e.g., HT Smart-seq3) integrate liquid handling systems to process 384-well plates in parallel, achieving over 95% well occupancy while reducing hands-on time and variability [7].
Recommended Experimental Protocols
Protocol 1: Streamlined Cell Lysis and cDNA Synthesis for 96-Well Plates
This protocol adapts the "Cells-to-cDNA" approach for cost-effective, high-throughput processing [20].
Materials:
- Lysis solution: 0.5% SDS, 10 mM DTT, 1 mg/ml proteinase K in PCR-grade water
- Neutralization solution: 20% Tween 20
- High-Capacity cDNA Reverse Transcription Kit (or equivalent)
- 96-well PCR plates and thermal cycler
Procedure:
- Cell Preparation: Centrifuge culture plates at 100-1000g for 1-5 minutes. Discard medium and wash cells with ice-cold PBS.
- Lysis: Add 25-100μl lysis solution per well (volume dependent on cell type and density). Transfer to PCR plate.
- Incubation: Incubate at 50°C for 1 hour in a thermal cycler.
- Enzyme Inactivation: Heat to 90°C for 5 minutes.
- Neutralization: Dilute lysate 1:1 with 20% Tween 20 solution.
- Reverse Transcription: Use 10μl neutralized lysate with 10μl RT master mix following manufacturer protocols.
- Quality Control: Assess cDNA yield using fluorescence measurements with reduced reagent volumes to minimize costs [7].
Protocol 2: Full-Length scRNA-seq with Enhanced Sensitivity
This protocol incorporates optimizations for ultralow RNA inputs relevant to stem cell subpopulations [17].
Materials:
- Selected reverse transcriptase (Maxima H Minus or SuperScript IV)
- Modified TSO with riboguanosine and spacer sequence
- dNTP mix with increased dCTP concentration
- PCR preamplification reagents
Procedure:
- Cell Lysis: Lyse single cells in appropriate buffer.
- Reverse Transcription: Perform RT using selected enzyme with modified TSO. Increase dCTP concentration to enhance C-tailing activity of reverse transcriptase and boost template-switching efficiency [10].
- cDNA Preamplification: Perform limited-cycle PCR (10-16 cycles depending on RNA content).
- Library Preparation: Proceed directly to tagmentation without intermediate purification when cDNA yield is sufficient [10].
- Quality Assessment: Verify gene-body coverage and minimal strand-invasion artifacts.
Visualization of Workflows
Diagram 1: Smart-seq2 cDNA Synthesis and Strand-Invasion Prevention
Diagram 2: High-Throughput Automated Workflow
The Scientist's Toolkit: Research Reagent Solutions
Table 2: Essential Reagents for Optimized Cell Lysis and Reverse Transcription
| Reagent/Category | Specific Examples | Function & Application Notes |
|---|---|---|
| Reverse Transcriptases | Maxima H Minus [17], SuperScript IV [10] | Converts RNA to cDNA; Selection critical for sensitivity and bias |
| Lysis Buffers | SDS/DTT/Proteinase K [20], CelluLyser Buffer [21] | Releases RNA while inactivating nucleases; Formula affects downstream compatibility |
| Template-Switching Oligos | rGrGrG-modified TSO [10], Spacer-containing TSO [10] | Enables full-length cDNA capture; Design impacts strand-invasion artifacts |
| dNTP Mixes | Standard dNTP with increased dCTP [10] | Building blocks for cDNA synthesis; dCTP balance affects template-switching |
| cDNA Synthesis Kits | High-Capacity cDNA Reverse Transcription Kit [20], CelluLyser Lysis and cDNA Synthesis Kit [21] | Integrated solutions for specific throughput needs and sample types |
| Automation Systems | Mantis Liquid Handler, Integra VIAFLO [7] | Enables high-throughput processing with minimal variability |
Optimizing cell lysis and reverse transcription protocols establishes the foundation for successful full-length stem cell transcriptome studies using Smart-seq2. Strategic selection of reverse transcriptases, thoughtful TSO design, and appropriate lysis conditions significantly enhance cDNA yield and data quality. Implementation of miniaturized and automated workflows further improves reproducibility while reducing costs. These protocol refinements enable researchers to overcome key technical challenges in stem cell research, particularly when working with rare cell populations or limited sample material.
Within the framework of full-length single-cell transcriptome research, particularly in stem cell studies where capturing the complete diversity of transcripts is paramount, the processes of cDNA amplification and library preparation are critical. The Smart-seq2 protocol has established itself as a robust method for sensitive, full-length transcript detection [15] [10]. However, its efficacy is highly dependent on the precise optimization of its core enzymatic steps: the polymerase chain reaction (PCR) for cDNA amplification and tagmentation for sequencing library construction. This application note details the strategic navigation of PCR cycle determination and tagmentation reaction setup within the Smart-seq2 workflow, providing a structured guide to maximize data quality for downstream transcriptomic analysis in stem cell research.
Core Principles: Tagmentation and PCR in Smart-seq2
The integration of tagmentation into library preparation represents a significant advancement over traditional ligation-based methods. In the context of Smart-seq2, this process involves using the Tn5 transposase enzyme to simultaneously fragment the amplified double-stranded cDNA and ligate sequencing adapters [15]. This consolidation of steps into a single reaction drastically reduces hands-on time and minimizes sample loss, which is a crucial advantage when working with the limited cDNA derived from single stem cells.
The quality of the final sequencing data is a direct reflection of the quality and quantity of the input cDNA subjected to tagmentation. PCR amplification serves to generate sufficient double-stranded cDNA from the minute amounts of material originating from a single cell. The number of PCR cycles used in this pre-amplification step is, therefore, a key determinant of success. Insufficient amplification yields too little material for efficient tagmentation, resulting in low-complexity libraries with poor gene detection. Excessive amplification, however, can lead to increased rates of PCR duplicates, where the over-representation of initial molecules biases quantitative expression analysis [22] [23]. Furthermore, non-optimized PCR can introduce sequence-dependent biases, skewing the representation of transcripts.
Table 1: Key Advantages and Challenges of Tagmentation in Smart-seq2
| Aspect | Advantages | Challenges & Considerations |
|---|---|---|
| Workflow Efficiency | Rapid library construction; fewer purification steps [15] | Optimization of Tn5-to-cDNA ratio is required for uniform fragmentation [23] |
| Sensitivity | Compatible with low cDNA inputs (picogram range) [23] | Risk of tagmenting genomic DNA contaminants without proper DNase treatment [24] |
| Data Quality | High level of mappable reads; good coverage across transcripts [15] | Potential for strand-invasion artifacts with suboptimal template-switching oligo (TSO) design [10] [23] |
| Quantification | -- | Preferential amplification of high-abundance transcripts can bias expression measurements [15] |
Experimental Protocols & Methodologies
Determining Optimal PCR Cycle Number for cDNA Amplification
The following protocol is adapted for a standard 96-well plate Smart-seq2 reaction, starting from a single-cell lysate.
Materials & Reagents:
- KAPA HiFi HotStart ReadyMix (or SeqAmp Polymerase for improved tagmentation compatibility [23])
- ISPCR primer (100 µM)
- Nuclease-free water
- AMPure XP beads
- Qubit dsDNA HS Assay Kit and fluorometer (or equivalent)
Procedure:
- Prepare the PCR Master Mix on ice. For a single 30 µL reaction, combine:
- 15 µL of 2X KAPA HiFi HotStart ReadyMix
- 1.5 µL of 100 µM ISPCR primer
- 13.5 µL of nuclease-free water
Add the master mix to the well containing the 10 µL reverse transcription reaction product. Mix thoroughly by gentle pipetting.
Amplify the cDNA in a thermal cycler using the following cycling conditions:
- Initial Denaturation: 98°C for 3 minutes
- Cycling (X cycles): 98°C for 20 seconds, 67°C for 15 seconds, 72°C for 6 minutes
- Final Extension: 72°C for 5 minutes
- Hold: 4°C
Purify the amplified cDNA using AMPure XP beads at a 0.8x ratio to remove primers, dNTPs, and enzyme. Elute in 20 µL of nuclease-free water or TE buffer.
Quantify the cDNA yield using the Qubit dsDNA HS Assay. A successful reaction from a single mammalian cell typically yields 5–30 ng/µL.
Determining Cycle Number: The optimal number of cycles (X in Step 3) is cell-type-dependent and influenced by RNA content.
- For cells with high RNA content (e.g., HEK293T), aim for 10–14 cycles [10].
- For cells with lower RNA content (e.g., lymphocytes, many stem cells), 14–18 cycles may be necessary [10].
- The goal is to use the minimum number of cycles that produces sufficient cDNA for library construction (typically >1 ng total), thereby minimizing PCR bias and duplicate rates [22].
Optimized Tagmentation Library Preparation
This protocol assumes the use of a commercially loaded Tn5 transposase (e.g., from Illumina's Nextera XT Kit) and pre-amplified, purified cDNA.
Materials & Reagents:
- Loaded Tn5 Transposase
- cDNA from the previous protocol
- Nextera XT Index Kit (or equivalent for dual indexing)
- Neutralizing Buffer (e.g., from the tagmentation kit)
- AMPure XP beads
Procedure:
- Dilute the purified cDNA to a normalized concentration. While studies show tagmentation is robust over a wide input range (e.g., 0.1–2 ng), normalizing input amounts (e.g., to 0.5–1 ng per reaction) helps ensure uniform sequencing depth across libraries [23].
Set up the Tagmentation Reaction. For a single reaction, combine:
- 1–5 µL of diluted cDNA (containing 0.1–2 ng)
- 2.5 µL of loaded Tn5 transposase
- 1X Tagmentation Buffer
- Nuclease-free water to a final volume of 10 µL.
- Note: The Tn5-to-cDNA ratio is critical. Excessive Tn5 can lead to over-fragmentation, while insufficient Tn5 results in inefficient tagmentation [23].
Incubate the reaction at 55°C for 10–15 minutes in a thermal cycler.
Stop the reaction by adding 2.5–5 µL of Neutralizing Buffer. Mix thoroughly and incubate at room temperature for 5 minutes.
Add Index Adapters directly to the neutralized tagmentation reaction. Combine:
- The entire 12.5 µL neutralized reaction
- 2.5 µL of a unique P5 index primer (i5)
- 2.5 µL of a unique P7 index primer (i7)
- 12.5 µL of 2X KAPA HiFi HotStart ReadyMix (or a polymerase compatible with direct amplification from tagmented fragments, like SeqAmp [23]). The use of dual indexes allows for multiplexing and reduces index hopping errors.
Amplify the Library using a limited-cycle PCR:
- 72°C for 3 minutes (gap filling)
- 95°C for 30 seconds
- 8–12 cycles of: 95°C for 10 seconds, 55°C for 30 seconds, 72°C for 1 minute
- Final Extension: 72°C for 5 minutes
Purify the final library using AMPure XP beads, typically at a 0.8x or 0.9x ratio to remove primer dimers and select for the desired fragment size. Elute in 20 µL of resuspension buffer.
Perform Quality Control using an Agilent Bioanalyzer or TapeStation to assess the library fragment size distribution (expected peak ~300–500 bp) and quantify the final library concentration via qPCR for accurate sequencing pool normalization.
Data Presentation & Quantitative Optimization
Empirical data is essential for guiding the optimization of PCR and tagmentation. The following tables consolidate findings from recent studies to inform experimental design.
Table 2: Impact of Input Material and PCR Cycles on Data Quality [22]
| Total RNA Input | PCR Cycles | Effect on PCR Duplicate Rate | Recommended Use Case |
|---|---|---|---|
| Low (< 15 ng) | High (e.g., 15-18) | High (34-96% of reads discarded) | Avoid; if necessary, use UMIs for accurate quantification. |
| Low (< 15 ng) | Low (e.g., 10-12) | Moderate to High | Acceptable for very scarce samples, but gene detection may be compromised. |
| Moderate (15-125 ng) | As low as possible | Low to Moderate | Ideal range; use minimum cycles for sufficient yield. |
| High (> 125 ng) | Standard (e.g., 12-14) | Low (plateaus at ~3.5%) | Standard operation; minimal duplication concerns. |
Table 3: Tagmentation Reaction Parameters and Outcomes [23]
| cDNA Input (pg) | Tn5 Amount | Reaction Volume | Library Complexity | Notes |
|---|---|---|---|---|
| Wide Range (50-1000 pg) | Fixed, standard | Standard (e.g., 10 µL) | Robust, minimal effect | Reaction is highly tolerant to cDNA input variation. |
| Fixed Amount | Titrated (Low to High) | Standard | Modulated by Tn5 amount | Lower Tn5 can be used for substantial cost savings with minimal complexity loss. |
| Fixed Amount | Fixed | Miniaturized (e.g., 2 µL) | Similar to standard volume | Compatible with workflow miniaturization efforts like Smart-seq3xpress. |
The Scientist's Toolkit: Essential Reagents
Table 4: Key Research Reagent Solutions for Smart-seq2 Optimization
| Reagent / Kit | Function in Workflow | Critical Considerations |
|---|---|---|
| Template Switching Oligo (TSO) | Enables template-switching during RT, capturing the 5' end of transcripts. | Designs with riboguanosines and spacers (e.g., -NNNNNNN-SPACER-rGrGrG) reduce strand-invasion artifacts [10] [23]. |
| Oligo(dT) Primer | Initiates reverse transcription at the poly-A tail of mRNAs. | The anchor sequence (e.g., VN) improves alignment to the true transcript start [25] [4]. |
| Tn5 Transposase | Fragments dsDNA and ligates sequencing adapters simultaneously. | Can be produced in-house for significant cost reduction or purchased commercially. Activity on RNA/DNA hybrids enables direct tagmentation in some variants [24] [26]. |
| PCR Polymerase | Amplifies cDNA post-RT and amplifies the final tagmented library. | SeqAmp shows improved compatibility with direct tagmentation compared to KAPA HiFi, reducing 5'-read bias [23]. |
| Solid Phase Reversible Immobilization (SPRI) Beads | Purify and size-select nucleic acids after RT, PCR, and tagmentation. | Bead-to-sample ratio is critical for selecting the desired fragment size range and removing contaminants like primer dimers. |
Workflow and Logical Pathway Visualization
The following diagram illustrates the complete optimized workflow for cDNA amplification and library preparation, integrating the key decision points for PCR and tagmentation.
The successful application of the Smart-seq2 protocol for sophisticated full-length stem cell transcriptome research hinges on a deliberate and informed approach to cDNA amplification and library preparation. By understanding the interplay between PCR cycle number, cDNA input, and Tn5 tagmentation efficiency, researchers can systematically optimize their protocols. The methodologies and data presented here provide a clear roadmap for this optimization, emphasizing the principle of using the minimum necessary amplification to generate high-complexity, high-fidelity sequencing libraries. This rigorous approach ensures that the resulting data robustly captures the full transcriptional landscape of stem cells, enabling discoveries in development, differentiation, and disease.
Cellular heterogeneity is a fundamental characteristic of stem cell populations, influencing processes like differentiation, self-renewal, and response to stimuli. Bulk RNA sequencing masks these critical differences by providing averaged transcriptomic profiles [27]. Full-length single-cell RNA sequencing (scRNA-seq) technologies, particularly the Smart-seq2 protocol, have emerged as powerful tools to dissect this heterogeneity at unprecedented resolution, enabling researchers to identify rare subpopulations and characterize transcriptional dynamics in stem cell systems [28] [13].
In stem cell research, understanding heterogeneity is crucial for uncovering the mechanisms of cell fate decisions, pluripotency states, and lineage commitment. The Smart-seq2 method provides sensitive full-length transcript coverage, which is essential for detecting alternative splice variants, sequence mutations, and allelic expression in individual cells—features often critical for understanding stem cell regulation and dysfunction [10] [7]. This application note explores how Smart-seq2 facilitates deep investigation of stem cell heterogeneity and rare subpopulation identification within the context of full-length stem cell transcriptome research.
Technical Performance: Quantitative Comparisons of scRNA-seq Methods
The analytical power of Smart-seq2 for stem cell research is demonstrated through its enhanced sensitivity and comprehensive transcriptome coverage compared to other scRNA-seq approaches. Table 1 summarizes key performance metrics across different full-length scRNA-seq methods.
Table 1: Performance Comparison of Full-Length scRNA-seq Methods in Stem Cell Research
| Method | Transcript Coverage | Gene Detection Sensitivity | Hands-on Time | Key Applications in Stem Cell Research |
|---|---|---|---|---|
| Smart-seq2 | Full-length | High (~13,000 genes/cell) [29] | ~2 days [13] | Pluripotency states, lineage tracing, splice isoforms |
| FLASH-seq | Full-length | Higher than Smart-seq3 [10] | ~4.5 hours [10] | High-resolution gene expression across samples |
| Smart-seq3 | Full-length with UMIs | High (improved with UMIs) [7] | Varies (automation possible) [7] | Accurate transcript quantification, rare cell identification |
| 10x Genomics (3′) | 3' ends only | Lower than full-length methods [7] | Lower | Large-scale heterogeneity studies, immune profiling |
Recent advancements building upon Smart-seq2 have further enhanced its capabilities. FLASH-seq demonstrates improved sensitivity with a dramatically reduced protocol time of approximately 4.5 hours, enabling more rapid profiling of stem cell populations [10]. The incorporation of unique molecular identifiers (UMIs) in methods like Smart-seq3 improves transcript quantification accuracy, which is particularly valuable for identifying transcriptional bursting and subtle expression differences in rare stem cell subpopulations [7].
When applied to pluripotent stem cells, Smart-seq2 has successfully uncovered distinct subpopulations within human embryonic stem cells (ESCs) and feeder-free extended pluripotent stem cells (ffEPSCs), mapping the transition process between pluripotency states through pseudotime analysis [28]. This capability to resolve developmental trajectories at single-cell resolution makes it indispensable for modern stem cell biology.
Experimental Protocols: Detailed Methodologies for Stem Cell Applications
Core Smart-seq2 Workflow for Stem Cell Transcriptomics
The standard Smart-seq2 protocol involves several critical steps optimized for stem cell applications [13]:
Single-Cell Isolation and Lysis: Individual stem cells are isolated into lysis buffer containing oligo-dT primers, dNTPs, and detergents. For stem cells, which can be sensitive to mechanical stress, fluorescence-activated cell sorting (FACS) or manual cell picking are preferred isolation methods to maintain cell viability and RNA integrity [29].
Reverse Transcription and Template Switching: First-strand cDNA synthesis is primed with oligo-dT primers containing a universal 5' anchor sequence. Reverse transcription adds 2-5 untemplated nucleotides to the cDNA 3' end, enabling template-switching using a template-switching oligo (TSO) containing riboguanosines and a locked nucleic acid (LNA) guanosine [15]. This step ensures full-length transcript capture.
cDNA Amplification: The cDNA is amplified using a limited number of PCR cycles (typically 18-25) with primers targeting the universal anchor sequences. For stem cells with low RNA content, additional cycles may be required to generate sufficient material for library preparation [10].
Library Preparation and Sequencing: The amplified full-length cDNA is fragmented and prepared for sequencing using tagmentation-based approaches (e.g., Nextera XT) or conventional fragmentation and adapter ligation. Libraries are sequenced on Illumina platforms to generate high-depth, full-length transcriptome data.
Modified Smart-seq2 Protocol for Spatial Transcriptomics in Tissue Contexts
For stem cells studied within their native tissue contexts (e.g., stem cell niches), MSN-seq combines microneedle sampling with Smart-seq2 to preserve spatial information [8]. This protocol modification enables correlation of transcriptional profiles with spatial localization in tissue sections:
Tissue Preparation and Staining: Fresh frozen tissue sections are prepared and stained with RNAse-free histological stains that maintain RNA integrity while allowing cellular visualization.
Targeted Cell Capture: Specific cells or regions of interest are captured using reusable Musashi steel needles (MSN) with 100μm diameter, typically collecting 5-10 cells per sample.
Smart-seq2 Processing: The captured cells undergo the standard Smart-seq2 workflow with volume adjustments for lower cell inputs.
Data Integration: Transcriptomic data are correlated with spatial coordinates to map stem cell subpopulations within their tissue architecture.
This approach has been successfully applied to brain tissues, retinal samples, and disease models, demonstrating its utility for studying stem cells in their native microenvironments [8].
Visualizing Experimental Workflows and Signaling Pathways
The following diagrams illustrate key experimental workflows and analytical processes for stem cell heterogeneity studies using full-length scRNA-seq methods.
Full-Length scRNA-seq Workflow for Stem Cell Analysis
Stem Cell Heterogeneity Analysis Pipeline
The Scientist's Toolkit: Essential Research Reagent Solutions
Successful implementation of Smart-seq2 for stem cell heterogeneity studies requires specific reagents and tools optimized for full-length transcriptome analysis. Table 2 catalogues essential research solutions with their specific functions in the experimental workflow.
Table 2: Essential Research Reagent Solutions for Smart-seq2 in Stem Cell Research
| Reagent/Tool | Function | Application Notes for Stem Cell Research |
|---|---|---|
| Oligo-dT Primers with Universal Anchor | Initiates reverse transcription from poly-A tails | Critical for full-length transcript capture; anchor sequence enables downstream amplification |
| Template-Switching Oligo (TSO) | Captures complete 5' ends of transcripts | LNA-modified bases improve efficiency; riboguanosines facilitate template switching [15] |
| Superscript IV Reverse Transcriptase | High-efficiency cDNA synthesis | Enhanced processivity improves coverage of long transcripts in stem cells |
| KAPA HiFi HotStart ReadyMix | High-fidelity cDNA amplification | Maintains sequence accuracy during PCR amplification; optimized for GC-rich stem cell transcripts |
| Tn5 Transposase | Library preparation via tagmentation | Accelerates fragmentation and adapter tagging; reduces hands-on time [10] |
| Unique Molecular Identifiers (UMIs) | Tags individual mRNA molecules | Enables accurate transcript counting; reduces PCR amplification bias [7] |
| Smart-Seq Single Cell Kit (Takara Bio) | Commercial optimized solution | Provides enhanced sensitivity specifically validated for low-RNA content cells [30] |
These specialized reagents address the unique challenges of stem cell transcriptomics, including typically low RNA yields from rare subpopulations and the need for high sensitivity to detect weakly expressed pluripotency factors and regulatory genes. Commercial optimized kits such as the Smart-Seq Single Cell Kit from Takara Bio offer validated solutions that outperform original Smart-seq2 protocols, particularly for challenging stem cell types with low RNA content [30].
Understanding the precise mechanisms that govern cellular differentiation and tissue formation during development requires moving beyond simple gene expression counts. Cellular identity and fate are often determined by the intricate interplay of RNA isoform diversity—produced via alternative splicing, alternative transcription start sites (TSS), and alternative polyadenylation sites—and allelic expression patterns that can exhibit cell-type-specific regulation [31]. While droplet-based single-cell RNA sequencing methods have revolutionized cell typing, their limitation to 3' or 5' counting provides an incomplete picture of the transcriptome, missing critical information about full-length transcript structures [32] [33].
The Smart-seq2 protocol has established itself as a foundational tool for full-length single-cell transcriptomics, offering the sensitivity and coverage necessary to detect splice isoforms, allelic variants, and single-nucleotide polymorphisms (SNPs) that are crucial for understanding developmental processes [5]. By providing full-length transcript coverage, Smart-seq2 and its successors enable researchers to move from asking "which genes are expressed?" to the more functionally relevant "which protein isoforms are being produced?" and "how is allelic expression regulated in specific cell types?" [31]. This application note explores how these technologies are illuminating the complex landscape of isoform diversity and allelic expression in developmental systems, with a focus on practical implementation for research and drug discovery applications.
Technical Landscape: Full-Length scRNA-seq Methodologies
Evolution of Full-Length scRNA-seq Protocols
The development of full-length single-cell RNA sequencing has progressed significantly from the initial Smart-seq2 protocol to more sensitive and efficient methods. Smart-seq2 emerged as the gold standard, optimizing reverse transcription, template switching, and preamplification steps to increase cDNA yield and sensitivity compared to earlier methods [5]. Its successor, Smart-seq3, introduced unique molecular identifiers (UMIs) for more accurate transcript quantification while maintaining full-length coverage [5]. Most recently, FLASH-seq was developed to address limitations in workflow complexity and processing time, integrating reverse transcription and cDNA amplification into a single step while demonstrating increased sensitivity and better detection of longer transcripts [10] [5].
Table 1: Comparison of Full-Length scRNA-seq Methods
| Parameter | Smart-seq2 | Smart-seq3 | FLASH-seq |
|---|---|---|---|
| Protocol Duration | ~9-10 hours | ~9-10 hours | ~4.5-7 hours |
| UMI Incorporation | No | Yes | Optional |
| Key Innovations | LNA in TSO, betaine addition | UMIs, revised RT mix, molecular crowding | Combined RT-PCR, SSRTIV enzyme, riboguanosine TSO |
| Detection Sensitivity | Baseline | Thousands more transcripts than Smart-seq2 | Highest; 8× more cDNA yield than Smart-seq methods |
| Isoform Detection | Good | Improved | Excellent; more diverse isoforms and protein-coding genes |
| Cell-to-Cell Correlation | Good | Improved | Highest (Kendall's tau) |
| Strand Invasion Artifacts | Moderate | Present in original TSO design | Reduced |
| Automation Compatibility | Moderate | Moderate | High |
Commercialized Workflow Solutions
For researchers seeking standardized implementations, commercial kits based on these methods are available. The SMART-Seq Single Cell Kit (Takara Bio) and related PLUS versions provide robust chemistry specifically designed for single-cell applications with full-length coverage [34]. More recently, MERCURIUS FLASH-seq (Alithea Genomics) has commercialized the FLASH-seq protocol in kit and service forms, offering researchers access to the most sensitive full-length scRNA-seq methodology without requiring in-house protocol development [5].
Application I: Mapping Isoform Diversity in Retinal Development
Experimental Framework for Isoform Analysis
The analysis of isoform diversity using Smart-seq2 and related methods involves a carefully optimized workflow from sample preparation through data analysis. When applying these methods to developmental systems such as retinal organoids, the following protocol has proven effective:
Sample Preparation and Cell Isolation:
- Prepare single-cell suspensions from human retinal organoids at relevant developmental time points using gentle dissociation protocols that maintain RNA integrity
- Isolate individual cells using fluorescence-activated cell sorting (FACS) into 96- or 384-well plates containing cell lysis buffer, ensuring visual confirmation of single-cell deposition
- Immediately freeze plates at -80°C or proceed directly to reverse transcription
Library Preparation using Smart-seq2 Protocol:
- Perform reverse transcription using template-switching oligonucleotides (TSOs) to ensure full-length cDNA capture with identical ends for amplification consistency
- Amplify cDNA using LD PCR with 18-22 cycles to maintain representation while generating sufficient material for library preparation
- Quality control: quantify cDNA yield using fluorometric methods and assess size distribution using capillary electrophoresis
- Prepare sequencing libraries using tagmentation-based approaches (e.g., Tn5 transposase) for efficient fragmentation and adapter incorporation
- Sequence libraries on Illumina platforms with recommended read lengths of 2×150 bp to adequately cover splice junctions
Bioinformatic Analysis for Isoform Identification:
- Align sequencing reads to reference transcriptomes using splice-aware aligners (STAR, HISAT2)
- Reconstruct transcripts and quantify isoform expression using tools designed for full-length data (StringTie, Cufflinks)
- Identify differentially used isoforms across developmental stages using statistical frameworks (DEXSeq, rMATS)
- Validate isoform predictions through comparison with long-read data or orthogonal methods
Table 2: Key Research Reagent Solutions for Isoform Analysis
| Reagent Category | Specific Product | Function in Protocol |
|---|---|---|
| Reverse Transcriptase | Superscript II/IV | cDNA synthesis from cellular RNA |
| Template-Switching Oligo (TSO) | Custom LNA-modified TSO | Ensures full-length cDNA capture; impacts strand invasion artifacts |
| Amplification Chemistry | KAPA HiFi HotStart ReadyMix | High-fidelity cDNA amplification |
| Library Preparation | Nextera XT DNA Library Preparation Kit | Efficient library construction from limited cDNA |
| Cell Lysis Buffer | SMART-Seq Lysis Buffer | Maintains RNA integrity while releasing RNA for capture |
Key Findings in Retinal Development
Application of this framework to human retinal organoids has revealed how isoform diversity contributes to neuronal fate determination. Researchers identified cell-type-specific isoforms of fate-determining factors including CRX, NRL, and THRB that emerge at critical developmental transitions [35]. Pseudotime analysis of isoform expression along the differentiation trajectory from retinal progenitor cells to photoreceptors demonstrated that isoform switching often precedes complete transcriptional activation, suggesting that alternative splicing may prime cells for fate commitment [35].
The integration of full-length scRNA-seq with chromatin accessibility data (scATAC-seq) through multi-omic approaches like scRICA-seq further revealed that changes in chromatin accessibility at promoter regions often precede isoform expression changes, positioning the chromatin landscape to permit specific isoform activation during differentiation [35]. This integrated analysis provides a more comprehensive model of retinal development where chromatin accessibility, transcriptional activation, and isoform selection work in concert to drive cellular differentiation.
Application II: Dissecting Allelic Expression Heterogeneity
Methodological Framework for Allelic Expression Analysis
The investigation of allelic expression patterns at single-cell resolution requires specialized computational approaches that can distinguish technical artifacts from biologically meaningful heterogeneity. The scDALI (single-cell differential allelic imbalance) framework has been developed specifically for this purpose, enabling researchers to identify context-dependent genetic regulation across cell types and states [36].
Experimental Design Considerations:
- Utilize F1 hybrid systems from crossed inbred strains or natural genetic variation in outbred populations
- Ensure sufficient sequencing depth (recommended >100,000 reads per cell) to confidently call allele-specific expression
- Incorporate UMIs to control for amplification biases in quantitative analysis
- Process a sufficient number of cells (typically >1,000 per condition) to power statistical detection of heterogeneous effects
scDALI Analytical Workflow:
- Genetic Variant Calling: Identify informative single-nucleotide polymorphisms (SNPs) from sequencing data
- Allele-Specific Quantification: Assign RNA molecules to parental alleles based on informative SNPs
- Cell State Manifold Construction: Define cellular states using total expression patterns independent of allelic information
- Statistical Modeling: Apply Beta-Binomial generalized linear mixed models to test for homogeneous and heterogeneous allelic effects
- Visualization and Interpretation: Map allelic imbalance patterns onto developmental trajectories
The scDALI model tests three specific hypotheses: scDALI-Hom identifies consistent allelic imbalance across all cell states; scDALI-Het detects effects that vary significantly across cell types or states; and scDALI-Joint provides a combined test for either type of effect [36]. This approach has been validated in both Drosophila embryogenesis and human iPSC differentiation, demonstrating its versatility across model systems and developmental contexts.
Key Insights into Developmental Regulation of Allelic Expression
Application of allelic expression analysis to developing Drosophila embryos revealed hundreds of regulatory regions with cell-type-specific allelic effects during embryogenesis, with some enhancer-like regions showing opposing allelic imbalance in different cell lineages [36]. In human iPSC differentiation systems, scDALI analysis uncovered how subtle differences in cell states can substantially affect allelic regulation, highlighting the dynamic nature of genetic regulation during developmental transitions [36].
These allelic effects manifest as significant deviations from the expected 0.5 allelic ratio in autosomal genes of diploid organisms, with heterogeneous effects showing distinct patterns across pseudotemporal ordering of cells. The ability to detect these patterns without requiring a priori definition of discrete cell states makes scDALI particularly valuable for analyzing continuous developmental processes where clear boundaries between cell states may not exist.
Integrated Workflow: Combining Isoform and Allelic Analysis
The integration of isoform diversity mapping with allelic expression analysis provides a comprehensive view of transcriptional regulation during development. The following workflow represents an optimized approach for simultaneous characterization of both layers of regulation:
This integrated approach has been successfully implemented in systems such as human retinal organoids, where researchers simultaneously profiled chromatin accessibility, gene expression, and isoform diversity to reveal concordant regulatory dynamics [35]. The implementation of scRICA-seq (single-cell RNA isoform and chromatin accessibility sequencing) demonstrates how short-read sequencing can be leveraged to capture full-length isoform information through UMI-based molecular tagging and circular cDNA amplification strategies [35].
Technical Considerations and Protocol Optimization
Critical Protocol Decisions for Developmental Studies
When applying Smart-seq2 and related methods to developmental systems, several technical considerations require special attention:
RNA Input and Quality:
- Developmental tissues often yield limited cell numbers; optimize lysis conditions for small cell sizes
- Account for varying RNA content across different developmental stages
- Implement rigorous RNA quality assessment, particularly for primary tissue samples
Amplification Bias Mitigation:
- Carefully titrate PCR cycle numbers to maintain representation while generating sufficient material
- Consider UMI incorporation (Smart-seq3, FLASH-seq with UMIs) for precise molecular counting
- Implement quality controls for amplification evenness and coverage uniformity
Single-Cell Isolation Method Selection:
- FACS provides visual confirmation of single-cell isolation but requires specialized equipment
- Microfluidic platforms offer higher throughput but may increase multiplet rates
- Combinatorial indexing methods (SPLiT-seq) avoid physical isolation but have distinct bioinformatic requirements
Emerging Methodological Innovations
Recent technological advances are expanding the possibilities for isoform and allelic analysis in developmental systems:
Long-Read scRNA-seq: Platforms from PacBio and Oxford Nanopore enable direct sequencing of full-length transcripts without assembly, though currently at higher cost and error rates than short-read methods [31] [33].
Multi-Omic Integration: Methods like scRICA-seq simultaneously profile chromatin accessibility and full-length RNA isoforms within the same single cells, revealing how epigenetic landscapes influence isoform selection [35].
Spatial Transcriptomics: Approaches combining laser capture microdissection with Smart-seq2 (LCM-seq) or cost-effective microneedle-based capture (MSN-seq) add spatial context to isoform expression patterns within tissue architecture [8].
The application of Smart-seq2 and related full-length scRNA-seq methods to developmental systems has fundamentally expanded our understanding of how transcript isoform diversity and allelic expression heterogeneity contribute to cellular differentiation and tissue patterning. By moving beyond simple gene-level quantification to examine the precise structures of transcribed RNAs, researchers can now identify isoform switching events that mark developmental transitions and uncover cell-type-specific allelic regulation that would be masked in bulk analyses.
As these methodologies continue to evolve—with improvements in sensitivity, throughput, and multi-omic integration—they promise to reveal even finer details of the regulatory mechanisms governing development. The ongoing development of computational tools like scDALI for detecting context-specific genetic effects ensures that the analytical frameworks keep pace with the technological advancements in data generation. For researchers investigating developmental processes, the strategic application of these full-length transcriptome methods provides a powerful approach to dissect the complex interplay between genetic variation, transcriptional regulation, and cellular identity formation.
Optimizing Smart-seq2 Performance: Practical Strategies for Enhanced Sensitivity and Reliability in Stem Cell Work
The Smart-seq2 protocol is a cornerstone of full-length single-cell RNA sequencing (scRNA-seq), enabling researchers to investigate transcriptomes with the sensitivity required to detect splice isoforms, allelic variants, and single-nucleotide polymorphisms (SNPs) [5]. Despite its robustness, common technical challenges including low cDNA yield, 3'/5' bias, and amplification artifacts can compromise data quality. For research in stem cell biology, where sample material is often scarce and transcriptomic information is complex, optimizing this protocol is paramount. This application note details the root causes of these pitfalls and provides actionable, optimized methodologies to overcome them, drawing on both the original Smart-seq2 framework and subsequent technological advancements.
Pitfall 1: Low cDNA Yield
Low cDNA yield is a frequent issue when working with cells of low RNA content, such as certain stem cell populations, and can lead to failed library preparations or insufficient sequencing depth.
Root Causes and Strategic Solutions
The primary causes of low cDNA yield are inefficient reverse transcription and suboptimal template switching, the critical initial steps in the SMART-seq workflow. The following solutions address these points directly.
- Use of a More Processive Reverse Transcriptase: Replacing the Superscript II reverse transcriptase with the more processive Superscript IV (SSRTIV) can significantly boost cDNA output. This change enhances the efficiency of full-length cDNA synthesis, particularly for longer transcripts [10].
- Optimization of Template-Switching Efficiency: Increasing the concentration of dCTP in the reaction mix favors the C-tailing activity of the reverse transcriptase. This, in turn, improves the template-switching reaction, a key step in the SMART technology for capturing the complete 5' end of transcripts [10].
- Reaction Miniaturization: Reducing the reaction volume, for example from 25 µl to 5 µl, increases reagent concentration and reaction efficiency, leading to higher cDNA yields from the same number of PCR cycles [10] [5].
Table 1: Reagent Modifications to Improve cDNA Yield
| Reagent/Parameter | Typical Smart-seq2 Protocol | Optimized Modification | Impact on cDNA Yield |
|---|---|---|---|
| Reverse Transcriptase | Superscript II | Superscript IV | Increased full-length cDNA synthesis and yield [10] |
| dCTP Concentration | Standard concentration | Increased concentration | Boosts template-switching efficiency [10] |
| Reaction Volume | 25 µl | 5 µl | Increases reaction efficiency and yield [10] [5] |
Optimized Protocol for High cDNA Yield
- Cell Lysis: Transfer a single cell directly into a lysis buffer containing a recombinase protease [4].
- Reverse Transcription (RT) and cDNA Preamplification: Perform RT and preamplification in a single, combined step to streamline the workflow and reduce hands-on time.
- Thermal Cycling:
- Incubate at 42°C for 90 minutes (reverse transcription).
- Follow with 21 cycles of PCR for cDNA preamplification [10].
- Purification: Purify the amplified cDNA using a solid-phase reversible immobilization (SPRI) bead-based clean-up system [4].
Pitfall 2: 3'/5' Bias
A bias towards the 3' end of transcripts prevents the accurate detection of full-length sequences, undermining one of the primary advantages of the Smart-seq2 method.
Root Causes and Strategic Solutions
3'/5' bias often stems from incomplete reverse transcription and degradation of the template-switching oligonucleotide (TSO). The solutions focus on preserving the integrity of the 5' end capture.
- TSO Redesign to Prevent Degradation: The locked nucleic acid (LNA) guanylate at the 3' end of the original Smart-seq2 TSO is prone to degradation, which impairs 5' capture. Replacing the LNA guanosine with riboguanosine creates a more stable and effective TSO [10] [5].
- Use of UMIs with a Spacer Sequence: While integrating unique molecular identifiers (UMIs) at the 5' end (as in Smart-seq3) aids in quantifying PCR duplicates, placing the UMI directly adjacent to the riboguanosines can cause "strand-invasion" artifacts. These artifacts create falsely truncated molecules and skew gene counts. Adding a 5-nucleotide spacer sequence between the UMI and the riboguanosines effectively prevents this issue [10].
Table 2: Strategies to Minimize 3'/5' Bias and Artifacts
| Strategy | Mechanism of Action | Result |
|---|---|---|
| Riboguanosine TSO | Replaces degradation-prone LNA in the Template-Switching Oligo | Improved 5' end capture and full-length coverage [10] [5] |
| Spacer in UMI-TSO | Adds a 5-nt spacer between UMI and riboguanosines | Prevents strand-invasion artifacts, ensuring accurate transcript representation [10] |
| Molecular Crowding (PEG) | Adds 5% polyethylene glycol to the RT mix | Reduces RNA secondary structures, improving reverse transcription efficiency [5] |
Optimized Protocol for Full-Length Coverage
- Template-Switching Oligo: Use a TSO with a sequence of
AAGCAGTGGTATCAACGCAGAGTACATrGrGrG(whererGis riboguanosine) [10]. - For UMI Incorporation: If UMIs are required for precise quantification, use a TSO with a spacer:
AAGCAGTGGTATCAACGCAGAGTAC- [8nt UMI] - [5nt Spacer] -rGrGrG[10]. - Reverse Transcription Mix: Include 5% polyethylene glycol (PEG) in the RT mix to promote molecular crowding, which helps resolve RNA secondary structures [5].
Pitfall 3: Amplification Artifacts
Amplification artifacts, such as chimeric sequences and PCR biases, can distort the true representation of the transcriptome and lead to erroneous biological conclusions.
Root Causes and Strategic Solutions
These artifacts are primarily introduced during the aggressive PCR amplification necessary for scRNA-seq. The following modifications help control and correct for these issues.
- Incorporation of Unique Molecular Identifiers (UMIs): Integrating UMIs into the TSO allows for bioinformatic correction of PCR amplification biases. After sequencing, reads originating from the same original mRNA molecule can be deduplicated based on their UMI, enabling accurate digital counting of transcripts [5] [37].
- Optimized Preamplification Cycle Number: An excessive number of PCR cycles exacerbates amplification artifacts and background noise. Titrating the cycle number to the minimum required for successful library generation is crucial. For high-RNA content cells (e.g., HEK293T), 10-12 cycles may suffice, while low-RNA content cells (e.g., PBMCs) may require 14-16 cycles [10].
- cDNA Normalization: Prior to library preparation, normalizing cDNA concentrations across all samples ensures consistent input. This step minimizes variability in library complexity and size, leading to more uniform sequencing depth and reduced technical artifacts [37].
Optimized Protocol to Minimize Amplification Artifacts
- UMI Integration: Use the UMI-containing TSO with a spacer as described above.
- Cycle Titration: Perform a pilot experiment to determine the optimal preamplification PCR cycle number for your specific cell type. Start with 12 cycles for robust cells and 16 for sensitive cells, adjusting based on cDNA yield measurements [10].
- cDNA Purification and Quantification: Purify preamplified cDNA with SPRI beads to remove enzymes and primers. Precisely quantify the cDNA using a fluorescence-based assay (e.g., Qubit) [37].
- cDNA Normalization: Normalize all samples to a uniform concentration (e.g., 100 pg/µL) before proceeding to tagmentation or library preparation [37].
The Scientist's Toolkit: Essential Reagents and Materials
The following table lists key reagents and their critical functions in an optimized Smart-seq2 workflow.
Table 3: Key Research Reagent Solutions
| Reagent/Material | Function | Optimization Note |
|---|---|---|
| Superscript IV Reverse Transcriptase | Synthesizes first-strand cDNA from cellular mRNA | More processive than Superscript II; increases yield and full-length coverage [10]. |
| Riboguanosine TSO | Binds to non-templated C-overhang on cDNA for 5' end capture | Replaces LNA-guanylate; reduces degradation and improves 5' completeness [10] [5]. |
| Betaine & MgCl₂ | PCR additives that enhance specificity and yield | Reduces secondary structures; critical for robust cDNA amplification [4] [5]. |
| UMI with Spacer | Unique Molecular Identifier for accurate transcript counting | Spacer prevents strand-invasion artifacts; enables digital gene expression [10]. |
| SPRI Beads | Solid-phase reversible immobilization for nucleic acid purification | Used for cDNA and library clean-up; removes primers, dimers, and enzymes [4]. |
| Polyethylene Glycol (PEG) | Molecular crowding agent | Added to RT mix; improves reverse transcription efficiency by compacting RNA [5]. |
Visualizing the Optimized Smart-seq2 Workflow
The diagram below outlines the optimized full-length scRNA-seq workflow, integrating the solutions to common pitfalls described in this note.
By systematically addressing the technical challenges of low cDNA yield, 3'/5' bias, and amplification artifacts, researchers can significantly enhance the reliability and quality of their full-length scRNA-seq data. The optimized protocols and reagent solutions detailed here, including the use of advanced reverse transcriptases, redesigned TSOs, strategic UMI implementation, and rigorous quality control, provide a robust framework for successful stem cell transcriptome research using the Smart-seq2 method.
Within full-length single-cell RNA sequencing (scRNA-seq) workflows, the reverse transcription (RT) step is a critical determinant of success for capturing the complete transcriptome, especially for low-abundance transcripts in sensitive stem cell research [38] [39]. This initial conversion of RNA into complementary DNA (cDNA) lays the foundation for all downstream analysis, and the choice of reverse transcriptase directly impacts sensitivity, accuracy, and the ability to detect full-length transcripts [32]. The Smart-seq family of protocols, including Smart-seq2 and its successors Smart-seq3 and FLASH-seq, are recognized as gold standards for full-length scRNA-seq as they enable the detection of splice isoforms, allelic variants, and single-nucleotide polymorphisms (SNPs) [10] [7] [40]. The integration of highly processive and thermostable reverse transcriptases, such as Superscript IV (SSRTIV), into these protocols has been a key advancement, driving significant improvements in sensitivity and gene detection rates, particularly for genes expressed at low levels [10]. This application note details the strategic selection and use of reverse transcriptases to maximize sensitivity for low-abundance transcripts within the context of a full-length stem cell transcriptome study utilizing the Smart-seq2 protocol.
Reverse Transcriptase Selection Criteria
Selecting the appropriate reverse transcriptase is paramount for maximizing the detection of low-abundance transcripts. Key enzyme properties must be balanced with the specific challenges of single-cell and full-length transcriptomics.
Key Enzyme Properties
The following properties are critical for a reverse transcriptase used in sensitive, full-length scRNA-seq applications:
- Processivity: Refers to the enzyme's ability to synthesize long cDNA molecules without dissociating from the template. High processivity is essential for generating full-length transcripts, which is a hallmark of the Smart-seq2 protocol [38]. This is particularly important for capturing long genes or transcripts with complex secondary structures.
- Thermostability: A thermostable enzyme can function efficiently at elevated temperatures (e.g., 50-55°C). This is crucial for denaturing RNA secondary structures that are common in GC-rich regions, thereby ensuring the reverse transcriptase can read through the entire template and improving the yield of full-length cDNA [38].
- Fidelity: While less frequently discussed in the context of RT for RNA-seq, the accuracy of nucleotide incorporation can be important for applications detecting single-nucleotide variations.
- Reduced RNase H Activity: While some RNase H activity is inherent to wild-type reverse transcriptases and is involved in the template-switching mechanism, engineered enzymes often have reduced RNase H activity. This reduction can help minimize the degradation of the RNA template during first-strand synthesis, leading to longer cDNA products and higher yields [39].
Comparative Performance of Reverse Transcriptases
The table below summarizes the characteristics of different reverse transcriptases relevant to advanced scRNA-seq protocols.
Table 1: Characteristics of Reverse Transcriptases for scRNA-seq
| Reverse Transcriptase | Key Characteristics | Impact on Full-Length scRNA-seq |
|---|---|---|
| Superscript IV (SSRTIV) | High processivity and thermostability [10]. | Increased sensitivity and gene detection; enables shorter RT reaction times; foundational in the FLASH-seq protocol [10]. |
| Smart-Seq2/3 Enzymes | Often use a specific mix to optimize template-switching [32]. | High sensitivity for detecting low-abundance transcripts and a diverse set of isoforms [32] [7]. |
| MMLV-based | Common wild-type enzyme; moderate processivity and thermostability [39]. | A common baseline; may struggle with complex RNA structures compared to engineered variants. |
| HIV-based | Another class of viral reverse transcriptase [39]. | Properties can vary; often benchmarked against MMLV. |
Optimized Protocol for Sensitive Transcript Detection
This protocol is adapted for the Smart-seq2 workflow, incorporating optimizations from next-generation methods like FLASH-seq and Smart-seq3 to maximize sensitivity for low-abundance transcripts [10] [7].
Key Reagents and Equipment
Table 2: Research Reagent Solutions for Sensitive scRNA-seq
| Reagent/Solution | Function | Considerations for Low-Abundance Transcripts |
|---|---|---|
| Superscript IV RTase | Catalyzes first-strand cDNA synthesis from RNA. | Selected for high processivity and thermostability to read through secondary structures and generate full-length cDNA [10]. |
| Template-Switching Oligo (TSO) | Enables cDNA synthesis from the 5' end via template switching. | Use of riboguanosine (rG) in TSO, instead of LNA-G, reduces strand-invasion artifacts, improving isoform detection accuracy [10]. |
| Oligo(dT) Primer | Primer for cDNA synthesis; anchors to mRNA poly-A tail. | The sequence (e.g., dT30VN) and concentration are optimized for full-length reverse transcription [10] [7]. |
| Betaine or TMAC | PCR additives. | Can be used to improve amplification efficiency of GC-rich transcripts, though systematic tests in FS found few universally beneficial additives [10]. |
| Unique Molecular Identifiers (UMIs) | Short random nucleotide sequences. | Incorporated into the TSO (e.g., in Smart-seq3/FS-UMI) to correct for amplification bias and enable accurate digital quantification of transcript molecules [10] [7]. |
Detailed Workflow Steps
Step 1: Cell Lysis and Reverse Transcription In a 384-well plate, lyse single cells. Prepare the RT mix in a larger volume to minimize evaporation effects and ensure reproducibility [10] [7].
- RT Mix Components: Superscript IV, oligo(dT)30VN primer, template-switching oligonucleotide (TSO), dNTPs, and additives (e.g., betaine, MgCl2). FLASH-seq increased the amount of dCTP to favor the C-tailing activity of SSRTIV and boost the template-switching reaction [10].
- Incubation: Perform reverse transcription typically at 42-50°C. The use of SSRTIV allows for a shortened RT reaction time (e.g., 45-90 minutes) while maintaining high sensitivity [10].
- Automation: For high-throughput applications (HT Smart-seq3), use liquid handlers (e.g., Mantis, Integra VIAFLO) to dispense reagents, reducing manual handling errors and variability [7].
Step 2: cDNA Amplification Directly amplify the cDNA from the RT reaction using PCR.
- Cycle Determination: The optimal number of PCR cycles depends on the cell's RNA content. For high-RNA content cells (e.g., HEK293T), 10-12 cycles may suffice. For low-RNA content cells (e.g., lymphocytes or stem cells), 14-16 cycles are often required. A pilot test is recommended to determine the optimal cycle number to avoid under-amplification or excessive amplification bias [10].
- Quality Control: Purify the amplified cDNA and quantify it using a fluorescence-based method (e.g., Qubit or SpectraMax in a 384-well format). This step is crucial for identifying well occupancy and ensuring successful library generation. Normalize cDNA to a uniform concentration (e.g., 100 pg/µL) to ensure consistent input for tagmentation [7].
Step 3: Library Preparation and Sequencing Use a tagmentation-based library preparation method for efficiency.
- Tagmentation: The normalized cDNA is tagmented with Tn5 transposase. The required amount of Tn5 is correlated with the level of cDNA amplification; however, library quality has been shown to be independent of a broad range of Tn5 amounts [10].
- Library Amplification: Amplify the tagmented fragments with indexed primers for a limited number of cycles to create the final sequencing library.
- Sequencing: Sequence on an Illumina platform to a depth appropriate for the study. For full-length coverage, a depth of 250,000 to 500,000 reads per cell is often targeted [10].
The following workflow diagram illustrates the optimized protocol.
Validation and Data Analysis
Assessing Protocol Performance
To validate the success of the optimized protocol, particularly for low-abundance transcripts, the following quality metrics should be evaluated:
- Genes Detected per Cell: The number of unique genes detected is a primary indicator of sensitivity. Protocols like FLASH-seq and HT Smart-seq3 have demonstrated superior gene detection compared to earlier methods like Smart-seq2 and Smart-seq3, especially at lower sequencing depths [10] [7].
- Transcriptome Coverage: Full-length methods should exhibit uniform coverage across the gene body, from the 5' to the 3' end. This can be visualized using gene body coverage plots [10].
- Spike-in Controls: Using synthetic RNA spike-ins (e.g., SIRVs) allows for the assessment of sensitivity and quantitative accuracy across a dynamic range of transcript abundances [41].
- Detection of Low-Abundance and Protein-Coding Genes: The higher sensitivity of advanced protocols favors the capture of a more diverse set of isoforms and genes, especially protein-coding and longer genes [10].
Addressing Artifacts and Improving Accuracy
- UMI Integration for Quantification: Incorporating UMIs into the TSO, as in Smart-seq3 and FS-UMI, allows for the precise counting of original mRNA molecules, correcting for PCR duplication biases. This is crucial for the accurate quantification of low-abundance transcripts [10] [7].
- Mitigating Strand-Invasion Artifacts: The use of a TSO with a spacer sequence between the UMI and the riboguanosines (e.g., -NNNNNNNN-SPACER-rGrGrG) has been shown to prevent strand-invasion artifacts, which can lead to incorrect transcript mapping and biased gene counts [10].
The strategic selection of a highly processive and thermostable reverse transcriptase, such as Superscript IV, is a foundational step in maximizing sensitivity for low-abundance transcripts in full-length scRNA-seq. When integrated into an optimized Smart-seq2-derived workflow that includes a refined TSO design, UMIs for accurate quantification, and careful quality control, researchers can achieve a significant increase in gene detection sensitivity and data quality. This enables a more comprehensive and accurate characterization of the full transcriptome in precious stem cell samples, uncovering rare cell states and subtle regulatory events that are critical for both basic research and drug development.
Within the framework of full-length stem cell transcriptome research using the Smart-seq2 protocol, a significant technical challenge is the occurrence of strand-invasion artifacts during cDNA library construction. These artifacts, primarily driven by suboptimal Template-Switching Oligo (TSO) design, can skew gene expression counts, compromise isoform detection, and ultimately lead to erroneous biological conclusions. This Application Note delineates the molecular mechanisms underpinning strand-invasion, provides a quantitative comparison of TSO design variants, and presents a optimized, experimentally-validated protocol for TSO design and implementation to minimize these artifacts, thereby enhancing the fidelity of single-cell RNA sequencing data.
The switching mechanism at the 5' end of the RNA transcript (SMART) technology, exemplified by the Smart-seq2 protocol, is a cornerstone of full-length single-cell RNA sequencing (scRNA-seq). Its reliance on the template-switching activity of Moloney Murine Leukemia Virus (MMLV) reverse transcriptase (RT) allows for the capture of complete transcript sequences, which is indispensable for profiling splice isoforms, allelic variants, and single-nucleotide polymorphisms in stem cell populations [1] [5].
A critical component of this system is the Template-Switching Oligo (TSO). During reverse transcription, upon reaching the 5' end of an RNA template, the RT enzyme exhibits a terminal transferase activity, adding a few untemplated deoxycytosines (dC) to the 3' end of the nascent cDNA. A well-designed TSO, which typically contains riboguanosines (rG) at its 3' end, can base-pair with this dC overhang. This allows the RT to "switch" templates from the original mRNA to the TSO, thereby appending a universal primer-binding sequence to the complete cDNA [1] [3].
However, the incorporation of Unique Molecular Identifiers (UMIs) adjacent to the anchoring rGrGrG sequence in advanced protocols like Smart-seq3 has been linked to strand-invasion artifacts [42] [23] [10]. In this phenomenon, the UMI sequence at the 3' end of the TSO can mis-prime by annealing to and "invading" internal G-rich sequences in the cDNA, rather than faithfully anchoring to the dC overhang. This generates chimeric cDNA molecules and falsely truncated reads, biasing gene quantification and compromising the accuracy of isoform-level analysis [42] [10].
Key Design Principles to Minimize Strand-Invasion
Extensive empirical research has identified several key TSO design parameters that significantly influence the rate of strand-invasion artifacts. The following principles are critical for optimizing TSO performance:
Incorporation of a Spacer Sequence: Introducing a short, defined spacer sequence (e.g., 5 nucleotides) between the UMI and the 3' rGrGrG anchor is one of the most effective strategies. This spatial separation physically impedes the UMI from participating in aberrant priming events at internal sites, thereby preserving its function for accurate molecule counting without promoting invasion [42] [10].
Optimization of 3' End Chemistry: The chemical composition of the nucleotides at the TSO's 3' end profoundly affects annealing specificity and thermostability. While early Smart-seq2 protocols used a locked nucleic acid (LNA)-modified guanosine at the terminal position to enhance stability [5], evidence suggests this can increase strand-invasion propensity [42] [10]. Reverting to standard riboguanosines (rG) has been shown to reduce these artifacts while maintaining efficient template switching [42] [10]. Furthermore, chimeric DNA/RNA oligonucleotides have demonstrated superior specificity for capped mRNA 5'-ends compared to DNA-LNA hybrids [1] [3].
Use of Non-Natural Nucleotides: To reduce background cDNA synthesis and TSO concatenation, incorporating non-natural isonucleotides (e.g., iso-dC and iso-dG) at the 5' end of the TSO has proven effective. These isomers form stable base pairs with each other but not with natural nucleotides, thereby minimizing TSO self-hybridization and mis-priming events that contribute to background noise [1] [3].
The logical relationships between TSO design choices and their biochemical consequences are summarized in the diagram below.
Comparative Performance of TSO Designs
The impact of different TSO designs on protocol performance and artifact generation has been quantitatively assessed in recent studies. The following table synthesizes key comparative data, providing a clear overview for researchers selecting a TSO strategy.
Table 1: Quantitative Comparison of TSO Design Performance in scRNA-seq Protocols
| TSO Design & Protocol | Key Design Features | Strand-Invasion Indicators | Gene Detection Performance | Key Advantages / Disadvantages |
|---|---|---|---|---|
| Smart-seq3 (Original) [42] [23] [10] | -NNNNNNNN-rGrGrG | >4.25% of deduplicated 5' UMI reads show perfect match to upstream genomic sequence [10] | Baseline | Disadvantage: High rate of strand-invasion artifacts. |
| FS-UMI & Smart-seq3xpress (Improved) [42] [23] [10] | -NNNNNNNN-SPACER-rGrGrG | Spacer addition prevents most strand-invasion events [10] | Detects ~8% more genes and ~18% more isoforms than SS3 at 250K raw reads [10] | Advantage: Greatly reduced artifacts while maintaining high sensitivity. |
| FLASH-seq (FS) [42] [10] [5] | Replaced 3'-terminal LNA-G with rG; increased dCTP concentration | Reduced strand-invasion artifacts [42] [10] | 8x more cDNA yield; detects more genes than SS2/SS3 [10] [5] | Advantage: High sensitivity and speed; excellent for full-length coverage. |
| Iso3TS Modified TSO [1] [3] | Incorporates iso-dC and iso-dG at 5' end | Reduces background cDNA synthesis from mis-priming [1] [3] | Improves cDNA synthesis from very small RNA samples [1] | Advantage: Minimizes background and TSO concatenation. |
Optimized Experimental Protocol for TSO Evaluation and Implementation
This section provides a detailed protocol for integrating and validating a low-artifact TSO design into a Smart-seq2 workflow for stem cell transcriptome research.
Recommended TSO Sequences
The following TSO sequences have been empirically validated to minimize strand-invasion:
- Standard TSO (for non-UMI protocols):
AAGCAGTGGTATCAACGCAGAGTACATrGrGrG[1] - UMI-TSO with Spacer (for UMI-based quantification):
AAGCAGTGGTATCAACGCAGAGTACATNNNNNNNNACATGrGrGrG(whereNNNNNNNNis the UMI andACATGis a 5-nt spacer) [42] [10]
Reagent Setup
Table 2: The Scientist's Toolkit - Essential Reagents for TSO-Based scRNA-seq
| Item | Function / Description | Example / Specification |
|---|---|---|
| Template-Switching RT Enzyme Mix | Provides reverse transcriptase with high template-switching activity and terminal transferase activity. | MMLV-derived RT (e.g., Superscript IV, Maxima H-minus, or NEB M0466 mix) [42] [43] |
| Optimized TSO | Chimeric DNA/RNA oligo that binds cDNA dC overhang to add universal sequence. | HPLC or RNase-free purified; resuspended in nuclease-free water or TE buffer. [1] |
| Oligo(dT) Primer | Primes reverse transcription from the poly-A tail of mRNAs. | e.g., oligo(dT)30VN [42] |
| PCR Preamplification Mix | Amplifies full-length cDNA after reverse transcription. | Use a polymerase compatible with direct tagmentation if desired (e.g., SeqAmp) [23] |
| Tagmentation Enzyme (Tn5) | Fragments and tags amplified cDNA for NGS library construction. | Commercial or in-house Tn5 [23] |
Step-by-Step Workflow
The complete workflow, from cell lysis to a sequencing-ready library, integrating the optimized TSO is outlined below.
- Cell Lysis. Sort single stem cells into a lysis buffer containing dNTPs and the oligo(dT) primer.
- Reverse Transcription with Template Switching.
- cDNA Preamplification.
- Library Preparation via Tagmentation.
- Use the preamplified cDNA directly for tagmentation with Tn5 transposase.
- The amount of Tn5 can be titrated significantly to reduce costs without substantial loss of library complexity [23].
- Library Amplification and Sequencing.
- Amplify the tagmented DNA with primers containing Illumina adapter sequences and sample indexes.
- Purify the final library and assess quality before sequencing.
Quality Control and Artifact Detection
To validate the success of the optimized TSO, the following QC measures are recommended:
- Bioanalyzer/TapeStation: Confirm the cDNA after preamplification has a broad distribution (0.5-5 kb).
- Sequencing Data Analysis:
- UMI Match Analysis: Deduplicate 5' UMI reads and check for perfect or near-perfect matches between the UMI sequence and the genomic sequence immediately upstream of the read start site. A rate above ~1-2% suggests significant strand-invasion [10].
- GGG Motif Enrichment: Check for an over-representation of a 'GGG' nucleotide motif adjacent to the start of deduplicated 5' UMI reads, which is indicative of invasion at internal G-rich sites [10].
- Feature Distribution: Anomalously high proportions of intronic or antisense reads can also be a symptom of artifactual priming [10].
The integrity of full-length transcriptome data in stem cell research is critically dependent on the biochemical fidelity of the library preparation process. By adopting a TSO design that incorporates a spacer sequence between the UMI and the rGrGrG anchor and utilizes standard riboguanosines over LNA-modified bases, researchers can significantly reduce strand-invasion artifacts. The optimized protocol detailed herein, built upon the robust Smart-seq2 framework, provides a reliable path to obtaining more accurate gene expression quantifications and isoform detection, thereby empowering more confident discoveries in stem cell biology and drug development.
Within the context of full-length stem cell transcriptome research, the Smart-seq2 protocol has established itself as a gold standard for its high sensitivity and ability to sequence full-length transcripts, enabling the discovery of novel isoforms, allelic variants, and single-nucleotide polymorphisms [10] [32]. However, its widespread application, particularly in large-scale studies, has been hampered by its labor-intensive nature, relatively high cost per cell, and limited throughput [7]. These challenges are particularly acute in stem cell research, where sample sizes may be small and the need to characterize rare subpopulations is critical.
This application note details how miniaturization and automation of the Smart-seq2 protocol and its successors directly address these limitations. By significantly reducing reagent volumes and incorporating robotic liquid handling, researchers can achieve substantial cost savings, increase throughput, and enhance experimental reproducibility, all while maintaining the high-quality data output essential for groundbreaking stem cell research [44] [7].
Performance Benchmarks: Quantitative Gains from Optimization
The transition from manual Smart-seq2 to miniaturized and automated protocols yields concrete, measurable benefits. The following table summarizes key performance metrics as reported in recent studies and technical notes.
Table 1: Performance Comparison of Smart-seq Protocol Implementations
| Protocol | Key Modification | Reaction Volume | Hands-On Time | Gene Detection Sensitivity | Approximate Cost per Cell |
|---|---|---|---|---|---|
| Smart-seq2 (Standard) | Manual, full-volume | ~25-30 µL [10] | High (e.g., ~7 hours) [10] | Baseline (Gold standard) [32] | Higher |
| FLASH-seq (FS) | Combined RT-PCR, SSRTIV enzyme | 5 µL (miniaturized) [10] | ~1-4.5 hours [10] | Higher than SS2/SS3 in HEK293T cells [10] | Reduced |
| HT Smart-seq3 | Automated, miniaturized | Not Specified | Significantly reduced [7] | High gene detection, lower dropout rates [7] | ~$0.50 (cDNA) + $7.50 (library) + $7.50 (sequencing) [7] |
| Takara SMART-Seq V3 | Automated Miniaturization | 3.5 µL (from 7 µL) [44] | Reduced via automation | Higher sensitivity than Smart-seq2 [45] | 2x cost saving [44] |
These optimizations do not compromise data quality. For instance, the automated HT Smart-seq3 workflow demonstrates higher cell capture efficiency and greater gene detection sensitivity compared to droplet-based methods like the 10X Genomics platform, while also achieving a comparable resolution of cellular heterogeneity when sufficiently scaled [7]. Similarly, FLASH-seq reports detecting more genes and a more diverse set of isoforms compared to earlier protocols [10].
Automated High-Throughput Workflow: A Detailed Protocol
This section provides a detailed methodology for implementing an automated, high-throughput workflow based on the Smart-seq3 protocol, which builds upon the Smart-seq2 foundation [7].
The automated process transforms a traditionally manual and sequential protocol into a parallelized, efficient pipeline. The following diagram illustrates the key stages.
Step-by-Step Experimental Methodology
Part I: Cell Isolation and Lysis
- Cell Collection: Isolate single cells using Fluorescence-Activated Cell Sorting (FACS). To minimize evaporation during prolonged sorting, collect cells into 96-well plates containing lysis buffer instead of 384-well plates. This change can reduce sorting time from ~8 minutes to ~2 minutes per plate, achieving over 95% well occupancy [7].
- Cell Lysis: Following sorting, seal the plates and centrifuge briefly. Incubate the plates to ensure complete cell lysis. The plates can be stored at -80°C or proceed directly to reverse transcription.
Part II: Reverse Transcription and cDNA Amplification
- Automated Reaction Setup: Using an integrated liquid handling system (e.g., combining Mantis and Integra VIAFLO systems), dispense the reverse transcription and pre-amplification mix into the 96-well plates [7].
- Thermal Cycling: Transfer the plates to a thermocycler to execute the combined reverse transcription and cDNA pre-amplification protocol. Key modifications from standard Smart-seq2 include using more processive enzymes (e.g., Superscript IV) and optimizing reaction times, which can reduce this phase to under 4.5 hours [10].
Part III: cDNA Quality Control and Normalization (Critical Gating Step)
- cDNA Purification: Purify the amplified cDNA using a magnetic bead-based clean-up protocol (e.g., with AMPure XP beads) on an automated 96-well magnet plate. This step is essential to remove residual oligos and dNTPs that can interfere with accurate quantification [7] [46].
- cDNA Quantification: Quantify cDNA yield using a fluorescence-based assay (e.g., Qubit dsDNA HS Assay). This serves as a critical early quality control check to assess well occupancy and cDNA generation success before committing to more expensive library preparation. To reduce costs for thousands of samples, modify the assay to use reduced reagent volumes in a 384-well plate format and read with a fluorescence microplate reader, cutting the cost per plate from ~$120 to ~$20 [7].
- cDNA Normalization: Precisely normalize cDNA concentrations across all samples to a uniform input (e.g., 100 pg/µL) for library preparation. Automation is key here; use a liquid handler to dispense calculated volumes of diluent and then transfer a fixed volume of cDNA to each well. This ensures consistent library preparation and even read distribution during sequencing [7].
Part IV: Library Preparation and Sequencing
- Tagmentation-Based Library Prep: Use an automated system to prepare sequencing libraries via tagmentation (e.g., with a Nextera XT kit). This approach is faster and more amenable to automation than traditional fragmentation and ligation methods [10] [46].
- Library QC and Pooling: Purify the final libraries, quantify, and assess quality (e.g., using an Agilent Bioanalyzer High Sensitivity DNA kit). Pool normalized libraries for multiplexed sequencing on an Illumina platform [7] [46].
The Scientist's Toolkit: Essential Research Reagent Solutions
Successful implementation of a miniaturized and automated protocol relies on specific reagents and equipment. The following table catalogs key solutions.
Table 2: Essential Reagents and Tools for Protocol Miniaturization and Automation
| Item Name | Function/Description | Protocol Role |
|---|---|---|
| Superscript IV (SSRTIV) | Reverse transcriptase with high processivity | Increases sensitivity, reduces reverse transcription time [10] |
| Template Switching Oligo (TSO) with Riboguanosine | Oligo for cDNA template switching during RT | Reduces strand-invasion artifacts compared to LNA-containing TSOs [10] |
| UMI-containing TSO with Spacer | Template Switching Oligo with Unique Molecular Identifier and spacer sequence | Enables accurate transcript counting; spacer prevents strand-invasion [10] |
| Mosquito HV Genomics | Automated liquid handler for nanoliter volumes | Enables precise miniaturization of reactions down to 500 nL [44] |
| Mantis / Integra VIAFLO | Benchtop liquid handling systems | Facilitates automated reagent dispensing in 96/384-well formats [7] |
| AMPure/RNAClean XP Beads | Magnetic SPRI beads | Used for automated, high-throughput cDNA and library purification [7] [46] |
Critical Technical Notes
- Optimization is Required: The optimal number of cDNA pre-amplification cycles depends on the RNA content of the starting cells. For large cells like HEK293T, 10-12 cycles may suffice, while for cells with lower RNA content (e.g., T-cells), 14-16 cycles may be necessary. A pilot test is recommended to determine the ideal cycle number for your cell type [10].
- Evaporation Management: Miniaturized reactions are highly susceptible to evaporation. Strategies to mitigate this include using a hydrophobic overlay oil during critical reactions or, as in HT Smart-seq3, using 96-well plates for initial cell capture to reduce plate exposure time during sorting [7].
- cDNA QC is Non-Negotiable: Skipping cDNA purification and quantification to save time leads to unreliable quantification and failed library preparations. This QC loop is a critical gating step that saves resources in the long run [7].
The miniaturization and automation of the Smart-seq2 protocol, as exemplified by developments like FLASH-seq and HT Smart-seq3, represent a significant advancement for full-length single-cell transcriptomics. By adopting these strategies, researchers working with stem cells can achieve higher throughput, reduce costs substantially, and improve the robustness of their data generation. This enables larger-scale, more powerful experiments designed to unravel the complexity and heterogeneity of stem cell populations.
Benchmarking Smart-seq2: How It Stacks Up Against Smart-seq3, FLASH-seq, and Droplet-Based Methods
Single-cell RNA sequencing (scRNA-seq) has revolutionized our understanding of cellular heterogeneity, particularly in stem cell research. Among the various technologies available, plate-based full-length transcript methods offer superior sensitivity and transcript coverage compared to droplet-based methods, enabling detection of splice isoforms, allelic variants, and single-nucleotide polymorphisms (SNPs) [5]. The Smart-seq2 protocol, long considered the gold standard for full-length plate-based scRNA-seq, provides excellent sensitivity but lacks molecular counting capabilities [5]. Smart-seq3 represents a significant evolution of this technology, introducing unique molecular identifiers (UMIs) for accurate transcript quantification while maintaining full-length coverage [5]. This application note examines the technical trade-offs between these methodologies within the context of stem cell transcriptome research, providing researchers with a framework for protocol selection based on their specific experimental requirements.
Technical Comparison: Smart-seq2 vs. Smart-seq3
Core Methodological Differences
Smart-seq3 incorporates several key modifications to the Smart-seq2 workflow that enhance its performance and introduce molecular counting capabilities:
- Reverse Transcriptase Optimization: Smart-seq3 utilizes Maxima H-minus reverse transcriptase for enhanced sensitivity compared to the Superscript II used in Smart-seq2 [5] [47].
- Reaction Buffer Improvements: The protocol replaces KCl with NaCl during reverse transcription to reduce RNA secondary structures and adds 5% polyethylene glycol to increase beneficial molecular crowding [5].
- Template-Switching Oligo (TSO) Redesign: Smart-seq3 incorporates a completely redesigned TSO with an 11-bp tag sequence, an 8-bp UMI, and three riboguanosines to hybridize to the non-templated overhang at the end of single-stranded cDNA [5] [47].
- UMI Integration: The most significant advancement is the inclusion of 5' unique molecular identifiers, enabling researchers to control for PCR amplification biases computationally while maintaining full-length transcript coverage [5].
Table 1: Key Protocol Improvements in Smart-seq3 Over Smart-seq2
| Parameter | Smart-seq2 | Smart-seq3 |
|---|---|---|
| Reverse Transcriptase | Superscript II | Maxima H-minus |
| Salt Conditions | KCl | NaCl |
| Molecular Crowding Reagent | Not included | 5% PEG |
| TSO Design | LNA guanylate | 11-bp tag + 8-bp UMI + rGrGrG |
| UMI Incorporation | No | Yes |
| Sensitivity | Standard | Enhanced (detects thousands more transcripts) |
Performance Benchmarks
Independent benchmarking studies demonstrate that Smart-seq3 detects thousands more transcripts per cell compared to Smart-seq2 and significantly improves cell-to-cell gene expression profile correlations [5]. The quantitative benefits of UMI integration include:
- Enhanced Sensitivity: Smart-seq3 enables detection of thousands more transcripts per cell compared to Smart-seq2 [5].
- Improved Correlation: Significantly boosted cell-to-cell gene expression profile correlations, indicating higher technical reproducibility [5].
- Reduced Amplification Bias: UMIs enable computational correction for PCR amplification biases, providing more accurate transcript quantification [48].
The UMI Dilemma: Benefits vs. Technical Complexity
Advantages of UMI Integration
The incorporation of unique molecular identifiers in Smart-seq3 addresses a fundamental limitation of Smart-seq2 by enabling precise molecular counting that corrects for PCR amplification bias [48]. In single-cell RNA sequencing, the limited starting material requires substantial amplification, making UMI correction particularly valuable for accurate transcript quantification [48]. This technical advancement provides researchers with two types of information from the same library: UMI-containing reads for precise quantification and non-UMI internal reads for comprehensive isoform detection [48].
For stem cell research, this dual-information approach is particularly valuable when studying heterogeneous populations where both quantitative expression differences and isoform variations may contribute to functional specialization. The ability to precisely quantify transcript numbers while maintaining full-length coverage makes Smart-seq3 especially suitable for investigating rare stem cell subpopulations where accurate quantification is essential.
Limitations and Added Complexities
Despite the theoretical advantages, UMI implementation in full-length protocols introduces several technical challenges:
- Partial Tagmentation Requirement: To capture UMI information present at the 5' end of the TSO, users must perform partial tagmentation, resulting in libraries of 500-2000 bp [5]. These long molecules bind poorly to sequencing flow cells, potentially decreasing sequencing efficiency [5].
- UMI Recovery Inefficiency: As UMIs are only present at the 5' end of transcripts, only a fraction are recovered, typically resulting in a 20-30% loss of detected genes when counting UMIs exclusively [5].
- Strand Invasion Artifacts: Independent studies have observed that adding UMIs close to the 3' end of the TSO can result in high percentages of strand invasions, creating falsely truncated molecules and skewing gene counts [5] [10].
- Balancing Challenges: The ratio of internal versus UMI reads can only be fine-tuned by decreasing fragmentation rates, but the optimal ratio is challenging to determine pre-sequencing and must often be inferred post-sequencing [5].
Diagram 1: UMI integration trade-offs in Smart-seq3
Alternative Approaches: FLASH-seq and Smart-seq3xpress
FLASH-seq: Streamlined Full-Length scRNA-seq
FLASH-seq represents a significant advancement developed to address limitations of both Smart-seq2 and Smart-seq3 [5] [10]. This method integrates reverse transcription and cDNA amplification into a single step, reducing the workflow from two days to approximately seven hours [5]. Key improvements include:
- Processive Reverse Transcriptase: Uses Superscript IV for significantly improved average gene lengths, indicating better full-length coverage of longer transcripts [5] [10].
- Enhanced cDNA Yield: Generates eight times more cDNA than Smart-seq protocols for the same number of PCR cycles [5].
- Simplified TSO Design: Replaces LNA guanosine with riboguanosine to reduce strand-invasion artifacts [5] [10].
- UMI Flexibility: The protocol can be performed with or without UMIs based on research needs [5].
FLASH-seq demonstrates significantly higher numbers of genes and transcripts detected per cell compared to both Smart-seq2 and Smart-seq3, along with improved cell-to-cell correlations indicating high technical reproducibility [5]. These features make it particularly suitable for stem cell research where sensitivity and reproducibility are paramount.
Smart-seq3xpress: Miniaturization and Automation
Built upon Smart-seq3, Smart-seq3xpress further optimizes the protocol through miniaturization, reducing reaction volumes to lower costs and enhance scalability [47]. This version maintains the UMI benefits while addressing some complexity issues through workflow automation and reduced reagent consumption.
Table 2: Comparative Analysis of Full-Length scRNA-seq Methods
| Method | Workflow Duration | UMI Support | Genes Detected | Key Advantage | Stem Cell Application |
|---|---|---|---|---|---|
| Smart-seq2 | 2 days [5] | No [5] | Baseline [5] | Robustness, simplicity [5] | Standard full-length profiling |
| Smart-seq3 | 2 days [5] | Yes [5] | Thousands more than SS2 [5] | Molecular counting + full-length [5] | Heterogeneous population analysis |
| FLASH-seq | 7 hours [5] | Optional [5] | Highest in class [5] | Speed + sensitivity [5] | High-throughput screening |
| Smart-seq3xpress | Reduced [47] | Yes [47] | High (comparable to SS3) [7] | Cost-effectiveness [47] | Large-scale studies |
Implementation Strategies for Stem Cell Research
Automated High-Throughput Workflows
Recent advances have enabled automation of Smart-seq3 through integration with liquid handling systems, substantially improving reproducibility and throughput. The HT Smart-seq3 (High-Throughput Smart-seq3) workflow incorporates robotic implementation using systems such as the Mantis and Integra VIAFLO, enabling processing of multiple 384-well plates in parallel [7]. This automation addresses key technical challenges including:
- Well Occupancy Optimization: Switching to 96-well plates for cell collection significantly improves well occupancy rates from approximately 80% to over 95% [7].
- cDNA Normalization: Automated normalization ensures consistent input for library generation, minimizing variability [7].
- Quality Control Integration: Early cDNA quantification serves as a critical quality control checkpoint before proceeding to resource-intensive steps [7].
Diagram 2: Automated HT Smart-seq3 workflow with quality control
Protocol Selection Guidelines for Stem Cell Applications
Choosing the appropriate full-length scRNA-seq method requires careful consideration of experimental goals and technical constraints:
- Smart-seq2 remains suitable for studies where UMIs are not critical and budget constraints exist, particularly when investigating abundant cell populations with high RNA content [5].
- Smart-seq3 is recommended for investigations of heterogeneous stem cell populations where precise transcript quantification is essential, and where researchers have expertise to manage UMI-related complexities [5] [7].
- FLASH-seq offers the best option for rapid turnaround times and maximum sensitivity, particularly valuable for screening applications or when working with low-input samples [5] [10].
- HT Smart-seq3 with automation is ideal for large-scale studies requiring consistent processing of thousands of cells while maintaining single-cell resolution [7].
The Scientist's Toolkit: Essential Research Reagents and Materials
Table 3: Key Research Reagent Solutions for Smart-seq3 Implementation
| Reagent/Category | Function | Implementation Notes |
|---|---|---|
| Maxima H-minus Reverse Transcriptase | cDNA synthesis with reduced RNase activity | Critical for Smart-seq3 sensitivity improvement [5] |
| Template Switching Oligo (TSO) with UMI | Enables template switching and molecular identification | Contains 8-bp UMI + 3 riboguanosines; design affects strand invasion risk [5] [10] |
| Polyethylene Glycol (PEG) | Molecular crowding agent | Enhances reverse transcription efficiency [5] [47] |
| Tn5 Transposase | Library tagmentation | Requires partial tagmentation for UMI recovery in Smart-seq3 [5] |
| Automated Liquid Handlers (Mantis, VIAFLO) | Reagent dispensing and plate handling | Enables high-throughput implementation with 96- and 384-well plates [7] [49] |
| cDNA Quantification Reagents | Quality control checkpoint | Modified Qubit assay with reduced volumes cuts cost from $120 to $20 per 384-well plate [7] |
The integration of UMIs in Smart-seq3 represents both a technical advancement and a methodological compromise. While offering superior quantification accuracy through molecular counting, researchers must carefully weigh these benefits against the added protocol complexity and potential artifacts. For stem cell research applications, we recommend:
- Prioritize Smart-seq3 when studying heterogeneous populations where precise transcript quantification is essential for distinguishing closely related cellular states.
- Consider FLASH-seq for experiments requiring rapid turnaround or maximum sensitivity, particularly when working with rare stem cell populations with limited RNA content.
- Implement automated HT Smart-seq3 for large-scale studies where consistency and throughput are paramount, leveraging the cost savings and reproducibility of robotic workflows.
- Validate UMI recovery efficiency through pilot studies when implementing Smart-seq3, carefully optimizing the balance between UMI-containing and internal reads for your specific stem cell system.
The continued evolution of full-length scRNA-seq technologies provides stem cell researchers with an expanding toolkit for dissecting cellular heterogeneity at unprecedented resolution, with UMI integration representing a valuable but nuanced advancement in this rapidly progressing field.
For researchers investigating the nuanced transcriptomes of stem cells, the Smart-seq2 protocol has long served as the gold standard for full-length, plate-based single-cell RNA sequencing (scRNA-seq). Its superior sensitivity and transcript coverage enabled the detection of splice isoforms, allelic variants, and single-nucleotide polymorphisms (SNPs), which are crucial for understanding cellular identity and differentiation [5]. However, the evolving needs of transcriptional research, including higher throughput and reduced hands-on time, have driven the development of advanced successors. Among these, FLASH-seq (FS) emerges as a transformative protocol that addresses core limitations of previous methods while introducing key innovations. This Application Note details how FLASH-seq provides significant advantages in speed, sensitivity, and the reduction of strand-invasion artifacts, positioning it as a powerful new tool for full-length stem cell transcriptome research.
Technical Comparison: FLASH-seq vs. Smart-seq2 and Smart-seq3
Building upon the Smart-seq2 and Smart-seq3 workflows, FLASH-seq incorporates specific modifications that enhance its performance and practicality for research applications, including the study of stem cells and other complex biological systems [50].
Table 1: Key Modifications in FLASH-seq Protocol Design
| Protocol Component | Smart-seq2 | Smart-seq3 | FLASH-seq |
|---|---|---|---|
| Reverse Transcription | Superscript II | Maxima H-minus | Superscript IV (more processive) |
| Template-Switching Oligo (TSO) | LNA guanidine | 8-bp UMI + rGrGrG (no spacer) | Riboguanosine; Spacer in UMI-TSO to reduce strand-invasion |
| Reaction Steps | Separate RT and PCR | Separate RT and PCR | Combined RT-PCR in a single step |
| Key Additives | Betaine, higher MgCl₂ | PEG, NaCl | Increased dCTP to boost template-switching |
| Protocol Flexibility | Standard version | Includes UMIs by default | Three variants: Standard (FS), Low-Amplification (FS-LA), and UMI (FS-UMI) |
Table 2: Performance and Practicality Comparison
| Performance Metric | Smart-seq2 | Smart-seq3 | FLASH-seq |
|---|---|---|---|
| Total Hands-on Time | ~9-10 hours | ~9-10 hours | ~4.5 hours (FS-LA: <1 hour hands-on) |
| Detected Genes (HEK293T) | Baseline | Thousands more than SS2 | Significantly more than both SS2 and SS3 |
| cDNA Yield | Baseline | Similar to SS2 | 8x more for same number of PCR cycles |
| Cell-to-Cell Correlation | Good | Good | Improved |
| Strand-Invasion Artifacts | Not prominent | Observed | Reduced via spacer in TSO design |
| Suitability for Automation | Moderate | Moderate | High, easily miniaturized to 5µL |
The following workflow diagram illustrates the streamlined process of FLASH-seq compared to traditional SMART-seq protocols.
Figure 1: FLASH-seq offers a streamlined workflow. It combines reverse transcription and preamplification into a single step. The FLASH-seq Low-Amplification (FS-LA) variant can proceed directly to tagmentation without intermediate clean-up, cutting total protocol time to ~4.5 hours [10] [5].
Key Advantages of FLASH-seq
Unmatched Speed and Workflow Efficiency
The most immediate advantage of FLASH-seq is its dramatic reduction in protocol time. The entire process from single cells to sequencing-ready libraries can be completed in approximately 4.5 hours, which is 2-3.5 hours faster than other methods [10]. This is achieved through two key modifications:
- Combined RT-PCR: FLASH-seq integrates the reverse transcription and cDNA preamplification into a single step, eliminating the need for intermediate purification and reducing hands-on time [5].
- Low-Amplification Protocol (FS-LA): Leveraging the high efficiency of the protocol which yields eight times more cDNA than Smart-seq2/3 for the same number of PCR cycles, FS-LA uses fewer preamplification cycles. This allows for direct tagmentation of the cDNA product without purification or intermediate quality control, saving an additional ~2.5 hours and reducing hands-on time to under one hour [10] [51].
Enhanced Sensitivity and Gene Detection
FLASH-seq demonstrates superior sensitivity, detecting significantly more genes and transcript isoforms per cell compared to Smart-seq2 and Smart-seq3 [5]. This heightened sensitivity is critical for stem cell research, where detecting lowly expressed transcription factors and regulatory genes is essential for understanding cell fate decisions. The enhanced performance stems from:
- Use of Superscript IV: This more processive reverse transcriptase improves the conversion of mRNA into cDNA [5].
- Increased dCTP Concentration: This modification favors the C-tailing activity of the reverse transcriptase and boosts the template-switching reaction efficiency [10].
- Miniaturization: The protocol can be efficiently miniaturized to a 5µL reaction volume, which boosts reaction efficiency and increases the detection of genes with higher GC content, particularly in cells with low RNA content like naive T cells [10].
Reduction of Strand-Invasion Artifacts
A critical technical improvement in FLASH-seq is the active reduction of strand-invasion artifacts. This phenomenon occurs when the template-switching oligonucleotide (TSO) binds to an internal sequence of the RNA or cDNA instead of the 5' end, creating an artificially truncated molecule [51]. While designing the FS-UMI variant, developers discovered that the close proximity of the UMI to the terminal rGrGrG sequence in the Smart-seq3 TSO exacerbated this issue [10] [51]. FLASH-seq addresses this by:
- Redesigning the TSO: Replacing the 3'-terminal locked nucleic acid (LNA) guanidine with riboguanosine [5].
- Incorporating a Spacer Sequence: The FS-UMI TSO includes a 5-base pair spacer sequence between the UMI and the riboguanosines, which isolates the two sequences and significantly reduces strand-invasion events [10] [50]. This design prevents the creation of falsely truncated molecules, leading to more accurate gene counts and isoform detection.
Practical Application: Protocols and Reagent Solutions
FLASH-seq offers three distinct protocol variants to suit different research needs, making it highly adaptable for various projects in stem cell biology and drug development.
Table 3: FLASH-seq Protocol Variants and Applications
| Protocol Variant | Key Features | Best For | Protocol Duration |
|---|---|---|---|
| Standard FLASH-seq (FS) | Non-stranded, no UMIs; high sensitivity and simplicity | General gene expression studies; easiest to implement | ~7 hours |
| FLASH-seq Low-Amplification (FS-LA) | Minimal PCR cycles, direct tagmentation; fastest protocol | High-throughput screens; time-sensitive experiments | ~4.5 hours (hands-on <1 hour) |
| FLASH-seq with UMI (FS-UMI) | UMI for molecular counting; spacer to reduce artifacts | Quantitative RNA counting; accurate isoform reconstruction | ~7 hours |
The Scientist's Toolkit: Key Research Reagent Solutions
The following reagents are essential for implementing the FLASH-seq protocol.
Table 4: Essential Reagents for FLASH-seq
| Reagent | Function in Protocol | FLASH-seq Specifics |
|---|---|---|
| Superscript IV Reverse Transcriptase | Synthesizes cDNA from mRNA templates | More processive than Superscript II, leading to higher cDNA yield and sensitivity [5] |
| Template-Switching Oligo (TSO) | Enables addition of universal primer sequence to 5' end of cDNA | Uses riboguanosine instead of LNA guanidine; UMI version includes a 5-bp spacer to reduce artifacts [10] [5] |
| Oligo-dT Primer | Initiates reverse transcription from the poly-A tail of mRNAs | Typically Oligo-dT30VN [10] |
| PCR Mix (with additives) | Preamplifies cDNA for sufficient library input | Optimized buffer; combined with RT step for workflow efficiency [10] |
| Tn5 Transposase | Fragments ("tagments") cDNA and adds sequencing adapters | Amount titrated for optimal performance, especially in FS-LA protocol [10] |
The logical relationship between protocol choices and experimental outcomes is summarized in the following decision diagram.
Figure 2: A decision guide for selecting the appropriate FLASH-seq protocol variant. The choice depends on the need for UMIs, required throughput, and the biological material [10] [50].
FLASH-seq represents a significant leap forward in full-length, plate-based single-cell RNA sequencing. By offering a combination of unprecedented speed, enhanced sensitivity, and superior data quality through the reduction of strand-invasion artifacts, it addresses the core limitations of previous gold-standard methods like Smart-seq2. Its flexibility, through three optimized protocol variants, makes it exceptionally well-suited for a wide range of applications in stem cell transcriptome research, from high-throughput screening to detailed isoform analysis. As the field moves toward larger and more complex experiments, FLASH-seq provides researchers and drug development professionals with a powerful, efficient, and reliable tool to characterize gene expression at high resolution.
Single-cell RNA sequencing (scRNA-seq) has fundamentally transformed our understanding of complex biological systems, proving particularly revolutionary for stem cell research. This technology enables researchers to dissect cellular heterogeneity, identify rare stem cell populations, and map differentiation trajectories at an unprecedented resolution. The core dilemma facing scientists today lies in selecting a protocol that balances transcriptomic depth against cellular throughput. On one end of the spectrum, full-length transcript methods like Smart-seq2 provide comprehensive gene expression information for individual cells. On the other, 3' droplet-based methods like the 10x Genomics Chromium system enable profiling of thousands to millions of cells simultaneously but with limited transcript coverage [52] [53] [54]. For researchers investigating stem cell biology, this choice critically influences the ability to resolve subtle transcriptional states, identify rare subpopulations, and detect alternative splicing events—all key considerations in understanding pluripotency, self-renewal, and lineage commitment.
The selection between these methodologies must be guided by the specific biological questions being addressed. Plate-based Smart-seq2 is renowned for its high sensitivity in gene detection per cell, making it ideal for projects requiring detailed transcriptome characterization from limited cell numbers. In contrast, droplet-based 3' methods excel in large-scale atlas projects where capturing the full spectrum of cellular heterogeneity is paramount, even at the cost of transcriptome completeness [52] [53]. This application note provides a detailed comparison of these approaches, with a specific focus on their application in stem cell transcriptome research, experimental protocols, and practical implementation guidance.
Technical Comparison: Smart-seq2 vs. 3' Droplet Methods
Core Technological Principles
Smart-seq2 is a plate-based, full-length scRNA-seq method that utilizes the Switching Mechanism at the 5' end of RNA Template (SMART) technology. Its protocol involves sorting individual cells into multi-well plates, followed by cell lysis, reverse transcription, and cDNA amplification. Key innovations include a locked nucleic acid (LNA) in the template-switching oligonucleotide (TSO) and optimized reaction conditions that significantly enhance cDNA yield [52] [5]. This method sequences the entire transcript length, enabling detection of exon-exon junctions, identification of splice variants, and characterization of single-nucleotide polymorphisms (SNPs).
3' Droplet-Based Methods (e.g., 10x Genomics Chromium) employ a fundamentally different approach. Individual cells are co-encapsulated with barcoded beads in nanoliter-scale water-in-oil droplets within microfluidic devices. Within each droplet, cell lysis occurs, and mRNA molecules are captured by oligo(dT) primers on the beads, each containing a unique cellular barcode and a unique molecular identifier (UMI). Following droplet breaking, pooled libraries are prepared for sequencing, focusing primarily on the 3' ends of transcripts [53]. The cellular barcodes enable computational attribution of sequences to their cell of origin during data analysis.
Table 1: Key Technical Characteristics and Performance Metrics
| Feature | Smart-seq2 | 3' Droplet Methods (e.g., 10x Genomics) |
|---|---|---|
| Throughput | Hundreds to thousands of cells [52] | Thousands to millions of cells [53] |
| Transcript Coverage | Full-length | 3' end (or 5' end) only |
| Gene Detection Sensitivity | High (detects more genes per cell) [7] | Lower in comparison [52] [7] |
| Key Applications | Isoform detection, SNP identification, allele-specific expression, rare cell characterization | Cellular atlas building, heterogeneity mapping, rare cell type discovery (in large populations) |
| Multiplexing Capability | Lower (plate-based) | High (cellular barcoding) |
| UMI Integration | Not in original protocol; added in later versions (Smart-seq3) | Standard (enables accurate transcript counting) |
| Hands-on Time & Cost | High hands-on time, variable cost | Lower hands-on time, higher commercial kit cost |
Performance Benchmarking in Biological Research
Quantitative comparisons reveal a clear trade-off. Smart-seq2 consistently demonstrates superior sensitivity, detecting a significantly higher number of genes per cell compared to droplet-based methods [7]. This makes it exceptionally powerful for analyzing cells with low RNA content or for projects where maximizing information from each cell is critical. For stem cell research, this high sensitivity can be crucial for identifying subtle transcriptional differences that define early lineage commitment or rare subpopulations within a seemingly homogeneous culture.
Conversely, 3' droplet methods provide a broader capture of cellular heterogeneity due to their massive throughput. They are the preferred choice for constructing comprehensive cellular atlases of complex tissues, profiling tumor microenvironments, or tracking developmental processes across entire organisms [53] [54]. While they detect fewer genes per cell, their ability to profile orders of magnitude more cells often enables the identification of rare cell types that would be missed in smaller-scale Smart-seq2 studies.
Experimental Protocols and Workflows
Smart-seq2 Workflow for Stem Cell Transcriptomics
The following diagram illustrates the key steps in the Smart-seq2 protocol for full-length single-cell transcriptome analysis.
Step 1: Single-Cell Preparation and Isolation
- Harvest stem cells and create a high-viability single-cell suspension.
- Use Fluorescence-Activated Cell Sorting (FACS) to isolate individual cells into individual wells of 96- or 384-well plates containing lysis buffer. This step can be tailored to sort specific subpopulations based on surface markers [7] [54].
Step 2: Reverse Transcription and cDNA Synthesis
- Lyse cells to release RNA.
- Perform reverse transcription using an oligo(dT) primer and a reverse transcriptase that adds non-templated cytosines to the 3' end of the cDNA.
- A Template-Switching Oligo (TSO) with riboguanosines (or LNA-G) binds to the non-templated C-string, allowing the reverse transcriptase to switch templates and copy the TSO sequence. This ensures that the complete 5' end of the transcript is captured [52] [5].
Step 3: cDNA Amplification and Purification
- Amplify the full-length cDNA using a single-stranded PCR primer. The number of PCR cycles (often 18-25) must be optimized to prevent over-amplification biases.
- Purify the cDNA using solid-phase reversible immobilization (SPRI) beads to remove primers, enzymes, and salts. Quality control is critical at this stage, typically assessed using capillary electrophoresis (e.g., Bioanalyzer) and fluorometric quantification (e.g., Qubit) [7].
Step 4: Library Preparation and Sequencing
- Use a tagmentation-based library prep kit (e.g., Nextera XT) to fragment the cDNA and add sequencing adapters.
- The final libraries are quantified, pooled, and sequenced on an Illumina platform using paired-end reads to capture the full length of the transcripts.
3' Droplet-Based Method Workflow (10x Genomics Chromium)
The following diagram outlines the generalized workflow for 3' droplet-based single-cell RNA sequencing.
Step 1: Single-Cell Suspension Preparation
- Prepare a high-quality single-cell suspension from stem cell cultures or tissues, ensuring high viability (>85%) and appropriate concentration (typically 700-1,200 cells/μL) to minimize doublet formation [53].
Step 2: Microfluidic Partitioning and Barcoding
- Load the cell suspension, barcoded Gel Beads, and partitioning oil into a microfluidic chip on the Chromium controller.
- The system generates Gel Bead-In-Emulsions (GEMs), where ideally, each droplet contains a single cell, a single bead, and lysis reagent. Each Gel Bead is coated with millions of oligonucleotides containing a cell barcode, a UMI, and an oligo(dT) sequence [53].
Step 3: In-Droplet Biochemical Reactions
- Within each droplet, cells are lysed, and mRNA molecules hybridize to the oligo(dT) primers on the beads.
- Reverse transcription occurs inside the droplets, producing cDNA molecules tagged with the cell-specific barcode and UMI.
Step 4: Library Preparation and Sequencing
- The droplets are broken, and the barcoded cDNA is purified and amplified via PCR.
- Sequencing libraries are constructed to enrich for the 3' ends of the transcripts that contain the barcodes and UMIs.
- The final library is sequenced on an Illumina platform. The read structure is designed to sequence the cell barcode and UMI first, followed by the cDNA sequence from the 3' end of the transcript.
The Scientist's Toolkit: Essential Research Reagent Solutions
Table 2: Key Reagents and Kits for Single-Cell RNA-Sequencing
| Reagent/Kits | Function | Example Products & Comments |
|---|---|---|
| Commercial Full-Length Kits | Provides optimized, reproducible reagents for plate-based protocols. | SMART-Seq HT Kit (Takara): High sensitivity, high cost [52]. NEBNext Single Cell/Low Input Kit: A lower-cost commercial alternative [52]. |
| Droplet-Based Kits | All-in-one solution for high-throughput scRNA-seq. | 10x Genomics Chromium Next GEM Single Cell 3' Kit: Industry standard for droplet-based 3' sequencing [53]. |
| Reverse Transcriptase | Converts mRNA into first-strand cDNA; critical for sensitivity. | Maxima H-minus: Used in Smart-seq3 for enhanced yield [5]. The choice of enzyme greatly impacts cDNA yield. |
| Template Switching Oligo (TSO) | Enables full-length cDNA capture by template switching. | Designs vary (e.g., LNA-modified in Smart-seq2, riboguanosine in FLASH-seq). TSO design impacts efficiency and artifacts [23] [5]. |
| Library Prep Kit | Prepares cDNA for sequencing on Illumina platforms. | Nextera XT: Commonly used with full-length protocols [52] [55]. In-house Tn5: Can be used for cost reduction [23]. |
| Solid Phase Reversible Immobilization (SPRI) Beads | For purification and size selection of cDNA and libraries. | Widely used for clean-up steps in both plate-based and droplet protocols. |
Application in Stem Cell Research: Making the Right Choice
The choice between Smart-seq2 and 3' droplet methods must be driven by the specific research goals in stem cell biology. The following diagram conceptualizes the decision-making process based on key research priorities.
When to Prioritize Smart-seq2:
- Investigating Transcriptional Bursting and Splicing Dynamics: The full-length coverage is indispensable for studying alternative splicing, a key regulatory mechanism in stem cell fate decisions [5].
- Characterizing Rare Stem Cell Populations: When cell numbers are intrinsically limited (e.g., primordial germ cells, specific progenitor populations), Smart-seq2 maximizes the information obtained from each precious cell [54].
- Validating Findings from Atlas-Level Studies: Smart-seq2 can be used as a secondary, high-resolution validation tool on specific cell clusters identified in an initial high-throughput droplet study.
When to Prioritize 3' Droplet Methods:
- Building Comprehensive Differentiation Atlases: Mapping the entire continuum of states as stem cells differentiate requires the throughput to capture rare intermediate populations [54].
- Analyzing Complex Heterogeneity in Organoids or Mixed Cultures: Droplet methods can unbiasedly reveal the complete spectrum of cell types present in complex in vitro systems.
- Large-Scale Perturbation Screens: When testing the effects of many genetic or chemical perturbations on stem cell state, the scalability of droplet methods is a significant advantage.
For many comprehensive research programs, a tiered approach is most effective. An initial droplet-based screen can map overall heterogeneity and identify key populations of interest. Subsequent high-resolution analysis of these specific populations using Smart-seq2 can then provide deep mechanistic insights into their transcriptional regulation [7]. This combined strategy leverages the respective strengths of both methodologies to deliver a more complete biological understanding.
Within full-length stem cell transcriptome research, the Smart-seq2 protocol has established itself as a robust and widely adopted method for deep transcriptional profiling of single cells [56]. Its primary strength lies in its ability to sequence full-length cDNA, enabling the detection of alternative splice variants, allelic variants, and single-nucleotide polymorphisms, which is crucial for characterizing the precise identity and state of stem cells [10]. However, generating high-quality data is only the first step; rigorous validation is essential to draw meaningful biological conclusions. This application note provides detailed protocols and case studies framed within a broader Smart-seq2 workflow, focusing on practical validation strategies for stem cell differentiation and disease modeling. We summarize key quantitative data and provide step-by-step methodologies to guide researchers in confirming the identity, purity, and functional capacity of stem cell derivatives.
Performance Benchmarking of scRNA-seq Methods
Selecting an appropriate single-cell RNA sequencing method is critical. The decision often hinges on the trade-off between the depth of transcriptional information and the number of cells that can be profiled. The table below compares key characteristics of full-length and 3'-end counting methods relevant to stem cell research.
Table 1: Comparison of scRNA-seq Methodologies for Stem Cell Research
| Feature | Smart-seq2 [56] | FLASH-seq (FS) [10] | 10x Chromium 3' (e.g., 3' Next GEM kit) [10] [56] |
|---|---|---|---|
| Transcript Coverage | Full-length, with 3' bias [56] | Full-length [10] | 3'-tag counting [10] [56] |
| Key Advantage | Detects isoforms, SNPs; high sensitivity [56] | High sensitivity, fast protocol (~4.5 hrs), reduced artifacts [10] | High throughput (100s to 100,000s of cells) [56] |
| Sensitivity (Genes Detected) | High (established benchmark) [10] | Higher than Smart-seq2 and SS3 in HEK293T cells [10] | Lower than full-length methods for a given cell [10] |
| Well Suited For | Isoform detection, eQTL mapping, detailed characterization of rare cells [10] [56] | Rapid, highly sensitive full-length profiling; automation [10] | Identifying cellular heterogeneity in complex populations [56] |
| Protocol Hands-on Time | ~2 days [56] | <1 hour (FS-LA protocol) [10] | Not Specified |
The following workflow diagram outlines the key steps in a typical Smart-seq2 experiment for stem cell research, from cell preparation to data validation.
Case Study 1: Validating Stem Cell Differentiation Efficacy
Background and Protocol
A critical application of scRNA-seq is assessing the fidelity of stem cell differentiation protocols. Simply demonstrating a change in transcriptome is insufficient; validation requires proving that the derived cells closely match their in vivo counterparts. A demonstration using GeneAnalytics software showed how to evaluate the differentiation of human embryonic stem cells (H9 line) into hepatocytes based on a differentially expressed gene set [57]. The key is to move beyond a simple list of marker genes to a systems-level comparison against known expression profiles in tissues and cells.
Experimental Workflow for Differentiation Validation
Table 2: Protocol for scRNA-seq-Based Differentiation Validation
| Step | Description | Critical Parameters |
|---|---|---|
| 1. Experimental Design | Differentiate stem cells into target lineage. Include positive/negative controls if possible. | Account for batch effects; ensure sufficient biological replicates [56]. |
| 2. scRNA-seq Processing | Perform Smart-seq2 on derived cells and relevant controls (e.g., parental stem cells). | Use high-viability cells (>90%); include unique molecular identifiers (UMIs) to improve quantification accuracy [10]. |
| 3. Bioinformatic Analysis | Identify differentially expressed genes (DEGs) between derivatives and controls. | Use appropriate statistical cut-offs (e.g., FDR < 0.05, log2FC > 1). |
| 4. External Comparison | Input the top DEGs into a gene set analysis tool (e.g., GeneAnalytics) against a database of tissue/cell expression profiles. | Use a curated, evidence-based database for reliable annotations [57]. |
| 5. Interpretation | The derived cells should show strongest matching to the target tissue (e.g., liver). | Also check for matches to immature or off-target cell types (e.g., embryoid bodies) [57]. |
Expected Outcomes and Analysis
In a successful differentiation, the analysis will show the highest matching score for the target tissue or cell type. For example, hepatocyte derivatives should show strong enrichment for genes selectively expressed in liver and hepatic endoderm cells, with markers like Albumin supported by multiple expression databases [57]. A failed or incomplete differentiation would be indicated by low matching to the target tissue and/or high matching to unrelated cell types or early developmental stages, suggesting a mixed or incorrect population [57].
Case Study 2: Building and Validating an In Silico Disease Model
Background and Protocol
Rare diseases pose a significant challenge for traditional research due to small patient populations. In silico disease modeling, calibrated with scRNA-seq data from patient-derived stem cells, offers a powerful complementary approach. This case study outlines the creation and validation of a computational model for a rare disease, using Gaucher disease as an exemplar where computational tools predict the impact of GBA1 gene mutations [58].
Experimental Workflow for In Silico Model Validation
The diagram below illustrates the iterative process of building and validating a disease model, integrating wet-lab and dry-lab components.
Validation Framework and Metrics
For an in silico model to be credible, it must undergo rigorous validation. A comprehensive framework examines the model's development, performance, and operational value [59].
- Conceptual Model Validity: Ensure the model's structure and assumptions are based on accepted biological theory. For a metabolic disease model, this would incorporate established biochemical pathways [59].
- Data Validity: Use high-quality, relevant data for model calibration. Smart-seq2 data from patient iPSC-derived cells provides a physiologically relevant human dataset [58].
- Operational Validity: Compare model outputs against external data not used in building the model. This includes:
The Scientist's Toolkit: Essential Research Reagent Solutions
The following table catalogs key reagents and resources central to the workflows described in this application note.
Table 3: Key Research Reagent Solutions for scRNA-seq and Validation
| Reagent / Resource | Function | Application Note |
|---|---|---|
| Superscript IV (SSRTIV) | Reverse transcriptase with high processivity and thermostability. | Used in FLASH-seq to shorten RT reaction time and increase sensitivity [10]. |
| Template Switching Oligo (TSO) | Enables cDNA synthesis from the 5' end of mRNA via template switching. | Modifications (e.g., riboguanosine) can reduce strand-invasion artifacts [10]. |
| Unique Molecular Identifiers (UMIs) | Short random nucleotide sequences that tag individual mRNA molecules. | Allows for accurate digital counting and removal of PCR duplicates in protocols like FS-UMI and SS3 [10]. |
| Integrated Collection of Stem Cell Banks (ICSCB) | A search portal aggregating >16,000 stem cell lines from global banks. | Invaluable for finding specific diseased iPSC lines for rare disease modeling (e.g., from hPSCreg, RIKEN BRC) [61]. |
| MIACARM Guidelines | Defines minimum information for reporting cellular assays in regenerative medicine. | Provides standardized data items and formats for reporting stem cell line information, aiding reproducibility [61]. |
| GeneAnalytics | A gene set analysis tool matching input genes to tissue and cell type expression profiles. | Used for functional validation of stem cell derivatives by comparing transcriptomic profiles to in vivo benchmarks [57]. |
Conclusion
Smart-seq2 remains a powerful and highly sensitive method for full-length single-cell transcriptomics, particularly well-suited for stem cell research where the detection of novel isoforms, SNPs, and long transcripts is paramount. While newer protocols like Smart-seq3 and FLASH-seq offer enhancements in speed, integrated UMIs, and reduced artifacts, Smart-seq2's proven robustness and accessibility secure its continued value. For researchers, the choice of protocol should be guided by the specific biological question—prioritizing transcriptome depth and completeness over sheer cell throughput. The ongoing evolution of full-length scRNA-seq methods promises to further empower stem cell biology, driving discoveries in cellular identity, differentiation trajectories, and the development of novel therapeutic strategies.
References
- 1. For Template Library Construction | IDT Switching Oligos cDNA [https://www.idtdna.com/page/support-and-education/decoded-plus/use-of-template-switching-oligos-ts-oligos-tsos-for-efficient-cdna-library-construction/]
- 2. - Smart - Enseqlopedia Seq [https://enseqlopedia.com/wiki-entry/rna-sequencing-methods/low-level-rna-detection/smart-seq/]
- 3. What Is A Template Oligonucleotide Switching [https://www.biosyn.com/faq/What-Is-A-Template-Switching-Oligonucleotide.aspx]
- 4. Application of a Modified Smart-seq2 Sample Preparation ... [https://pmc.ncbi.nlm.nih.gov/articles/PMC7854224/]
- 5. What is the difference between Smart-seq2, Smart-seq3 ... [https://alitheagenomics.com/blog/what-is-the-difference-between-smart-seq2-smart-seq3-and-flash-seq-for-full-length-single-cell-rna-seq]
- 6. Characterization and implementation of the MarathonRT ... [https://pmc.ncbi.nlm.nih.gov/articles/PMC11482623/]
- 7. Single-cell sequencing of full-length transcripts and T-cell ... [https://bmcgenomics.biomedcentral.com/articles/10.1186/s12864-024-11036-0]
- 8. Full-Length Spatial Transcriptome Strategy Based on ... [https://www.sciencedirect.com/science/article/abs/pii/S0956566325008942]
- 9. Smart-seq2 for sensitive full-length transcriptome profiling ... [https://pubmed.ncbi.nlm.nih.gov/24056875/]
- 10. Fast and highly sensitive full-length single-cell RNA ... [https://www.nature.com/articles/s41587-022-01312-3]
- 11. Direct Comparative Analyses of 10X Genomics Chromium ... [https://www.sciencedirect.com/science/article/pii/S1672022921000486]
- 12. High-throughput full-length single-cell RNA-seq automation [https://pubmed.ncbi.nlm.nih.gov/33990801/]
- 13. Full-length RNA-seq from single cells using Smart-seq2 [https://www.nature.com/articles/nprot.2014.006]
- 14. Full-length RNA-seq from single cells using Smart-seq2 [https://www.rna-seqblog.com/full-length-rna-seq-from-single-cells-using-smart-seq2/]
- 15. Smart-Seq2 [https://www.illumina.com/science/sequencing-method-explorer/kits-and-arrays/smart-seq2.html]
- 16. Smart-Seq/NanoCAGE/CAGEscan [https://www.illumina.com/science/sequencing-method-explorer/kits-and-arrays/smart-seq-nanocage-cagescan.html]
- 17. Optimization of library preparation based on SMART for ... [https://bmcgenomics.biomedcentral.com/articles/10.1186/s12864-021-08132-w]
- 18. Preparation of Single-Cell RNA-Seq Libraries for Next ... [https://pmc.ncbi.nlm.nih.gov/articles/PMC4338574/]
- 19. Improving single-cell RNA counting | Nature Methods [https://www.nature.com/articles/s41592-020-0901-1]
- 20. Simple, streamlined, cost-effective cDNA synthesis method ... [https://pmc.ncbi.nlm.nih.gov/articles/PMC11896693/]
- 21. CelluLyser™ Lysis and cDNA Synthesis Kit – From-Cell to RT ... [https://webshop.tataa.com/products/cellulyser-lysis-and-cdna-synthesis-kit]
- 22. The impact of PCR duplication on RNAseq data generated ... [https://genomebiology.biomedcentral.com/articles/10.1186/s13059-025-03613-7]
- 23. Scalable single-cell RNA sequencing from full transcripts ... [https://www.nature.com/articles/s41587-022-01311-4]
- 24. Protocol for RNA-seq library preparation from low-volume ... [https://pmc.ncbi.nlm.nih.gov/articles/PMC12630345/]
- 25. Protocol for high-quality single-cell RNA-seq from tissue ... [https://pmc.ncbi.nlm.nih.gov/articles/PMC11088347/]
- 26. Methanol fixation and tagmentation of RNA/DNA hybrids ... [https://www.frontiersin.org/journals/genetics/articles/10.3389/fgene.2025.1629655/full]
- 27. Single-cell sequencing in stem cell biology - PMC [https://pmc.ncbi.nlm.nih.gov/articles/PMC4832540/]
- 28. High-resolution single-cell RNA-seq data and ... [https://www.nature.com/articles/s41597-025-05024-6]
- 29. advances and applications of single-cell RNA-seq [https://www.oaepublish.com/articles/jtgg.2020.51]
- 30. SMART-Seq Single Cell Kit—full-length transcriptome ... [https://www.takarabio.com/products/next-generation-sequencing/rna-seq/legacy-rna-seq-kits/smart-seq-single-cell-for-scrna-seq?srsltid=AfmBOorK7Ik_7gio2db2E3uenzJlUE7KIOG__E4bVQK9yd-2VIbkFeiS]
- 31. Understanding isoform expression by pairing long-read ... [https://pmc.ncbi.nlm.nih.gov/articles/PMC11610585/]
- 32. Navigating single-cell RNA-sequencing: protocols, tools ... [https://pmc.ncbi.nlm.nih.gov/articles/PMC12085826/]
- 33. Emerging technologies of single-cell multi-omics [https://haematologica.org/article/view/11928]
- 34. SMART-Seq Single Cell Kit—full-length transcriptome ... [https://www.takarabio.com/products/next-generation-sequencing/rna-seq/legacy-rna-seq-kits/smart-seq-single-cell-for-scrna-seq?srsltid=AfmBOooKq1pfSOwjW95Rm2NurgRVAeqscBwPu4wJq3FxnwEWDiPtbCgT]
- 35. Simultaneous profiling of RNA isoforms and chromatin ... [https://www.nature.com/articles/s41467-024-52335-0]
- 36. scDALI: modeling allelic heterogeneity in single cells reveals ... [https://genomebiology.biomedcentral.com/articles/10.1186/s13059-021-02593-8]
- 37. Single-cell sequencing of full-length transcripts and T-cell ... [https://pmc.ncbi.nlm.nih.gov/articles/PMC11583680/]
- 38. Reverse Transcription Applications [https://www.thermofisher.com/us/en/home/life-science/cloning/cloning-learning-center/invitrogen-school-of-molecular-biology/rt-education/reverse-transcription-applications.html]
- 39. Reverse transcription: Process and applications [https://www.abcam.com/en-us/knowledge-center/dna-and-rna/rtpcr]
- 40. Advancements in single-cell RNA sequencing and spatial ... [https://www.frontierspartnerships.org/journals/acta-biochimica-polonica/articles/10.3389/abp.2025.13922/full]
- 41. Systematic assessment of long-read RNA-seq methods for ... [https://www.nature.com/articles/s41592-024-02298-3]
- 42. Fast and highly sensitive full-length single-cell RNA ... [https://pmc.ncbi.nlm.nih.gov/articles/PMC9546769/]
- 43. Template Switching RT Enzyme Mix [https://www.neb.com/en-us/products/m0466-template-switching-rt-enzyme-mix?srsltid=AfmBOoouStvoH5Z1_hJQNFbJV0arc5fR2M_T6YnzFzJItDpm3X2alc6_]
- 44. Cost saving with miniaturization and mosquito HV lease ... [https://www.sptlabtech.com/cost-saving-with-miniaturization-and-mosquito-hv-lease-scheme]
- 45. SMART-Seq Single Cell Kit—full-length transcriptome ... [https://www.takarabio.com/products/next-generation-sequencing/rna-seq/legacy-rna-seq-kits/smart-seq-single-cell-for-scrna-seq?srsltid=AfmBOopy_lH68L1TdW_N33bLl2CufL3a6BZWeg4HvKGMz09YxkJUQPg5]
- 46. Application of a Modified Smart-seq2 Sample Preparation ... [https://bio-protocol.org/en/bpdetail?id=3345&type=0]
- 47. SMART-seq/SMART-seq2/SMART-seq3/SMART-seq3xpress ... [https://teichlab.github.io/scg_lib_structs/methods_html/SMART-seq_family.html]
- 48. Differences between SMART-seq2, SMART-seq3, and 10x [https://www.biostars.org/p/9488230/]
- 49. High-Quality Single-cell RNA-seq with Mantis and Smart ... [https://formulatrix.com/life-science-automation-blog/mantis-smart-seq3/]
- 50. Full-Length Single-Cell RNA-Sequencing with FLASH-seq [https://pubmed.ncbi.nlm.nih.gov/36495447/]
- 51. FLASH-seq for full-length single-cell RNA-sequencing [http://bioengineeringcommunity.nature.com/posts/faster-cheaper-better-flash-seq-for-full-length-single-cell-rna-sequencing]
- 52. Benchmarking full-length transcript single cell mRNA ... [https://bmcgenomics.biomedcentral.com/articles/10.1186/s12864-022-09014-5]
- 53. Droplet-based single-cell RNA sequencing [https://pmc.ncbi.nlm.nih.gov/articles/PMC12522672/]
- 54. Single-cell sequencing in stem cell biology [https://genomebiology.biomedcentral.com/articles/10.1186/s13059-016-0941-0]
- 55. Benchmarking Single-Cell mRNA–Sequencing ... [https://pmc.ncbi.nlm.nih.gov/articles/PMC9258451/]
- 56. Experimental design for single-cell RNA sequencing - PMC [https://pmc.ncbi.nlm.nih.gov/articles/PMC6063265/]
- 57. Evaluation of stem cells differentiation | Case Studies [https://geneanalytics.genecards.org/case-studies/evaluation-of-stem-cells-differentiation/]
- 58. Advancing the frontier of rare disease modeling: a critical ... [https://www.nature.com/articles/s41746-025-02068-1]
- 59. Validation of population-based disease simulation models [https://bmcpublichealth.biomedcentral.com/articles/10.1186/1471-2458-10-710]
- 60. Validation framework for epidemiological models with ... [https://pmc.ncbi.nlm.nih.gov/articles/PMC10057797/]
- 61. Integrated Collection of Stem Cell Bank Data, a Data Portal for ... [https://pmc.ncbi.nlm.nih.gov/articles/PMC8072026/]