Strategies for Reducing Autologous Cell Therapy Manufacturing Costs: A 2025 Guide for Researchers and Developers
Autologous cell therapies represent a transformative medical advancement, yet their high manufacturing costs severely limit patient access and commercial viability.
Strategies for Reducing Autologous Cell Therapy Manufacturing Costs: A 2025 Guide for Researchers and Developers
Abstract
Autologous cell therapies represent a transformative medical advancement, yet their high manufacturing costs severely limit patient access and commercial viability. This article provides a comprehensive analysis for researchers, scientists, and drug development professionals seeking to overcome these cost barriers. We explore the fundamental cost drivers in autologous manufacturing, evaluate emerging methodological innovations from automation to non-viral vectors, present optimization frameworks for troubleshooting supply chain and process challenges, and validate strategies through comparative economic analysis. By synthesizing current industry data and technological trends, this guide offers a actionable roadmap for developing more affordable and scalable autologous cell therapies without compromising quality or efficacy.
Understanding the High Cost Drivers in Autologous Cell Therapy Manufacturing
Troubleshooting Guide: Frequent Scalability Challenges
1. How can I reduce high manufacturing costs and vein-to-vein time in autologous therapies?
- Challenge: The autologous process is inherently complex and resource-intensive, leading to high costs and lengthy production timelines that can span weeks [1] [2].
- Solution: Implement rapid, automated manufacturing platforms.
- Protocol: Investigate workflows like the GoFast process, which can produce CAR-T cells in under 72 hours using simplified, GMP-ready steps and non-viral transduction methods. This contrasts with traditional methods taking 2-3 weeks [2].
- Expected Outcome: A significant reduction in vein-to-vein time and labor costs, with some trials achieving median treatment costs under $50,000 [2].
2. How can we manage high product variability from different patient donors?
- Challenge: Starting material from different donors results in cells with varying metabolic profiles and capabilities, which current manufacturing processes struggle to normalize [1].
- Solution: Employ advanced process controls and adaptive manufacturing systems.
- Protocol: Utilize automated manufacturing platforms with real-time monitoring systems. These can help adjust processes to account for donor variability. Genetic engineering and advanced culture media are also promising tools to normalize product quality [1].
- Expected Outcome: Improved product consistency and predictability, leading to more reliable patient outcomes and reduced batch failures.
3. Our process is difficult to scale from clinical to commercial volumes. What are the key barriers?
- Challenge: Legacy manufacturing processes are complex, resource-intensive, and create a scalability bottleneck, limiting patient access and inflating costs [1].
- Solution: Transition to standardized, automated, closed-system platforms.
- Protocol: Adopt consolidated, closed-system automated platforms (e.g., MARS Bar/Atlas). These reduce contamination risk, lower labor inputs, and support reproducible GMP-compliant workflows across multiple sites [2].
- Expected Outcome: A more scalable, sustainable, and robust manufacturing model that can meet global demand while driving down cost of goods sold (COGS) [2].
4. How do we maintain cell potency and prevent exhaustion during manufacturing?
- Challenge: For cell therapies like CAR-T, maintaining "stemness" and preventing T-cell exhaustion during the expansion phase is difficult and directly impacts therapeutic efficacy post-infusion [1].
- Solution: Optimize expansion protocols and culture conditions.
- Protocol: Shorter expansion timelines (e.g., 3-day processes) have been associated with yielding a more desirable, less-differentiated T-cell phenotype with higher potency and memory-like characteristics [2].
- Expected Outcome: Enhanced in vivo persistence and functionality of the therapeutic cells, leading to improved patient outcomes.
5. The patient-specific supply chain is a major source of complexity. How can it be simplified?
- Challenge: Managing the chain of identity and custody for each patient's cells, coupled with strict cold-chain and time constraints, introduces significant logistical challenges not found in traditional drug modalities [1].
- Solution: Develop fit-for-purpose supply chain and manufacturing models.
- Protocol: Shift towards decentralized or point-of-care manufacturing models. This involves establishing regional or hospital-adjacent manufacturing facilities. This approach simplifies logistics, eliminates the need for cryopreservation in some cases, and enables the use of fresh cells [1] [2].
- Expected Outcome: Reduced logistical complexity, lower transport costs, shorter vein-to-vein times, and broader patient access [2].
Quantitative Data: Cost and Process Drivers
The tables below summarize key quantitative data related to the scalability and cost of autologous cell therapies.
Table 1: Cost and Time Drivers in Autologous Therapy Manufacturing
| Cost & Time Driver | Impact Description |
|---|---|
| High Labor Inputs | Processes are often bespoke and require expert input, driving up costs [1]. |
| Expensive Raw Materials | The use of costly materials, such as viral vectors, significantly increases the Cost of Goods Sold (COGS) [1] [2]. |
| Centralized Manufacturing | Requires complex cold-chain logistics and long-distance transport of patient cells [1] [2]. |
| Lengthy Expansion | Traditional CAR-T manufacturing processes take 2–3 weeks, contributing to high costs and treatment delays [2]. |
| Complex QC & Release | Time-consuming quality control testing and product release constraints delay treatment [1]. |
Table 2: Comparative Analysis: Traditional vs. Innovative Manufacturing Models
| Parameter | Traditional Centralized Model | Point-of-Care / Rapid Model (e.g., VELCART Trial) |
|---|---|---|
| Vein-to-Vein Time | 2 - 3 weeks [2] | ~9 days [2] |
| Manufacturing Timeline | 2 - 3 weeks [2] | Under 72 hours (GoFast) [2] |
| Reported Cost per Dose | Hundreds of thousands of dollars [2] | Under $50,000 (median) [2] |
| Cell Phenotype | Risk of T-cell exhaustion during long expansion [1] | Less-differentiated, memory-like T cells with higher potency [2] |
| Logistical Model | Complex cold-chain between apheresis center and remote facility [1] | Simplified, on-site manufacturing at treatment center [2] |
The Scientist's Toolkit: Research Reagent Solutions
Table 3: Essential Materials and Tools for Scalability Research
| Research Tool / Reagent | Function in Scalability Research |
|---|---|
| Non-Viral Transposon Systems | Used as a cost-effective and scalable alternative to viral vectors for genetic modification of T-cells (e.g., CAR insertion) [2]. |
| Advanced Culture Media | Formulations designed to maintain T-cell "stemness" and prevent exhaustion during in vitro expansion, improving post-infusion persistence [1]. |
| Automated, Closed-Systems | Platforms (e.g., MARS) that consolidate manufacturing steps, reduce manual labor, and ensure process reproducibility in a GMP-compliant manner [2]. |
| Real-time Monitoring Systems | Integrated sensors and analytics to monitor critical quality attributes (CQAs) during cell expansion, enabling adaptive process control [1]. |
| Attribute Importance Ranking | A data analysis method, often using 'Random Forest', to identify and prioritize the most informative genes, reducing process complexity [3]. |
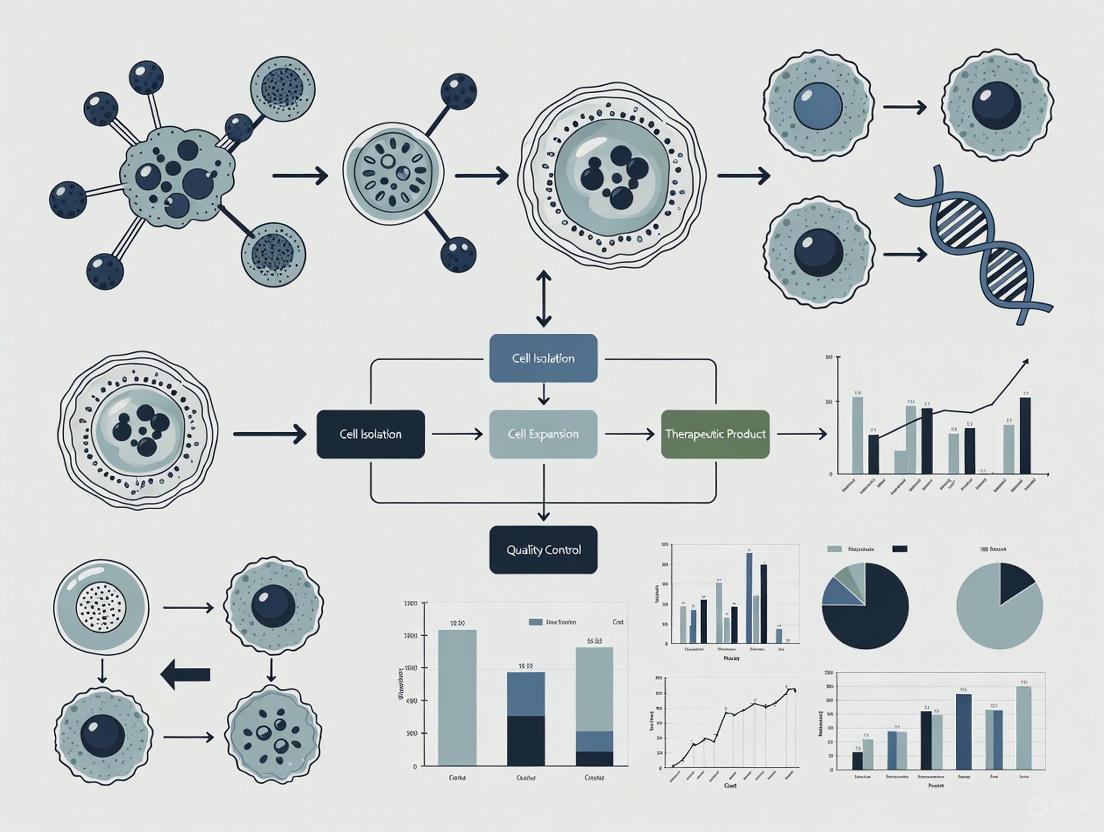
Experimental Workflow Visualizations
The following diagrams, created using the specified color palette, illustrate key processes and strategies discussed.
The manufacturing of autologous cell therapies, such as CAR-T cells, represents a pinnacle of personalized medicine but is burdened by exceptionally high costs. These expenses significantly limit patient access and challenge healthcare systems. The production process, being both resource-intensive and highly complex, is primarily driven by three major cost components: the use of viral vectors for gene delivery, extensive skilled labor requirements, and rigorous quality control (QC) systems. This technical resource examines these core cost drivers, providing data, troubleshooting guides, and actionable strategies to aid researchers and developers in designing more cost-effective manufacturing frameworks.
Quantitative Analysis of Cost Components
The tables below summarize key quantitative data on manufacturing costs and quality control market trends.
Table 1: Estimated Manufacturing Cost Drivers for Autologous Cell Therapies
| Cost Component | Estimated Cost Contribution / Market Size | Key Details and Context |
|---|---|---|
| Total Manufacturing Cost | > $100,000 USD per patient [4] | Based on current manual processes for autologous cell therapies. |
| Viral Vectors | > $16,000 USD per patient batch [5] | Cost for a single viral batch used in genetic modification of a patient's T cells. |
| Global Viral Vector Manufacturing Market | $227.63 million (2017) to $1,013 million (2026) [6] | Projected growth with a CAGR of 18.0%, indicating high demand and cost pressure. |
| Labor Cost Driver | 3.3x more manual interventions [4] | Autologous processes require 3.3 times more manual steps than traditional biologics. |
| Batch Failure Rate (Manual Process) | 10% [4] | High failure rate due to lengthy culture times and numerous open manipulations. |
| Batch Failure Rate (Automated Process) | 3% [4] | Reduced failure rate with use of closed systems and automation. |
Table 2: Cell & Gene Therapy Quality Control Market Overview
| Aspect | Detail |
|---|---|
| Market Size (2024) | US$ 2.28 billion [7] |
| Projected Market Size (2034) | US$ 22.81 billion [7] |
| CAGR (2025-2034) | 25.74% [7] |
| Largest Testing Type Segment (2024) | Sterility Testing (20-25% share) [7] |
| Fastest Growing Testing Type | Potency Testing [7] |
| Largest Product & Service Segment | Kits & Reagents (40-45% share) [7] |
Frequently Asked Questions (FAQs)
1. Why are viral vectors such a significant cost driver in CAR-T cell manufacturing?
Viral vectors, particularly lentiviral and retroviral vectors, are essential for efficiently delivering and integrating the chimeric antigen receptor (CAR) gene into a patient's T cells [5]. Their cost is high due to the complex and costly process of producing high-quality, clinical-grade batches. This complexity is compounded by stringent regulatory requirements, as authorities often treat viral vectors not as a simple raw material, but as a drug substance, necessitating extensive testing and control [6]. Furthermore, the global manufacturing capacity for viral vectors is constrained, leading to high demand and limited supply from a small number of third-party suppliers [6].
2. How does the autologous nature of these therapies impact labor costs?
Autologous therapies are manufactured on a per-patient basis, creating a "single-lot product" model [6]. This means that the entire sequence of quality testing and manufacturing steps must be repeated for every single patient, preventing the economies of scale achieved in traditional drug manufacturing [4] [6]. The process involves many handling steps (e.g., density gradient processing, washing, feeding) that are labor-intensive and require considerable intervention from skilled operators [4] [6]. One analysis notes that an autologous cell therapy process can require 50 manual steps, which is about 3.3 times more than a typical biologics process [4].
3. What are the main contributors to quality control costs?
The key contributors include the extensive and mandatory testing required for product release and safety. As shown in Table 2, sterility testing is a major segment, crucial for ensuring the final product is free from viable microbes, which is especially critical for immunocompromised patients [7]. Potency testing, the fastest-growing segment, is required to ensure the therapy's biological activity and efficacy [7]. The high cost of specialized kits and reagents used for these analytical tests also adds significantly to the overall QC cost [7].
4. What are the most promising strategies for reducing these costs?
Several innovative strategies are being pursued:
- Shifting to Non-Viral Vectors: Using transposon systems (e.g., Sleeping Beauty, piggyBac) or CRISPR delivered via electroporation can eliminate the high cost of viral vectors [8] [5].
- Automation and Closed Systems: Implementing automated and closed-system technologies reduces manual labor, decreases the risk of contamination (lowering failure rates), and improves process robustness [4] [6] [9].
- Allogeneic ("Off-the-Shelf") Approaches: Using T cells from healthy donors to create universal CAR-T products capable of treating multiple patients can fundamentally shift the manufacturing model away from the costly single-patient lot system [8] [5] [6].
- Point-of-Care Manufacturing: Decentralizing manufacturing to locations closer to patients can significantly reduce the complex and expensive logistics of shipping patient cells to and from central facilities [8] [5].
Troubleshooting Common Cost-Related Challenges
Challenge 1: High Viral Vector Costs and Supply Chain Constraints
- Problem: Viral vector batches are expensive, capacity is limited, and they are often treated as a drug substance by regulators [5] [6].
- Troubleshooting Steps:
- Evaluate Non-Viral Alternatives: Investigate the use of the Sleeping Beauty or piggyBac transposon systems for gene delivery, which are less expensive to produce [8] [5].
- Engage CDMOs Early: Partner with a Contract Development and Manufacturing Organization (CDMO) that has specialized viral vector expertise and dedicated capacity to de-risk development and secure supply [10].
- Optimize Vector Usage: During process development, use Design of Experiment (DoE) approaches to fine-tuning the multiplicity of infection (MOI) to achieve high transduction efficiency while minimizing vector consumption [10].
Challenge 2: Unsustainable Labor Costs and Process Variability
- Problem: The manufacturing process is highly manual, leading to high labor costs, patient-to-patient variability, and an elevated risk of contamination and batch failure [4] [6].
- Troubleshooting Steps:
- Implement Closed Automated Systems: Transition from open manual manipulations in biosafety cabinets to closed, automated systems or isolators. This can reduce batch failure rates from ~10% to ~3% and lower the required cleanroom classification, saving on facility costs [4].
- Adopt a Modular Automation Roadmap: Instead of a full-scale automated line, start with stand-alone automated modules for specific unit operations (e.g., cell expansion, separation, cryopreservation). These can be integrated later, allowing for flexibility and manageable upfront investment [6].
- Standardize Protocols: Work to establish robust, standardized Standard Operating Procedures (SOPs) to reduce operator-dependent variability and improve consistency across batches [4].
Challenge 3: Managing Rising Quality Control Expenses
- Problem: The need for comprehensive QC testing, including sterility, potency, and identity, is a major and growing cost component [7].
- Troubleshooting Steps:
- Leverage Contract Testing Services: For specific, less-frequently-performed tests, utilize contract testing services instead of building all capabilities in-house. This can be more cost-effective, especially for smaller developers [7].
- Invest in Process Analytics: Implement advanced analytical methods and data analytics to monitor processes in real-time. This helps identify anomalies early, preventing the wastage of resources on batches that would otherwise fail release specifications [7].
- Plan for Phase-Appropriate Testing: Design a phase-appropriate QC strategy that aligns the rigor and scope of testing with the stage of clinical development, avoiding unnecessary costs in early phases while ensuring full compliance for commercial production [10].
Experimental Protocols for Cost-Reduction Strategies
Protocol 1: Evaluating Non-Viral Gene Delivery Using Electroporation
This protocol provides a methodology for comparing the efficiency and cost-effectiveness of non-viral gene delivery methods as an alternative to viral vectors.
1. Objective: To transduce human T cells with a CAR transgene using the Sleeping Beauty transposon system delivered via electroporation, and to assess transduction efficiency and cell viability.
2. Materials (Research Reagent Solutions):
| Item | Function |
|---|---|
| Human T Cells | Isolated from PBMCs via density gradient centrifugation or negative selection beads. |
| Sleeping Beauty Transposon Plasmid | Contains the CAR expression cassette flanked by inverted terminal repeats. |
| Sleeping Beauty Transposase Plasmid | Supplies the transposase enzyme for genomic integration of the transposon. |
| Electroporation Buffer | Optimized solution to maintain cell health during electrical pulse. |
| Electroporator | Device to deliver controlled electrical pulses for cell membrane permeabilization. |
| Cell Culture Media | Media supplemented with IL-2 and/or IL-7/IL-15 for T cell expansion. |
| Flow Cytometry Antibodies | For staining and detecting surface CAR expression. |
3. Methodology:
- Day 0: T Cell Activation: Isolate T cells from PBMCs and activate them with anti-CD3/CD28 beads or reagents [5].
- Day 2: Electroporation:
- Harvest activated T cells and resuspend in electroporation buffer.
- Mix cells with the Sleeping Beauty Transposon Plasmid and Transposase Plasmid at an optimized ratio.
- Transfer the cell-DNA mixture to an electroporation cuvette and apply the pre-optimized electrical pulse.
- Immediately after electroporation, transfer cells to pre-warmed culture media.
- Post-Transduction Culture: Culture the transfected cells, expanding them for 7-14 days with appropriate cytokines.
- Analysis:
- Transduction Efficiency: Measure the percentage of CAR-positive cells using flow cytometry, typically 5-7 days post-transfection.
- Cell Viability: Monitor viability using trypan blue exclusion or an automated cell counter.
- Functional Assay: Perform a co-culture assay with target antigen-positive cells to assess the tumor-killing potency of the generated CAR-T cells.
Protocol 2: Implementing an Automated, Closed Cell Expansion System
This protocol outlines the transition from a manual, open culture system to an automated bioreactor for the cell expansion phase.
1. Objective: To automate the cell expansion step using a bioreactor system (e.g., Xuri W25) to reduce labor time and improve consistency.
2. Materials:
- Activated and transduced T cells.
- Automated Bioreactor System (e.g., Xuri Cell Expansion System W25).
- Pre-sterilized, single-use bioreactor cassettes/cell culture chambers.
- Cell culture media and supplements.
3. Methodology:
- System Setup: Install the pre-sterilized bioreactor cassette according to the manufacturer's instructions and prime the system with media.
- Inoculation: Aseptically transfer the initial population of CAR-T cells into the bioreactor chamber via a closed tubing set.
- Automated Expansion: Initiate the pre-programmed expansion protocol. The system automatically controls and monitors key parameters such as temperature, pH, dissolved oxygen, and perfusion rates. It can also perform automated feeding and media exchange.
- Harvesting: At the end of the expansion cycle, typically after a set number of days or when target cell numbers are reached, harvest the cells through a closed tubing set into a final container bag.
- Labor Tracking: Compare the total hands-on operator time required for this automated process against the manual process of feeding and monitoring in traditional culture flasks or bags [9] [11].
Visualizing Cost-Reduction Pathways
The diagram below illustrates the primary cost drivers in autologous cell therapy manufacturing and the corresponding strategies to reduce them.
The Scientist's Toolkit: Key Research Reagents & Solutions
Table 3: Essential Tools for Cost-Reduction Research
| Category | Item | Primary Function in Cost-Reduction Context |
|---|---|---|
| Gene Delivery | Sleeping Beauty Transposon System | Non-viral, cost-effective alternative for stable CAR gene integration [8] [5]. |
| piggyBac Transposon System | Another non-viral vector system for gene delivery, known for high cargo capacity [8] [5]. | |
| CRISPR-Cas9 System | Gene-editing tool; can be used to create universal CAR-T cells by knocking out endogenous TCRs [8]. | |
| Cell Processing | Automated Bioreactor (e.g., Xuri) | Automates cell expansion in a closed system, reducing labor and contamination risk [11]. |
| Automated Cell Processing System (e.g., Sepax C-Pro) | Automates steps like mononuclear cell enrichment and washing, reducing manual handling [11]. | |
| Controlled-Rate Freezer (e.g., VIA Freeze) | Standardizes cryopreservation, a critical step for product viability and logistics [11]. | |
| Analytical QC | Flow Cytometry Assays | Critical for assessing CAR expression (identity) and cell phenotype [4] [7]. |
| Potency Assay Kits | Pre-developed kits can streamline the essential testing of biological function [7]. |
Frequently Asked Questions (FAQs)
1. What are the primary cost drivers in legacy autologous cell therapy manufacturing? Legacy processes are a leading driver of high therapeutic costs because they are complex, resource-intensive, and difficult to scale [1]. Key cost drivers include intensive manual labor, which can account for 25-50% of the total batch cost; expensive critical reagents like viral vectors (e.g., lentivirus constituting 10-25% of batch costs); and high manufacturing failure rates that lead to costly batch losses [12] [2].
2. How do legacy processes impact 'vein-to-vein' time and patient outcomes? Current legacy systems result in a vein-to-vein time of three to five weeks [12]. This delay is driven by transportation to centralized facilities, lengthy manufacturing, and complex logistics. For critically ill patients, such delays can necessitate bridging treatments, which may increase toxicity or compromise the eventual therapy's efficacy [12] [13].
3. What are the main scalability limitations of existing manufacturing platforms? Legacy manufacturing relies on a scale-out model, where each patient batch requires a separate, dedicated production run [14]. This model does not benefit from the economies of scale seen in traditional biologics. Scaling production requires adding entire new manufacturing lines and workstations, which is capital-intensive and limited by the availability of specialized professionals and GMP facilities [1] [15].
4. Why is process variability a significant challenge in autologous therapy production? Variability is inherent to autologous processes because the starting material (patient cells) is highly variable [1]. The health degree of pretreatment, and lymphocyte levels of the patient can significantly impact apheresis yield and quality [12]. Furthermore, differences in collection processes across apheresis facilities introduce additional inconsistencies, leading to unpredictable batch-to-batch outcomes [12].
5. What technological solutions are emerging to overcome these bottlenecks? The industry is shifting towards integrated automation, closed systems, and decentralized manufacturing. Automated closed systems (e.g., Cocoon, Prodigy) reduce human intervention and contamination risk [12] [2]. Point-of-care manufacturing models can drastically shorten vein-to-vein time to under 9 days and reduce costs [2]. Non-viral engineering methods and rapid manufacturing workflows (e.g., GoFast) are also being adopted to simplify processes and lower costs [8] [2].
Troubleshooting Guides
Issue 1: High and Unpredictable Cost of Goods Sold (COGS)
Problem: Manufacturing costs remain prohibitively high, making therapies commercially non-viable [1] [12].
Solutions:
- Implement Automated, Closed Systems: Transition from modular, open processes to fully closed and automated manufacturing platforms. This reduces labor costs, minimizes contamination risk, and improves process consistency [16] [12].
- Adopt Non-Viral Engineering: Evaluate non-viral transfection methods, such as electroporation with transposon systems (e.g., Sleeping Beauty, piggyBac), to eliminate the high cost and supply chain bottlenecks associated with viral vectors [8] [12].
- Explore Allogeneic ("Off-the-Shelf") Approaches: Where clinically viable, invest in developing allogeneic therapies from donor cells. This shifts the paradigm from a "batch-of-one" to a scalable, off-the-shelf model, dramatically reducing per-unit costs [17].
Issue 2: Lengthy Vein-to-Vein Time
Problem: The time from cell collection to product infusion is too long, potentially compromising patient health [12] [13].
Solutions:
- Decentralize Manufacturing: Establish regional or point-of-care (POC) manufacturing facilities. This strategy eliminates long-distance transportation and associated logistics, significantly shortening the timeline [8] [13].
- Optimize and Shorten Culture Time: Investigate rapid manufacturing protocols that reduce ex vivo expansion. Some emerging workflows can produce functional CAR-T cells in under 72 hours, which may also yield a more potent, less-differentiated T-cell phenotype [2].
- Streamline Logistics with Digital Platforms: Implement integrated digital supply chain solutions that provide real-time tracking of patient material and enhance coordination between the clinical site and manufacturing center [15].
Issue 3: Variable Input Material and Batch Failure
Problem: Inconsistencies in patient-derived starting material lead to high batch-to-batch variability and failure rates [1] [12].
Solutions:
- Standardize Apheresis Procedures: Work with clinical sites and industry groups (e.g., AABB, FACT) to establish and enforce standardized protocols for cell collection, processing, and freezing [12].
- Implement Adaptive Manufacturing Processes: Develop processes with built-in analytical controls and real-time monitoring that can adapt to variable input materials. This may involve adjusting culture conditions or media formulations to normalize the output product [1].
- Enhance In-Process Quality Control: Integrate more frequent and automated in-process analytics to identify potential batch failures earlier, allowing for corrective actions and conserving resources [1] [16].
Issue 4: Inability to Scale Production
Problem: The personalized, scale-out model cannot meet growing demand for larger patient populations [1] [15].
Solutions:
- Invest in Scalable Automation: Choose automated platforms designed for scale-out, capable of running multiple, simultaneous patient batches with minimal manual intervention [14] [16].
- Adopt a Modular Facility Design: Create flexible manufacturing suites with modular cleanrooms and single-use technologies. This allows for rapid reconfiguration and expansion of production capacity [15].
- Develop Platform Processes: Where possible, standardize manufacturing workflows across different therapy candidates. This simplifies training, tech transfer, and regulatory approval, facilitating faster scaling [2].
The following tables summarize key quantitative data related to the inefficiencies of legacy processes and the potential benefits of innovative approaches.
Table 1: Cost Drivers in Legacy Autologous Cell Therapy Manufacturing
| Cost Driver | Estimated Impact | Key References |
|---|---|---|
| Manual Labor | 25% - 50% of total batch cost | [12] |
| Viral Vectors (Lentivirus) | 10% - 25% of total batch cost | [12] |
| Batch Failure Rate | Can exceed 10% | [12] |
| Point-of-Care Manufacturing | Can reduce costs to under $50,000 per dose | [2] |
Table 2: Timelines: Legacy vs. Emerging Manufacturing Models
| Process Metric | Legacy Model | Emerging Model (e.g., Point-of-Care) | Key References |
|---|---|---|---|
| Vein-to-Vein Time | 3 - 5 weeks | ~9 days or less | [12] [2] |
| In Vitro Expansion | 2 - 3 weeks | Under 72 hours | [2] |
| Production Workflow | Multiple complex steps | Simplified, integrated process | [2] |
Experimental Protocol: Implementing a Rapid, Point-of-Care CAR-T Manufacturing Workflow
This protocol outlines a methodology for decentralizing and accelerating CAR-T cell manufacturing based on emerging point-of-care (POC) strategies [2] [13].
1. Objective: To establish a rapid, closed, and automated process for manufacturing CAR-T cells at a point-of-care facility, aiming to reduce vein-to-vein time to under 10 days and lower production costs.
2. Materials and Equipment:
- Leukapheresis product from the patient.
- Closed, automated cell processing system (e.g., MARS Bar, Cocoon, Prodigy).
- Non-viral gene editing system: Electroporator and CAR gene construct (e.g., via transposon system).
- GMP-grade cell culture media and reagents.
- Quality control (QC) analytical tools for sterility, potency, and identity testing.
3. Methodology:
- Day 0: Cell Selection and Activation
- Transfer the leukapheresis product directly into the closed automated system.
- Perform cell washing and concentration using integrated centrifugation.
- Isolate and activate T cells using magnetic bead-based selection within the closed system.
- Day 1: Genetic Modification
- Without expanding the cells, perform non-viral gene transfer via electroporation to introduce the CAR construct.
- This step bypasses the need for viral vector production and transduction.
- Days 1-7: Abbreviated Ex Vivo Expansion
- Transfer the electroporated cells into a culture medium within a closed bioreactor bag or chamber.
- Allow for a shortened expansion period (e.g., 5-7 days, targeting a ~15-fold expansion) instead of the traditional 2-3 weeks.
- Monitor cell density and viability using integrated or at-line analytics.
- Day 7-9: Harvest and Formulate
- Once the target cell count is met, harvest the drug product.
- Wash and formulate the final CAR-T cell product in an infusion-ready buffer.
- Perform final QC testing with rapid turnaround assays.
- Day 9-10: Infusion
- Release and transport the fresh (non-cryopreserved) drug product to the adjacent clinical unit for patient infusion.
4. Key Considerations:
- Regulatory: Engage with regulatory agencies early to validate the POC model and the abbreviated QC testing strategy.
- Training: Ensure on-site personnel are extensively trained on the integrated closed system.
- Analytical Comparability: Demonstrate that CAR-T cells produced with this rapid process are comparable or superior in phenotype and function to those from legacy processes.
Process Flow: Legacy vs. Point-of-Care Manufacturing
The diagram below illustrates the fundamental differences in workflow and complexity between a centralized legacy model and a decentralized point-of-care model.
The Scientist's Toolkit: Research Reagent & Solution Guide
Table 3: Key Reagents and Technologies for Modernizing Autologous Therapy Manufacturing
| Item | Function in Manufacturing | Rationale for Use |
|---|---|---|
| Closed, Automated Systems (e.g., Cocoon, Prodigy, MARS) | Integrates multiple unit operations (selection, activation, expansion) into a single, closed workflow. | Reduces manual labor, minimizes contamination risk, and improves process consistency and scalability [16] [12] [2]. |
| Non-Viral Transfection Systems (e.g., Electroporation with Transposons) | Delivers genetic material (CAR transgene) into T cells without using viral vectors. | Avoids high cost and supply chain bottlenecks of viral vectors; simplifies the manufacturing process [8] [12]. |
| GMP-Manufactured, Serum-Free Media | Provides defined nutrients for cell growth and expansion under standardized conditions. | Ensures product safety, consistency, and compliance with regulatory standards; reduces variability from batch-to-batch [16]. |
| Magnetic Activation/Cell Sorting (MACS) Beads | Used for the isolation and activation of specific cell populations (e.g., T cells) from apheresis product. | Enables high cell purity and recovery; a critical first step in creating a consistent starting population for engineering [12]. |
| Single-Use, Closed Consumables | Bioreactor bags, tubing sets, and fluid transfer kits designed for automated systems. | Maintains a closed processing environment, eliminates cross-contamination, and reduces cleaning validation requirements [16] [15]. |
Troubleshooting Guides
Guide 1: Troubleshooting Temperature Excursions
Problem: A cryogenic shipment of autologous CAR-T cells has been exposed to a temperature excursion, with monitoring data showing it briefly reached -110°C.
Investigation & Resolution:
- Step 1: Assess Severity: Determine the duration and magnitude of the excursion. Compare the internal temperature data from the logger against the validated stability range for the product (typically below -130°C to -150°C for cell therapies) [18].
- Step 2: Inspect Physical State: Upon receipt, visually inspect the cryogenic shipper and the condition of the liquid nitrogen or dry vapor. Check the data from the continuous monitoring system for any signs of shock or impact [18] [19].
- Step 3: Execute Contingency Protocol: Follow predefined corrective and preventive actions (CAPA). This may involve quarantining the product and performing rapid viability and potency assays on a retained sample or a small aliquot to assess any impact on cell integrity [20].
- Step 4: Root Cause Analysis: Investigate the shipping route for potential delays, such as customs holds or flight cancellations. Verify the pre-qualification status of the thermal shipper and the conditioning of the phase-change materials [18].
Preventive Measures:
- Use dual-temperature monitoring systems with real-time GPS and cellular data transmission for immediate alerting [18] [19].
- Validate packaging for a duration exceeding the expected transit time by at least 20% to create a safety buffer [18].
- Implement IoT-enabled real-time monitoring systems that provide alerts for deviations, ensuring immediate corrective action can be taken [20].
Guide 2: Managing Apheresis Material Variability
Problem: Inconsistent quality of the starting leukapheresis material from different clinical sites, leading to variable cell expansion and manufacturing failures.
Investigation & Resolution:
- Step 1: Standardize Collection: Implement standardized apheresis collection kits and detailed SOPs across all clinical sites. Provide targeted training for site staff on leukapheresis procedures [21].
- Step 2: Pre-shipment Assessment: Incorporate pre-shipment quality checks at the collection site, such as viable cell count and flow cytometry, to reject out-of-spec material before it enters the logistics chain [22].
- Step 3: Optimize Logistics: Reduce door-to-door transport time for apheresis material to under 40-50 hours to minimize cell senescence [19]. Use lean, direct shipping lanes and ensure manufacturing sites have flexible receiving hours [19].
- Step 4: Decentralize Collection: Consider using mobile leukapheresis units or partnering with regional blood centers to standardize collection, reduce site activation time, and bring the process closer to patients [21].
Preventive Measures:
- Establish clear and narrow acceptance criteria for incoming apheresis material (e.g., cell viability, CD3+ count, monocyte percentage) [22].
- Develop a robust supplier qualification program for clinical sites and apheresis centers [23].
Guide 3: Addressing Manufacturing Capacity Bottlenecks
Problem: Inability to scale autologous therapy production due to a lack of manufacturing slots, leading to increased vein-to-vein times.
Investigation & Resolution:
- Step 1: Audit Internal Process: Map the entire vein-to-vein process to identify specific bottlenecks, whether in scheduling, cell expansion, or quality control (QC) testing [1].
- Step 2: Implement Automation: Introduce closed, automated systems for cell processing to reduce hands-on time, minimize contamination risk, and improve process consistency [1] [23].
- Step 3: Partner Strategically: Engage with CDMOs that have flexible, modular GMP suites designed for parallel processing of multiple autologous batches [23]. This is a scale-out rather than a scale-up strategy [23].
- Step 4: Optimize QC Testing: Shift to rapid, near-patient release assays or explore parametric release to reduce the QC hold time, which is a critical path item [1].
Preventive Measures:
- Invest in advanced scheduling IT systems that automatically coordinate patient apheresis, manufacturing capacity, and logistics [19].
- Explore decentralized, patient-adjacent manufacturing models to reduce logistics complexity and vein-to-vein time [1] [19].
Frequently Asked Questions (FAQs)
Q1: What are the critical temperature ranges for cell and gene therapies, and why are they so strict? Cell therapies are exquisitely sensitive to temperature. The key ranges are:
- Cryogenic (-150°C and below): Used for long-term storage of cell therapies to halt all metabolic activity and preserve viability [18].
- Ultra-low (-70°C to -80°C): Used for transport and short-term storage of some gene therapies and reagents [18]. Even short excursions can cause ice crystal formation, cell death, or loss of potency, rendering the personalized, high-cost product unusable [18].
Q2: What is the difference between Chain of Identity (COI) and Chain of Custody (COC)?
- Chain of Identity (COI): A system that uses unique identifiers to track the biological product from the initial patient tissue procurement all the way through to final administration to that same patient. This is critical for autologous therapies to prevent misadministration [18].
- Chain of Custody (COC): The documented sequence of custody and control for a product as it is transferred between parties (e.g., from courier to manufacturing site to QC lab) [18].
Q3: Our autologous therapy is struggling with high costs. Where in the supply chain should we focus cost-reduction efforts? The highest cost drivers are often:
- Manual, Labor-Intensive Processes: Prioritize investments in automation and closed-system processing to reduce hands-on time and contamination risk [1] [23].
- Logistics: Optimize shipping lanes and use validated packaging with a sufficient buffer to minimize the risk of costly product losses [19].
- Raw Materials: Transition from serum-based to defined, serum-free media to reduce cost, variability, and supply chain dependency on the volatile cattle industry [22].
Q4: How can we reduce vein-to-vein time for our autologous therapy? A multi-pronged approach is necessary:
- Streamline Logistics: Use real-time monitoring and dedicated couriers to minimize transit time [19].
- Improve Scheduling: Implement advanced IT systems that seamlessly coordinate apheresis appointments, manufacturing slots, and patient conditioning schedules [19].
- Accelerate Testing: Integrate rapid release assays or explore parametric release to shorten the QC timeline [1].
- Decentralize Collection: Utilize mobile apheresis to bring starting material collection closer to the patient, reducing initial transport leg [21].
Key Data Tables
Table 1: Critical Temperature Ranges for Cell and Gene Therapy Products
| Temperature Range | Common Applications | Key Risks & Considerations |
|---|---|---|
| Cryogenic (< -150°C) | Long-term storage of cell therapies (e.g., CAR-T); Preservation in liquid nitrogen [18] | Intracellular ice formation upon improper freezing/thawing; requires liquid nitrogen systems [18] |
| Ultra-Low (-70°C to -80°C) | Storage/transport of gene therapy vectors (AAV); some reagents [18] | RNA degradation; temperature fluctuations can compromise viral vector potency [18] |
| Refrigerated (2°C to 8°C) | Short-term storage of certain cell types; ready-to-use reagents [18] | Reduced cell viability over time; limited shelf-life [18] |
| Controlled Room Temp (15°C to 25°C) | Handling and preparation of final product for administration [18] | Critical to minimize out-of-range exposure during product thaw and preparation [18] |
Table 2: Common Supply Chain Bottlenecks and Mitigation Strategies
| Bottleneck Category | Specific Challenge | Proposed Mitigation Strategy |
|---|---|---|
| Material Sourcing | Shortage/single source of critical reagents (e.g., Hespan) [24] | Proactively qualify alternative sources or reformulate media [24] |
| Material Sourcing | High variability in incoming apheresis material [22] | Implement strict acceptance criteria and standardize collection protocols across sites [22] [21] |
| Logistics | Temperature excursions during transport [18] | Use dual real-time monitors and validate packaging for extended durations [18] [20] |
| Logistics | Global shipping delays (customs, weather) [22] | Develop contingency plans, use specialized logistics partners, and diversify shipping routes [18] |
| Manufacturing | High cost and limited capacity for autologous batches [1] [22] | Adopt automation, closed systems, and a scale-out strategy with modular manufacturing [1] [23] |
| Manufacturing | Lack of skilled staff [22] | Invest in training programs and develop intuitive, automated platforms [1] [22] |
Experimental Protocols
Protocol: Validation of a Cryogenic Shipping System
Objective: To qualify a cryogenic shipper for the transport of autologous cell therapy products over a defined maximum transit duration.
Methodology:
- Instrumentation: Place calibrated temperature data loggers at the core, mid-point, and surface locations within the shipping container.
- Conditioning: Condition the shipper according to the manufacturer's instructions, typically charging it with liquid nitrogen for the specified duration.
- Thermal Challenge: Expose the loaded shipper to a simulated worst-case transport profile in an environmental chamber, including temperature extremes (e.g., from -20°C to +40°C) and static hold periods.
- Duration: Run the test for a period that is 20-30% longer than the maximum expected transit time to establish a safety buffer [18].
- Data Analysis: Download and analyze temperature data to confirm that all internal monitoring points remained within the target range (e.g., below -150°C) for the entire duration.
Protocol: Viability and Potency Assay for Post-Thaw Cells
Objective: To rapidly assess the impact of a supply chain event (e.g., temperature excursion) on cell quality.
Methodology:
- Sample Thaw: Rapidly thaw a small, representative aliquot of the cryopreserved product in a 37°C water bath with gentle agitation.
- Viability Staining: Mix cells with Trypan Blue or a fluorescent viability dye (e.g., propidium iodide) and count using an automated cell counter or flow cytometer. Acceptable viability is typically >70-80%, but product-specific limits must be set.
- Potency Assay (Rapid): Perform a flow cytometry-based assay to check for critical surface markers (e.g., CD3/CD28 for T-cells) or a functional assay like a simplified cytokine release assay upon stimulation.
- Acceptance Criteria: Compare results against historical data and predefined specifications for the product to make a lot disposition decision.
Visualizations
Diagram 1: Autologous Cell Therapy Vein-to-Vein Workflow
Diagram 2: Cold Chain Monitoring & Intervention System
The Scientist's Toolkit: Research Reagent Solutions
Table 3: Essential Materials for Cell Therapy Logistics & Analytics
| Reagent / Material | Function in Supply Chain & Manufacturing | Key Consideration |
|---|---|---|
| Dimethyl Sulfoxide (DMSO) | A cryoprotectant (CPA) that prevents lethal ice crystal formation during freezing and thawing [18]. | Typically used at 5-10% concentration; requires strict GMP compliance and controlled freezing rates for optimal viability [18]. |
| Serum-Free Media | A defined, xeno-free cell culture medium for cell expansion. Reduces variability and supply chain risk compared to serum-based media [22]. | Sourcing high-quality, regulatory-approved serum-free media is challenging but critical for process consistency and scalability [22]. |
| Cryogenic Shipping Containers | Specialized shippers (e.g., dry vapor shippers) maintain temperatures below -150°C for up to 14 days, enabling global distribution [18]. | Must be validated for the specific transit time and external temperature profile. Real-time monitoring devices are often integrated [18]. |
| Viability & Potency Assay Kits | Used for quality control at receipt and release. Examples include flow cytometry-based kits and functional cytokine release assays. | Rapid, standardized kits are essential to minimize vein-to-vein time. Moving towards near-patient or point-of-care testing is a key goal [1]. |
Autologous cell therapies represent a revolutionary advance in personalized medicine, but their economic sustainability is challenged by complex and costly manufacturing processes. This technical support center provides researchers and drug development professionals with actionable strategies and detailed protocols to analyze and reduce these cost structures, supporting the broader thesis that innovation in manufacturing is key to making these life-saving therapies more accessible.
Frequently Asked Questions (FAQs)
What are the primary drivers of high costs in autologous cell therapy manufacturing?
- Labor Intensity: Manual processes account for approximately 50% of the total Cost of Goods Sold (CoGS), requiring highly specialized technicians working in cleanroom environments [25] [26].
- Personalized Production: Each patient batch is unique, preventing economies of scale and requiring separate quality control testing and documentation [27].
- Raw Materials: High-cost materials, particularly viral vectors for genetic modification, and specialized cell culture reagents contribute significantly to expenses [8] [25].
- Facility Requirements: Current Good Manufacturing Practice (cGMP) grade B cleanrooms are capital-intensive to build and maintain [25].
- Quality Control: Each patient batch undergoes full sterility and identity testing, extending release timelines by up to seven days and adding substantial costs [27].
How can automation reduce manufacturing costs?
- Labor Reduction: Automated closed systems can reduce hands-on operator time from over 24 hours to approximately six hours per batch [26].
- Improved Consistency: Automation minimizes human error and batch-to-batch variability, reducing manufacturing failures and improving product quality [28].
- Reduced Contamination Risk: Closed systems lower contamination risks, decreasing batch failures and the need for repeat collections [26].
- Lower Facility Costs: Automated closed systems can enable manufacturing in lower-grade (Grade C) cleanrooms, reducing capital and operating expenses [25].
What are the most promising technologies for cost reduction?
- Closed-Loop Automated Systems: Integrate real-time monitoring and automated process adjustments to standardize manufacturing [26].
- Non-Viral Vector Systems: Technologies like Sleeping Beauty, piggyBac, and CRISPR delivered via nanoparticles or electroporation can replace expensive viral vectors [8].
- Point-of-Care Manufacturing: Decentralized production using platforms like Ori Biotech's IRO or Orgenesis's OMPUL mobile units can reduce logistics costs by up to $35,000 per lot [8] [27].
- Artificial Intelligence: AI-powered systems optimize cell culture processes through predictive analytics, potentially reducing production costs significantly [29].
Cost Structure Analysis Tables
Table 1: Manufacturing Cost Breakdown for Autologous Cell Therapies
| Cost Component | Percentage of Total Cost | Impact Factors | Potential Reduction Strategies |
|---|---|---|---|
| Labor | 50% [25] | Manual processing time, cleanroom requirements, specialized personnel | Automation, closed systems, reduced headcount [25] [26] |
| Materials & Consumables | 20-30% (estimated) | Viral vectors, cell culture media, single-use assemblies | Media aliquoting, non-viral vectors, bulk purchasing [8] [25] |
| Quality Control/Assurance | 10-15% (estimated) | Sterility testing, identity testing, release documentation | Rapid testing methods, in-process analytics [27] |
| Facility & Equipment | 15-20% (estimated) | Cleanroom classification, capital equipment, maintenance | Grade C cleanrooms, shared manufacturing facilities [25] |
| Logistics & Storage | 5-10% (estimated) | Cryopreservation, transportation, chain of identity management | Point-of-care manufacturing, cryopreserved cell banking [27] |
Table 2: Economic Impact of Implementing Cost-Reduction Technologies
| Technology | Capital Investment | Operational Cost Reduction | Implementation Timeline | Key Benefits |
|---|---|---|---|---|
| Partial Automation | ~$10.6 million [25] | ~30% per batch [26] | Medium-term (1-2 years) | Increased throughput (84 batches/year), flexibility [25] |
| Full Automation | ~$11.3 million [25] | 30-50% per batch [26] | Long-term (2-3 years) | Highest consistency, minimal manual intervention [25] |
| Point-of-Care Systems | Varies by scale | $35,000 per lot in logistics [27] | Short-term (<1 year) | Reduced vein-to-vein time, improved patient access [27] |
| Non-Viral Vector Systems | R&D intensive | 40-60% vector cost reduction [8] | Medium-term (2-4 years) | Simplified manufacturing, improved safety profile [8] |
Experimental Protocols for Cost Analysis
Protocol 1: Labor Cost Analysis in Cell Therapy Manufacturing
Objective: Quantify labor components in autologous cell therapy production to identify targets for automation.
Materials:
- Time-tracking software
- Process mapping templates
- Cleanroom operation logs
- Personnel cost data
Methodology:
- Process Decomposition: Break down manufacturing into discrete steps: apheresis receipt, cell processing, genetic modification, expansion, harvest, formulation, and quality control.
- Time-Motion Study: Track technician time for each process step across multiple batches (minimum 10 batches for statistical significance).
- Cost Attribution: Assign labor costs using the formula: Labor Cost = (Time × Labor Rate) + (Supervision × Overhead Rate).
- Automation Potential Assessment: Categorize each step as "fully automatable," "partially automatable," or "manual essential" based on technology availability.
Expected Output: Identification of 3-5 highest labor-cost process steps prioritizing automation investment.
Protocol 2: Material Cost Optimization Through Media Management
Objective: Reduce raw material costs without compromising cell viability or expansion efficiency.
Materials:
- Baseline cell culture media
- Sub-aliquoting equipment
- Sterile transfer sets
- Cell viability assays
- Cell counting equipment
Methodology:
- Consumption Analysis: Document media usage patterns across multiple batches, identifying overage and waste.
- Sub-aliquoting Strategy: Implement media kits prepared by sub-aliquoting into smaller containers matching process requirements.
- Waste Tracking: Measure non-contaminated waste reduction in liters per batch.
- Quality Assessment: Compare cell viability, expansion fold, and potency markers between baseline and optimized protocols.
Expected Outcome: Savings of approximately $1,450 per batch and reduction of 13L waste per batch [25].
Manufacturing Cost Reduction Workflows
The Scientist's Toolkit: Research Reagent Solutions
Table 3: Essential Materials for Cost-Effective Autologous Therapy Research
| Reagent/Material | Function in Research | Cost-Reduction Application | Key Suppliers/Brands |
|---|---|---|---|
| Non-viral Transfection Systems | Genetic modification without viral vectors | Replaces expensive viral vector systems; reduces safety testing [8] | Sleeping Beauty, piggyBac, CRISPR-based systems |
| Closed-system Bioreactors | Cell expansion in automated, sealed environment | Reduces cleanroom requirements; minimizes manual intervention [26] [27] | Terumo Quantum, Octane Biotech Cocoon, Ori Biotech IRO |
| Serum-free Media Formulations | Cell culture without animal-derived components | Enhances batch consistency; reduces contamination risk [25] | Various GMP-grade commercial formulations |
| Rapid QC Assays | In-process quality testing | Shortens release times from days to hours [28] | Next-generation sequencing, flow cytometry panels |
| Cryopreservation Media | Long-term cell storage | Enables cell banking; de-risks manufacturing scheduling [27] | GMP-grade, defined composition formulations |
| Single-use Biocontainers | Closed fluid path for processing | Reduces cross-contamination risk; eliminates cleaning validation [25] | Various bioprocess container manufacturers |
Troubleshooting Common Cost Analysis Challenges
Challenge 1: Incomplete Cost Capture Problem: Traditional accounting systems miss hidden costs in autologous therapy manufacturing. Solution: Implement activity-based costing that tracks expenses per patient batch, including indirect costs like quality control, facility maintenance, and equipment depreciation.
Challenge 2: Variable Process Efficiency Problem: Inconsistent cell expansion rates and transduction efficiencies create cost unpredictability. Solution: Develop process capability indices (CpK) for critical steps like cell expansion and viral transduction to quantify variability and prioritize improvement efforts.
Challenge 3: Technology Implementation Justification Problem: Difficulty quantifying return on investment for automation technologies. Solution: Use Net Present Cost (NPC) analysis with a 15-year project life and 10% discount rate to evaluate long-term financial impact of capital investments [25].
Reducing manufacturing costs for autologous cell therapies requires a systematic approach targeting the highest-impact cost drivers. The most effective strategy combines technological innovation with process optimization:
- Short-term (0-12 months): Implement labor reduction through partial automation and material management strategies.
- Medium-term (1-3 years): Deploy closed-loop automated systems and explore non-viral vector platforms.
- Long-term (3-5 years): Establish decentralized point-of-care manufacturing networks supported by AI-driven process control.
Through these approaches, the field can achieve the dual goals of making autologous cell therapies economically sustainable while expanding patient access to these transformative treatments.
Innovative Technologies and Processes for Cost-Reduction
FAQs and Troubleshooting Guides
Frequently Asked Questions
Q1: What are the fundamental differences between open, modular, and integrated closed systems in cell therapy manufacturing?
A1: The choice between these systems significantly impacts contamination risk, scalability, and process flexibility.
- Open Systems: Expose the cell product to the room environment during processing. They are susceptible to contamination, require Grade A or B cleanrooms, and introduce significant batch-to-batch variability due to manual handling [30].
- Modular Closed Systems: Each instrument is designed for a specific unit operation (e.g., separation, expansion) but operates as a closed, sterile unit. This offers flexibility to mix-and-match best-in-class instruments and is easier to integrate into existing workflows. However, it may require some manual transfer between modules [30].
- Integrated Closed Systems: Fully automated, end-to-end platforms that perform all manufacturing steps within a single, closed system. They minimize human intervention, drastically reduce contamination risks, and can operate in Controlled Not-Classified (CNC) environments, but offer less process flexibility [31] [30].
Q2: Our manufacturing process consistently shows low cell recovery after the initial separation step. What could be causing this?
A2: Low cell recovery at the separation stage is a common bottleneck often linked to the chosen technology and starting material.
- Technology Limitations: Traditional methods like density gradient centrifugation can result in the loss of up to 80% of potential therapeutic cells due to multiple wash cycles. Magnetic selection typically recovers only about 60% of abundant target cells [32].
- Troubleshooting Steps:
- Evaluate Alternative Technologies: Consider adopting newer, gentler separation technologies like deterministic cell separation (DCS) using microfluidics, which can recover a much larger percentage of key immune cells without chemical or mechanical stress [32].
- Assess Starting Material: Patient-specific factors, especially in late-stage cancer patients, can lead to a weakened immune system and a low yield of starter T cells at apheresis. Closely monitor the quality and composition of the incoming apheresis material [32].
- Optimize Process Parameters: For centrifugal systems, ensure that parameters like speed, flow rate, and buffer composition are optimized for your specific cell type [16] [33].
Q3: We are experiencing variable cell expansion rates. How can automation and process control improve consistency?
A3: Variability in expansion is often due to differences in manual culture techniques, feeding schedules, and environmental conditions.
- Root Cause: Manual processing is prone to protocol drift and differences between technical staff, leading to inconsistent nutrient levels, waste accumulation, and cell health [34].
- Automated Solution: Integrated bioreactor systems with closed-loop control can continuously monitor and adjust critical parameters such as dissolved oxygen (DO), acidity (pH), and temperature in real-time [31]. Furthermore, automated perfusion systems ensure consistent nutrient delivery and waste removal, creating a stable and optimal environment for cell growth [31] [30]. This leads to highly reproducible expansion profiles and improved final cell quality.
Q4: What are the key software and data integrity considerations when implementing an automated closed system?
A4: Digital integration is crucial for regulatory compliance and process optimization.
- 21 CFR Part 11 Compliance: The software controlling your manufacturing process must comply with electronic record and signature regulations. Look for systems with built-in compliance features [16] [30].
- Electronic Batch Records: Automated systems can generate electronic batch records, improving data accuracy, traceability, and reducing manual documentation errors [31].
- Real-Time Process Monitoring: Software solutions enable real-time monitoring of the entire workflow, allowing for proactive intervention and data-driven process optimization [16] [30]. This data is invaluable for investigating batch failures and demonstrating control to regulators.
Troubleshooting Guides
Problem: Consistent Bacterial Contamination in Final Product
| Possible Cause | Investigation Steps | Corrective and Preventive Actions |
|---|---|---|
| Failure in sterile connections or integrity breach in single-use sets. | Review aseptic technique logs and environmental monitoring data from the cleanroom. Check integrity seals on all consumables pre-use. | Re-train staff on aseptic connection techniques (e.g., sterile welding, tube sealing). Implement a closed-system transfer policy. Switch to pre-sterilized, closed, single-use consumables [30] [33]. |
| Ineffective decontamination of system components or inputs. | Verify decontamination cycle logs (e.g., hydrogen peroxide vapor cycles). Test bioburden on incoming reagents and viral vectors. | Ensure all consumables undergo validated decontamination cycles before entering the closed system [31]. Strengthen incoming quality control (QC) for all raw materials. |
| Environmental contamination from operating an open process or in an inadequate cleanroom. | Review cleanroom classification and particle count data. | Transition from open manual processes to closed, automated systems that can operate in a CNC environment, eliminating the primary contamination vector [30] [33]. |
Problem: Low Transduction or Transfection Efficiency during Genetic Modification
| Possible Cause | Investigation Steps | Corrective and Preventive Actions |
|---|---|---|
| Suboptimal cell health or activation state prior to gene editing. | Check cell viability and activation markers (e.g., CD69, CD25) immediately before electroporation/transduction. | Optimize the pre-activation culture conditions and duration. Ensure cells are in the correct growth phase for efficient genetic modification. |
| Inefficient process parameters for electroporation or viral transduction. | Test a range of parameters (e.g., voltage, pulse length for electroporation; MOI, spinoculation for viral transduction) in small-scale experiments. | Use an automated system that allows for customization and optimization of electroporation parameters [31]. Ensure reagents (viral vectors, CRISPR complexes) are fresh and of high quality. |
| Variable reagent quality or delivery. | QC test viral vector titers and plasmid purity. | Implement automated, just-in-time reagent delivery systems to ensure consistency [31]. Partner with vendors for GMP-manufactured, high-quality reagents [16]. |
Quantitative Data for System Selection
The table below summarizes performance data for key unit operations in cell therapy manufacturing, helping you select the right technology for your process.
Table 1: Performance Comparison of Cell Processing Systems
| System / Technology | Core Technology | Typical Cell Recovery | Input Volume Range | Key Applications | Reference |
|---|---|---|---|---|---|
| CTS Rotea System | Counterflow Centrifugation | 95% | 30 mL – 20 L | Cell washing, concentration, buffer exchange [16] | [30] |
| CliniMACS Prodigy (CD34+ Enrichment) | Magnetic Selection | ~70% | N/A (Leukapheresis or Cord Blood) | Cell isolation, selection, and culture | [33] |
| Deterministic Cell Separation (DCS) | Microfluidics | Higher than magnetic/centrifugation | N/A | Gentle, high-recovery T cell isolation | [32] |
| LOVO System | Spinning Membrane Filtration | 70% | 30 mL – 22 L | Cell concentration and medium exchange | [30] |
Table 2: Impact of Automation on Manufacturing Metrics
| Metric | Traditional Manual Process | Automated Closed System | Reference |
|---|---|---|---|
| Process Failure Rate | Baseline | Up to 75% reduction | [31] [33] |
| Labor Requirement | Baseline | Up to 90% less | [31] |
| Facility Space | Baseline (requires cleanroom) | Up to 90% less (can use CNC) | [31] |
| Batch Processing | Single batch | 16 batches in parallel (e.g., Cell Shuttle) | [31] |
Essential Reagents and Materials
Table 3: Research Reagent Solutions for Automated Cell Therapy Manufacturing
| Reagent / Material | Function | Key Consideration for Automation & GMP |
|---|---|---|
| GMP-grade Cell Culture Media (e.g., Gibco CTS) | Supports cell growth, expansion, and maintenance. | Formulated for consistency, with low endotoxin and full traceability. Essential for regulatory filings [16]. |
| Cell Separation Kits (e.g., for Magnetic Selection) | Isolates target cell populations (e.g., T cells, CD34+ cells) from apheresis or tissue. | Use sterile, single-use kits that are compatible with your automated platform (e.g., TS310 tubing set for CliniMACS Prodigy) [33]. |
| Genetic Modification Reagents (e.g., CRISPR, Viral Vectors) | Introduces genetic material (e.g., CAR) into target cells. | For automation, use reagents compatible with electroporation or sterile liquid transfer systems. GMP-manufactured viral vectors are critical [8] [31]. |
| Single-Use Bioprocess Containers | Stores media, buffers, and intermediate or final products. | Automation-friendly designs with integrated sensors for real-time volume tracking are ideal (e.g., SLTDs for the Cellares Cell Shuttle) [31]. |
Workflow and System Diagrams
The following diagram illustrates the logical decision pathway for addressing the common problem of low cell recovery.
This diagram outlines the core workflow of an automated, closed system for manufacturing autologous cell therapies, highlighting the reduction of manual interventions.
The advancement of autologous cell therapies, such as CAR-T cell therapy, has revolutionized cancer treatment. However, their widespread application is heavily constrained by prohibitively high manufacturing costs [8] [35]. Key factors driving these costs include the reliance on viral vectors (e.g., lentivirus, gamma-retrovirus), which require complex and expensive production processes, advanced laboratory facilities, and extensive safety testing [36] [37]. Non-viral vector systems represent a paradigm shift, offering streamlined, cost-effective alternatives for genetic modification. This technical support center focuses on three prominent non-viral platforms—the Sleeping Beauty and piggyBac transposon systems, and CRISPR-based gene editing—providing troubleshooting and methodological guidance to help researchers overcome technical hurdles and accelerate the development of affordable autologous therapies.
Research Reagent Solutions
The table below lists essential reagents and their functions for experiments utilizing non-viral gene editing systems in T cell engineering.
Table 1: Key Reagents for Non-Viral T Cell Engineering
| Reagent Category | Specific Examples | Primary Function in Experimental Workflow |
|---|---|---|
| Transposon System Components | Sleeping Beauty Transposon Plasmid, piggyBac Transposon Plasmid | Contains the gene of interest (e.g., CAR) flanked by inverted terminal repeats (IRs) for genomic integration. |
| Transposase Enzyme | Sleeping Beauty Transposase, piggyBac Transposase | Enzyme that catalyzes the "cut-and-paste" integration of the transposon into the host genome. |
| CRISPR Components | Cas9 Nuclease (protein/mRNA), sgRNA, HDR Template | Facilitates precise genome editing; sgRNA guides Cas9 to a specific genomic locus, where it creates a double-strand break for repair via a supplied template. |
| Delivery Vehicle | Electroporation System, Lipid Nanoparticles (LNPs) | Physically or chemically delivers editing components (DNA, RNA, proteins) into the target T cells. |
| Cell Culture Media | T cell Expansion Media, Cytokines (e.g., IL-2, IL-7/IL-15) | Supports the activation, survival, and ex vivo expansion of genetically modified T cells. |
Experimental Workflow & Data
Standard Workflow for Non-Viral T Cell Engineering
The following diagram outlines a generalized protocol for engineering T cells using non-viral methods, applicable to both transposon systems and CRISPR-based editing.
Quantitative Comparison of Gene Delivery Platforms
Understanding the relative advantages of non-viral systems is crucial for selecting the right platform for cost-effective manufacturing.
Table 2: Comparison of Gene Delivery Vector Platforms
| Feature | Viral Vectors (e.g., LV, γ-RV) | Transposon Systems (SB, piggyBac) | CRISPR (Non-Viral Delivery) |
|---|---|---|---|
| Production Timeline | 6 months to 1 year [37] | ~1 month (plasmid production) [37] | Varies; reagents quickly available |
| Relative Production Cost | High (complex production & safety testing) [37] | ~1/4 the cost of viral vectors [37] | Lower (simpler reagent production) |
| Integration Mechanism | Semi-random (viral integration) | Semi-random (TTAA for piggyBac) [37] | Can be targeted (with HDR) or non-integrating |
| Cargo Capacity | Large (up to ~10 kb for γ-RV) [36] | Very Large (theoretically > 100 kb) | Limited by delivery method (e.g., LNP capacity) |
| Key Safety Concerns | Insertional mutagenesis, immune response to viral vectors [36] | Insertional mutagenesis (potentially more random pattern) [37] | Off-target editing, immunogenicity to Cas9 |
| Primary Delivery Method | Viral transduction | Electroporation [37] | Electroporation or Lipid Nanoparticles (LNPs) [36] [38] |
| Ideal for Scalability | Challenging and costly | More amenable to scaling with automation | High potential for scalable LNP production |
Troubleshooting FAQs
Q1: We are observing low gene transfer efficiency using the piggyBac transposon system in primary human T cells. What are the potential causes and solutions?
- Cause (Delivery): The electroporation parameters may be suboptimal or toxic, leading to poor cell health and low uptake of the transposon and transposase plasmids [37].
- Solution: Perform an electroporation optimization kit using a reporter plasmid. Systematically test different voltage, pulse length, and cell density conditions. Ensure you are using high-quality, endotoxin-free plasmid DNA.
- Cause (Component Ratio): An improper ratio between the transposon plasmid (carrying your gene of interest) and the transposase plasmid can drastically affect integration efficiency.
- Solution: Titrate the amount of transposase plasmid while keeping the transposon plasmid constant. A typical starting ratio is a 1:1 mass ratio, but optimal ratios can vary. Using transposase delivered as in vitro-transcribed (IVT) mRNA can sometimes enhance efficiency and reduce toxicity.
Q2: After successful CRISPR editing in T cells, we notice reduced cell viability and expansion. How can this be mitigated?
- Cause (Delivery Toxicity): Electroporation of CRISPR ribonucleoproteins (RNPs) can be stressful to primary T cells. The CRISPR-Cas9 system itself, by creating double-strand breaks, can also induce cell cycle arrest or apoptosis in a subset of cells.
- Solution: Optimize the delivery method. Consider using lipid nanoparticles (LNPs), which have been shown in clinical trials to be well-tolerated and allow for even redosing [38]. When using electroporation, ensure the parameters are optimized for cell health over maximum delivery efficiency. Using a high-fidelity Cas9 enzyme can also minimize off-target stress.
- Cause (Culture Conditions): The cells may not be receiving adequate support post-editing.
- Solution: Review your culture media and cytokine cocktail. Supplementing with IL-7 and IL-15, as opposed to IL-2 alone, can help promote the survival and expansion of less-differentiated, stem cell-like memory T cells, which are more resilient to the editing process [1].
Q3: Our lab wants to transition from viral vectors to a non-viral system to reduce costs. What is the most significant strategic consideration?
- Answer: The most significant consideration is embracing a patient-specific, decentralized, or point-of-care (POC) manufacturing model [8] [35]. Viral vectors are central to a centralized manufacturing paradigm due to their complex production. The simplicity of non-viral reagents like plasmids and LNPs enables their use in automated, closed-system bioreactors at or near the treatment site (decentralized manufacturing). This eliminates the massive logistical costs of shipping a patient's cells to a central facility and back, which is a major contributor to the high cost of autologous therapies [8] [1]. Adopting non-viral technology is not just a reagent swap; it's a fundamental rethinking of the therapy production workflow to be more agile and cost-effective.
Q4: We are concerned about the long-term stability of transgene expression from non-viral systems. Is transgene silencing an issue with the piggyBac system?
- Answer: Available evidence is promising. A key study investigating long-term gene expression from the piggyBac transposon in human T cell clones found no evidence of transgene silencing over six months in culture [37]. The transgene expression remained responsive to T cell receptor (TCR) activation and epigenetic modulators, indicating that the transposon did not integrate into a transcriptionally silent genomic region. This stability is critical for clinical applications where persistent CAR or TCR expression is necessary for durable therapeutic efficacy.
Q5: For in vivo gene editing, what are the key advantages of using Lipid Nanoparticles (LNPs) over viral vectors like AAV?
- Answer: LNPs offer several distinct advantages for in vivo delivery of CRISPR components, as demonstrated in recent clinical trials [38]:
- Redosability: Unlike AAV, which often elicits a strong immune response that prevents effective re-administration, LNPs do not trigger the same immunogenicity. This has allowed patients in trials to receive multiple doses to increase editing efficiency [38].
- Safety Profile: LNPs avoid the risk of insertional mutagenesis associated with integrating viral vectors and reduce the risk of persistent off-target editing because the CRISPR components are transiently expressed.
- Tropism and Targeting: While naturally tending to accumulate in the liver, LNP formulations can be engineered to target specific tissues, expanding their therapeutic potential [38].
What is process intensification in the context of cell therapy manufacturing?
Process intensification involves modifying manufacturing processes to achieve significant improvements in productivity, efficiency, and cost-effectiveness. For autologous cell therapies like CAR-T cells, this primarily focuses on reducing expansion times, increasing final cell yields, and enhancing product quality while transitioning to more consistent, serum-free media formulations. Implementing intensified processes is essential for reducing the manufacturing costs and improving the accessibility of these personalized therapies [39].
Why is there a pressing need to shorten expansion times?
The ex vivo expansion of patient-derived cells represents one of the longest phases in autologous therapy manufacturing, typically ranging from 7–14 days [39]. This prolonged timeline:
- Increases costs (approximately $400K per dose) [39]
- Risks manufacturing failure (up to 13% of failures are due to suboptimal cell growth) [39]
- Poses critical risks for patients with rapidly progressing diseases who cannot afford long waits [39]
Experimental Protocols & Methodologies
Optimizing Perfusion for CAR-T Cell Expansion
Recent research demonstrates that perfusion processes can drastically reduce expansion times. The following protocol outlines a systematic approach for optimization [39].
Aim: To intensify CAR-T cell expansion using perfusion in xeno- and serum-free (XF/SF) medium.
Key Materials & Equipment:
- Bioreactor System: Ambr 250 High-Throughput Perfusion stirred-tank bioreactor
- Culture Medium: Xeno-free, serum-free medium (e.g., 4Cell Nutri-T GMP)
- Cells: Activated and transduced CAR-T cells from donor apheresis material
Methodology:
- Inoculation: Begin with an inoculation density of 50 × 10^6 total viable cells.
- Perfusion Parameters: Utilize a Design of Experiments (DOE) approach to test different combinations of:
- Perfusion Initiation Time: 48, 72, and 96 hours post-inoculation.
- Perfusion Rate: 0.25, 0.5, and 1.0 Vessel Volumes per Day (VVD).
- Process Monitoring: Culture for 7 days, monitoring cell concentration, viability, and filter transmembrane pressure.
- Assessment: Evaluate final cell yields, fold expansion, time to target dose, and critical quality attributes (phenotype, cytotoxicity).
Diagram: Experimental Workflow for Perfusion Process Optimization
Quantitative Results from Perfusion Optimization
Table 1: Performance Comparison of CAR-T Expansion Processes [39]
| Ambr 250 Process | Perfusion Initiation | Perfusion Rate (VVD) | Time to First Dose* | Total Doses in 7 Days | Final Cell Yield (10^9) |
|---|---|---|---|---|---|
| Fed-Batch | Not Applicable | Not Applicable | 7 days | 1 | ~1.0 |
| Perfusion | 48 hours | 1.0 | 3 - 3.5 days | 4.5 | 4.5 |
| Perfusion | 72 hours | 0.25 | >7 days | <1 | 0.7 |
*A representative clinical dose of 200 million CAR+ cells.
Troubleshooting Guides & FAQs
Frequently Asked Questions
Q1: What are the primary benefits of switching from fed-batch to perfusion for cell expansion? Perfusion culture offers several critical advantages over traditional fed-batch:
- Reduced Expansion Time: Can cut time to target dose by over 50% (from 7 days to 3-3.5 days) [39].
- Increased Cell Yields: Achieves up to 4.5-fold higher final cell yields [39].
- Improved Process Control: Maintains a stable environment by continuously replenishing nutrients and removing waste products [40].
- Addresses Patient Variability: Adaptive perfusion strategies can be tailored to accommodate donor-to-donor variability in cell growth [39].
Q2: Why is there a strong drive to eliminate serum from cell culture media? The use of serum (e.g., Fetal Bovine Serum) presents significant challenges:
- Process Variability: Lot-to-lot composition differences exacerbate an already variable manufacturing process [39].
- Safety Concerns: Potential presence of animal or human viruses requires extensive safety testing [39].
- Supply Limitations: Global serum production may be nearing its peak, raising concerns about future availability and cost [39].
- Regulatory Pressure: Authorities support transitioning to xeno-free/serum-free formulations for improved consistency and safety [39].
Q3: How can I implement a perfusion process in my lab? Successful implementation requires:
- Specialized Equipment: Bioreactor systems with integrated perfusion capabilities and cell retention devices (e.g., alternating tangential flow filters) [39] [40].
- Systematic Optimization: Use Design of Experiments (DOE) to identify optimal perfusion parameters (start time, rate) for your specific cell type and media [39].
- Process Monitoring: Implement real-time monitoring of critical parameters like cell density, viability, and filter pressure [39].
Common Experimental Challenges & Solutions
Table 2: Troubleshooting Guide for Process Intensification
| Problem | Potential Cause | Solution |
|---|---|---|
| Low final cell yield | Suboptimal perfusion start time or rate; donor variability | Use DOE to optimize parameters; consider adaptive perfusion strategies tailored to donor material quality [39]. |
| Poor cell viability | Shear stress from perfusion; nutrient deficiency; toxic metabolite accumulation | Ensure bioreactor has low-shear design; confirm perfusion rate is sufficient for nutrient delivery/waste removal [40]. |
| Filter clogging/fouling | Cell aggregation; excessive cell densities | Monitor transmembrane pressure; optimize anti-clogging strategies; consider alternative cell retention devices [39]. |
| High media consumption/cost | Fixed, high perfusion rates regardless of cell needs | Implement adaptive perfusion feeding, reducing medium requirements by ~11% without compromising yield [39]. |
| Inconsistent product quality | Variable culture conditions; serum-containing media | Transition to XF/SF media; use perfusion to maintain consistent environment; monitor critical quality attributes [39]. |
The Scientist's Toolkit: Essential Research Reagents & Materials
Table 3: Key Research Reagent Solutions for Process Intensification
| Item | Function & Application | Example Products/Notes |
|---|---|---|
| Xeno-Free/Serum-Free Medium | Provides defined, consistent nutrients for cell growth without animal-derived components, reducing variability. | 4Cell Nutri-T GMP [39]; formulations should support high cell densities and maintain phenotype. |
| Perfusion Bioreactor System | Enables continuous medium exchange for intensified cell expansion in a controlled environment. | Ambr 250 High-Throughput Perfusion [39]; ReadyToProcess WAVE 25 with integrated perfusion filter [40]. |
| Cell Retention Device | Retains cells within the bioreactor while allowing spent media removal, essential for perfusion. | Alternating Tangential Flow (ATF) filter systems [39]. |
| Cell Line Development Tools | Genetically modifies producer cell lines to increase productivity per cell. | CRISPR gene editing technology [41]. |
| Advanced Analytics | Monitors critical quality attributes (phenotype, potency) to ensure process consistency and product quality. | Tools for measuring naïve/central memory markers, exhaustion markers, cytotoxicity [39]. |
Frequently Asked Questions (FAQs)
Q1: What is the fundamental difference between centralized and decentralized manufacturing for autologous cell therapies? In the centralized model, a patient's cells are collected and then shipped to a single, large-scale manufacturing facility often located far from the treatment center. The final product is shipped back, a process that can take weeks and involves complex, costly logistics [42] [43]. The decentralized model, which includes Point-of-Care (PoC) manufacturing, moves production closer to the patient, typically to a regional facility or within the hospital itself. This significantly reduces "vein-to-vein" time and simplifies the supply chain [44] [45] [46].
Q2: What are the most significant challenges when implementing a PoC manufacturing system? The primary challenges involve maintaining consistent quality and regulatory compliance across multiple manufacturing sites. This requires a robust Quality Management System (QMS) and technologies that minimize process variability [45]. Other key challenges include high initial investment in specialized equipment, training a large number of operators, and establishing a viable regulatory strategy for multi-site production [44] [47] [48].
Q3: Which technologies are critical for enabling successful decentralized manufacturing?
Closed, automated, and modular systems are the cornerstone of decentralized manufacturing. Platforms like the CliniMACS Prodigy (Miltenyi Biotec) and Cocoon (Lonza) integrate multiple steps into a single, closed system, reducing manual handling and the risk of contamination [42] [47] [43]. These systems are designed to be operated in environments with less stringent air classifications, making them suitable for hospital settings [47].
Q4: How can a Control Site model streamline regulatory oversight for multiple PoC facilities? A Control Site acts as the central regulatory nexus, holding the manufacturing license and maintaining the master files for all decentralized sites under its network [45]. This model provides a single point of contact for regulatory agencies, ensures centralized quality assurance, and oversees the qualification of personnel and consistency of processes across all locations, thereby simplifying the regulatory burden for individual PoC sites [45].
Q5: What are the key cost drivers that PoC manufacturing aims to reduce? PoC manufacturing primarily targets the reduction of cold chain logistics and shipping costs, which are substantial in the centralized model [43]. It also seeks to lower costs associated with product loss or damage during transit and reduce the high capital investment of large-scale centralized facilities by using smaller, scalable platforms [46] [43]. By shortening the manufacturing timeline, it can also potentially reduce hospital stays and improve patient outcomes, contributing to overall cost-effectiveness [42].
Troubleshooting Guides
Issue 1: High Process Variability Between Batches
Problem: Inconsistent final product quality and characteristics when the same process is run at different PoC locations or by different operators.
Possible Causes & Solutions:
- Cause: Variable quality of patient-derived starting material due to differences in patient health status [43].
- Solution: Implement stringent pre-screening of patients and standardize leukapheresis procedures. Use automated systems that can handle a wider range of input material qualities [43].
- Cause: Manual processing steps and excessive human intervention introduce operator-dependent variability [47] [43].
- Cause: Lack of standardized reagent qualification and process protocols across sites.
Issue 2: Managing Regulatory Compliance Across Multiple Sites
Problem: Ensuring and demonstrating consistent GMP compliance and product comparability for the same therapy manufactured at different PoC locations.
Possible Causes & Solutions:
- Cause: Inconsistent interpretation and implementation of GMP standards at local sites.
- Solution: Implement a centralized QMS overseen by the Control Site. This site holds the "specified license" and maintains the
POCare Master File, ensuring all decentralized units operate under a single, approved set of standards [45].
- Solution: Implement a centralized QMS overseen by the Control Site. This site holds the "specified license" and maintains the
- Cause: Difficulty in demonstrating product comparability to regulators.
- Cause: Complex logistics for batch record review and product release at each local site.
- Solution: Leverage digital automation and centralized data management. The Control Site's Qualified Person (QP) can use real-time data from all units to perform centralized batch review and release, streamlining the process [45].
Issue 3: High Per-Batch Manufacturing Costs
Problem: The cost of goods sold (COGS) remains high, undermining the economic benefits of decentralization.
Possible Causes & Solutions:
- Cause: Low production throughput per instrument and high cost of single-use consumables and reagents [29] [43].
- Solution: Utilize systems that shorten the manufacturing cycle. For example, a 24-hour CAR-T process reduces reagent use and facility turnover time [42]. Consolidate purchasing of consumables across the network to leverage volume discounts.
- Cause: Significant costs associated with maintaining a GMP-grade environment at each PoC location.
- Cause: Labor-intensive processes and the need for highly trained staff at each site.
Experimental Protocols & Data
Protocol: Automated 24-Hour CAR-T Cell Manufacturing Workflow
This shortened protocol, as demonstrated by Thermo Fisher Scientific, reduces ex vivo expansion time and aims to produce less differentiated, more potent T-cells [42].
Detailed Methodology:
- One-Step Isolation & Activation: Isolate T-cells from a leukapak using
CTS Detachable Dynabeads CD3/CD28on theCTS DynaCellect Magnetic Separation System. This step simultaneously isolates and activates the T-cell population in a closed system [42]. - Lentiviral Transduction: Immediately transduce the activated T-cells with a lentiviral vector containing the CAR construct at a low Multiplicity of Infection (MOI). This step is performed shortly after isolation [42].
- Active-Release Debeading: Use
CTS Detachable Dynabeads Release Bufferon theDynaCellectsystem to actively remove the magnetic beads. This prevents overactivation and exhaustion associated with traditional passive release methods [42]. - Wash & Concentration: Wash and concentrate the cells using the
CTS Rotea Counterflow Centrifugation System, which provides a low-shear environment to maintain high cell viability and recovery [42]. - Final Formulation: The product is now ready for infusion or cryopreservation. In the referenced study, cells were either cryopreserved using a controlled-rate freezer or expanded for 7 days for comparative analysis [42].
Key Outcome: This 24-hour process yielded CAR-T cells with a higher proportion of naive memory/T stem cell memory (TSCM) phenotype (CD45RA+/CCR7+), which is associated with improved anti-tumor activity in preclinical models, compared to cells from a 7-day process that exhibited a more differentiated phenotype [42].
Quantitative Data on Market and Cost Drivers
Table 1: Autologous Cell Therapy Market Overview and Growth Drivers [29]
| Metric | Value | Context / Impact |
|---|---|---|
| Market Size (2024) | USD 9.6 billion | Baseline for the autologous cell therapy sector. |
| Projected Market Size (2034) | USD 54.21 billion | Reflects a high Compound Annual Growth Rate (CAGR). |
| CAGR (2025-2034) | 18.9% | Indicates rapid market expansion and growing adoption. |
| Leading Therapy Type (2024) | CAR-T Cell Therapy (32% share) | Dominates the current autologous therapy landscape. |
| High Treatment Cost | $300,000 - $500,000 per patient | A major barrier to access, driven by complex, labor-intensive manufacturing and expensive materials [29]. |
The Scientist's Toolkit
Table 2: Key Research Reagent Solutions for Decentralized Manufacturing
| Item | Function | Example Product(s) |
|---|---|---|
| Closed, Automated Cell Processing System | Integrates T-cell isolation, activation, transduction, and expansion in a single, closed disposable kit to minimize manual steps and contamination risk. | CliniMACS Prodigy (Miltenyi Biotec), Cocoon Platform (Lonza) [47] [43] |
| Active-Release Magnetic Beads | For T-cell activation and expansion; allows for precise, on-demand detachment to prevent T-cell exhaustion. | CTS Detachable Dynabeads CD3/CD28 [42] |
| Lentiviral Vector System | For efficient genetic modification of T-cells to express the Chimeric Antigen Receptor (CAR). | LV-MAX Lentiviral Production System [42] |
| Counterflow Centrifugation System | Provides gentle washing and concentration of cells in a closed system, ensuring high viability and recovery. | CTS Rotea System [42] |
| Digital Integration & Automation Software | Enables digital control and monitoring of the manufacturing process, ensuring protocol standardization and data integrity. | CTS Cellmation Software [42] |
Workflow Diagrams
Traditional vs. Decentralized CAR-T Manufacturing Workflow
Point-of-Care Quality Management Control Site Model
Frequently Asked Questions (FAQs) and Troubleshooting
FAQ 1: What are the most critical quality attributes (CQAs) to monitor in real-time for autologous cell cultures, and which AI tools are best suited for this?
Answer: For autologous cell therapies, the most critical CQAs are cell morphology, viability, proliferation rate, and differentiation potential [49]. Traditional methods for monitoring these, like manual microscopy and flow cytometry, are labor-intensive and only provide static snapshots [49].
Recommended AI Tools and Troubleshooting:
| AI Technology | Application to CQA | Common Implementation Challenge | Solution |
|---|---|---|---|
| Convolutional Neural Networks (CNNs) [49] | Non-invasive, real-time tracking of cell morphology and colony formation. | Achieving high accuracy with diverse patient-specific cell starting materials. | Use Generative Adversarial Networks (GANs) to generate synthetic data for model training, improving robustness to variability [49]. |
| Predictive Modeling [49] | Forecasting culture trajectories (e.g., predicting oxygen dips hours in advance). | Model inaccuracy due to sensor noise or insufficient historical data. | Integrate high-frequency data from multiple sensor types (e.g., dissolved oxygen, lactate) and continuously update models with new process runs [49]. |
| Support Vector Machines (SVMs) [49] | Classifying differentiation stages (e.g., distinguishing lineage commitment). | Model misclassification at critical decision points. | Train classifiers on multi-modal data streams, combining brightfield imaging with feature analysis for over 90% sensitivity [49]. |
FAQ 2: How can we implement a closed-loop control system to automatically adjust bioreactor parameters, and what are the common failure points?
Answer: A closed-loop control system uses real-time sensor data, processed by an AI model, to dynamically adjust Critical Process Parameters (CPPs) like pH, oxygen, and nutrient levels without human intervention [49] [50]. For example, reinforcement learning (RL) algorithms have been shown to improve culture expansion efficiency by 15% by dynamically adjusting gas composition [49].
Troubleshooting Common Failure Points:
- Challenge: Sensor Drift or Calibration Issues.
- Symptom: The AI model makes incorrect adjustments based on faulty data, leading to process deviation.
- Solution: Implement a scheduled calibration protocol for all inline sensors (e.g., Raman sensors, pH probes). Use statistical process control (SPC) to monitor sensor output for unexpected variance [50].
- Challenge: Inadequate Model Training for Patient Variability.
- Symptom: The control system performs well for some patient samples but fails with others, compromising batch consistency.
- Solution: Employ hybrid modeling, which merges mechanistic process understanding with data-driven AI. This approach makes the system more adaptable to the inherent variability of autologous starting materials [51]. Models should be trained on a wide dataset encompassing expected biological variability.
- Challenge: Integration Latency.
- Symptom: There is a significant delay between data acquisition and process adjustment, reducing control effectiveness.
- Solution: Ensure seamless integration between Process Analytical Technology (PAT) hardware, the AI decision layer, and the bioreactor control unit. A well-designed platform should enable real-time feedback within a defined control loop timeframe [50].
FAQ 3: Our facility struggles with the high cost of manual quality control. Which automated, AI-driven analytics can replace traditional endpoint assays to reduce costs?
Answer: Replacing destructive, endpoint assays with non-invasive, AI-powered analytics is key to reducing manual labor and costs [49]. The table below summarizes cost-effective alternatives.
| Traditional Endpoint Assay | AI-Driven Alternative | Potential Cost & Efficiency Impact |
|---|---|---|
| Manual microscopy for morphology & confluence [49] | CNN-based live-cell imaging for continuous tracking [49] | Reduces labor by up to 90% and provides richer, real-time data [52]. |
| Flow cytometry for cell population analysis [49] | Machine learning models on brightfield image data to infer phenotype and differentiation status [49] | Eliminates costly staining reagents and sample preparation time, enabling at-line decision making. |
| Karyotyping/Microarrays for genetic stability [49] | Deep learning on multi-omics data (e.g., RNA-seq, SNP profiles) to detect latent instability [49] | Moves testing from low-throughput, dedicated assays to a more predictive, high-throughput model. |
Experimental Protocols for Implementation
Protocol 1: Setting Up an AI-Driven Real-Time Monitoring System for Cell Morphology and Viability
Objective: To implement a non-invasive, real-time system for tracking critical cellular attributes using AI-based image analysis, reducing reliance on manual sampling and destructive assays.
Materials:
- Equipment: Inverted microscope with automated stage and high-resolution camera, environmental control chamber (for live-cell imaging), high-performance computing (HPC) workstation with GPU.
- Software: Image analysis software (e.g., Python with OpenCV, TensorFlow, or PyTorch frameworks).
- Consumables: Cell culture vessels compatible with imaging.
Methodology:
- Image Acquisition: Set up the microscope within a controlled incubator to acquire time-lapse images of cell cultures at regular intervals (e.g., every 30 minutes). Ensure consistent lighting and focus.
- Data Labeling & Model Training:
- Manually label a initial set of images for key features: viable cell morphology, non-viable cell morphology, and confluence.
- Train a Convolutional Neural Network (CNN) architecture (e.g., U-Net, ResNet) on this labeled dataset. Use data augmentation techniques to enhance model generalizability.
- Validate the model's accuracy against held-out test images and traditional viability counts (e.g., from trypan blue exclusion).
- Deployment & Real-Time Analysis:
- Integrate the trained model into the live imaging pipeline.
- Configure the system to analyze each new image upon acquisition, outputting metrics for cell count, confluence, and a viability probability score.
- Data Integration & Alerting:
- Feed these real-time metrics into a central process monitoring dashboard.
- Set automated alerts to trigger if the AI model detects a significant deviation from expected morphological trends or if viability drops below a predefined threshold.
Protocol 2: Implementing a Closed-Loop Control for Bioreactor Metabolite Management
Objective: To create an automated system that maintains optimal nutrient and metabolite levels in a bioreactor using real-time sensor data and a predictive AI model.
Materials:
- Equipment: Bioreactor system with integrated and inline sensors for metabolites (e.g., Raman spectrometer, glucose/lactate analyzer), programmable control unit, data acquisition system.
- Software: Platform for building predictive models (e.g., Python with scikit-learn, TensorFlow) and control logic.
Methodology:
- Define Critical Parameters: Identify the CPPs (e.g., glucose concentration) and the corresponding manipulated variables (e.g., feed pump rate).
- Historical Data Collection & Model Building:
- Run multiple bioreactor batches, collecting high-frequency time-series data from all sensors.
- Use this data to train a predictive model (e.g., a regression model or LSTM neural network) to forecast future metabolite levels based on current and past process states [49].
- Implement Control Logic:
- Develop a reinforcement learning (RL) algorithm that uses the predictions from your model to decide on the optimal adjustment to the feed pump rate [49]. The algorithm's goal is to keep metabolite levels within a tight target range.
- System Integration & Testing:
- Establish a secure data pipeline from the bioreactor sensors to the AI model and then to the bioreactor's control unit.
- Test the closed-loop system first in a simulated environment, then in parallel with manual control, before full implementation. Monitor performance and refine the model as needed.
Essential Research Reagent Solutions
The following reagents and materials are critical for developing and running the advanced analytics and AI-driven processes described.
| Item | Function in Advanced Analytics / AI Workflow |
|---|---|
| Defined, Serum-Free Cell Culture Media [53] | Provides a consistent and reproducible baseline, reducing process variability that can confound AI models. Essential for understanding the impact of specific process parameters. |
| Specific Cytokines & Growth Factors (e.g., IL-2, IL-7, IL-15, TGF-β) [53] | Used to direct cell activation, expansion, and differentiation. Their concentrations and combinations are key model inputs for predicting culture outcomes and optimizing processes. |
| High-Quality, GMP-Compliant Transfection Reagents/Viral Vectors [16] | For cell engineering steps (e.g., CAR insertion). Consistent quality is vital for achieving reproducible genetic modification, a critical quality attribute that AI models may monitor indirectly. |
| Inline Sensors & Probes (e.g., Raman, pH, DO) [50] | The primary source of real-time, high-frequency data on the process environment. This data is the essential fuel for all predictive models and AI-driven control systems. |
| Process Analytical Technology (PAT) Software | The digital platform that integrates sensor data, runs AI/ML models, and executes control commands. It is the "brain" of the automated bioprocessing platform [50]. |
Workflow and System Diagrams
AI-Driven Monitoring and Control Loop
Experimental Setup for Real-Time Monitoring
Implementing Practical Solutions for Manufacturing Challenges
FAQs: Core Concepts
1. What makes starting material so variable in autologous cell therapies? The variability is inherent to the patient-specific nature of autologous therapies. Key factors include:
- Patient-Specific Factors: The patient's disease severity, genetic background, age, and prior treatments (like chemotherapy or radiation) significantly impact the quality, quantity, and functionality of the collected cells [54].
- Collection Process Variability: Differences in apheresis protocols, collection devices, the training of medical staff, and the type of anticoagulants used can all contribute to differences in the starting leukapheresis material [54].
- Post-Collection Handling: The time between cell collection and manufacturing, as well as the methods used for cryopreservation, storage, and transport, introduce further variability [54].
2. What are Adaptive Process Controls? Adaptive Process Controls are strategies that use real-time data to dynamically adjust manufacturing processes. The goal is to accommodate the natural variability of incoming cellular raw materials while still consistently producing a drug product that meets all critical quality attributes (CQAs). This often involves the integration of Process Analytical Technology (PAT) to monitor the process and automated systems to execute adjustments [55] [56].
3. How can adaptive controls reduce manufacturing costs? By making manufacturing more robust, adaptive controls directly address major cost drivers:
- Reducing Process Failures: Accommodating variable starting material minimizes batch failures, which are exceptionally costly in autologous therapies [54] [1].
- Optimizing Resource Use: Real-time monitoring and control can optimize the use of expensive raw materials, such as viral vectors and growth factors, and shorten process times by ensuring optimal growth conditions [55] [8].
- Increasing Automation: Adaptive controls are often enabled by automated platforms, which can reduce the extensive labor requirements and facility space, two significant contributors to high costs [1] [31].
Troubleshooting Guides
Issue 1: Inconsistent Cell Expansion Yields
Problem: Wide patient-to-patient variation in cell growth kinetics and final expansion yield.
| Potential Cause | Diagnostic Checks | Corrective Actions |
|---|---|---|
| Variable Pre-Apheresis Cell Health | Review patient eligibility and pre-apheresis cell counts (e.g., CD3+). Analyze cell viability and functionality upon receipt. | Implement stricter patient cell eligibility criteria for manufacturing. Introduce a pre-stimulation or "resting" phase in culture to normalize cell starting state [54]. |
| Suboptimal Culture Environment | Use in-line sensors to monitor metabolic waste (lactate) and nutrient (glucose) levels throughout the expansion. | Implement a controlled, perfusion-enabled bioreactor system that allows for automated nutrient feeding and waste removal based on real-time metabolite readings [55] [31]. |
| Inherent Donor Variability | Employ multivariate data analysis to correlate donor characteristics with process outcomes. | Develop flexible expansion protocols with adjustable durations and feeding schedules, guided by real-time monitoring of cell concentration and metabolic rates [56] [1]. |
Issue 2: Unpredictable Product Quality
Problem: Final drug product fails to meet Critical Quality Attributes (CQAs) like potency or purity for certain patients.
| Potential Cause | Diagnostic Checks | Corrective Actions |
|---|---|---|
| Unknown Impact of Process Parameters | Conduct Design of Experiments (DoE) studies to understand the relationship between CPPs and CQAs. | Adopt a Quality by Design (QbD) approach. Use the knowledge from DoE to define a proven acceptable range for CPPs and implement PAT for control within this range [55] [56]. |
| Lack of In-Process Quality Data | Incorporate at-line assays for key phenotypic markers (e.g., via flow cytometry) or potency assays at critical process steps. | Develop a multiparametric cell characterization panel. Use this refined panel of markers for in-process monitoring to make real-time go/no-go decisions and guide process adjustments [56]. |
| High Variability in Genetic Modification | Monitor transfection/transduction efficiency in-process. | Utilize automated, closed electroporation systems with customizable parameters to ensure consistent and high-efficiency genetic modification across all batches [31]. |
Experimental Protocols for Implementing Adaptive Controls
Protocol 1: Developing a Multiparametric Process Control Strategy
This methodology bridges the gap between discrete product characterization and continuous process data.
1. Hypothesis: A defined panel of process and product markers can predict final product quality, enabling proactive process control.
2. Experimental Workflow:
The following diagram illustrates the multi-stage experimental workflow for developing this strategy.
3. Key Materials:
- Cells: Patient-derived starting material from multiple donors.
- Analytical Instruments: Flow cytometer, RT-qPCR system, metabolic analyzers, potentially Raman spectrometer.
- Software: Statistical software capable of Multivariate Data Analysis (MVDA) and co-expression network analysis.
4. Procedure:
- Stage 1: Screen a wide panel of protein and molecular markers (e.g., for phenotype, stress, metabolism) against cell products made under ideal ("reference") and deliberately suboptimal ("stressed") conditions. Use differential analysis to identify a smaller, relevant panel of markers [56].
- Stage 2: Run multiple manufacturing processes using a Design of Experiments (DoE) approach that varies Critical Process Parameters (CPPs). Collect data on the refined marker panel alongside PAT data (e.g., metabolite levels, viable cell density) throughout the runs [56].
- Stage 3: Perform Multivariate Data Analysis (MVDA) on the combined dataset. Techniques like co-expression network analysis create a Topological Overlap Matrix (TOM) to quantify marker connectivity. The least-connected markers are filtered out, leaving a refined, high-value panel predictive of product quality [56].
Protocol 2: Implementing a Closed-Loop Control for Bioreactor Expansion
This protocol outlines the steps for creating an automated feedback system to maintain optimal cell culture conditions.
1. Hypothesis: Real-time, automated control of nutrients and waste products will improve expansion yield and consistency despite variable starting cells.
2. Experimental Workflow:
The diagram below shows the continuous feedback loop of a closed-loop control system.
3. Key Materials:
- Equipment: Bioreactor with integrated probes for pH, dissolved oxygen (DO), and optionally other parameters; sterile liquid addition system (pumps); in-line or at-line analyte monitor (e.g., for glucose/lactate).
- Software: A process control software that can host the predictive model and execute the control logic.
4. Procedure:
- Identify Critical Variable: Select a parameter to control, such as glucose concentration.
- Define Set-Point: Determine the optimal target range for the variable (e.g., maintain glucose between 2-4 g/L).
- Integrate PAT: Use an in-line or at-line technology (e.g., Raman spectroscopy or a photometric analyzer) to provide frequent, timely measurements of the glucose concentration in the culture [55] [56].
- Implement Control Logic: Program the process controller to compare the measured glucose value to the set-point. If the measurement is low, the controller sends a signal to a pump to add a bolus of concentrated nutrient feed. This creates a continuous feedback loop that maintains homeostasis [55].
The Scientist's Toolkit: Research Reagent Solutions
| Item | Function & Rationale |
|---|---|
| PAT Tools | |
| Raman Spectroscopy | Non-invasive, in-line monitoring of multiple culture components (glucose, glutamine, lactate, ammonia) and cell density [56]. |
| In-line Fluorescent Sensors | Real-time, continuous monitoring of critical culture parameters like pH and dissolved oxygen (DO) [56]. |
| At-line Mass Spectrometry | Provides detailed, near real-time quantification of media components like amino acids and metabolites for advanced process control [56]. |
| Culture Systems | |
| Automated Bioreactor Systems | Integrated systems (e.g., stirred-tank) with closed-loop control of T, DO, pH, and perfusion for consistent, scalable expansion [31]. |
| Characterization Reagents | |
| Multiparametric Flow Cytometry Panels | Pre-configured antibody panels for at-line monitoring of cell phenotype, activation, and exhaustion markers during manufacturing [56]. |
| Process Materials | |
| Pre-qualified, GMP-Grade Reagents | Using raw materials (cytokines, media) with tight quality control specifications helps minimize lot-to-lot variability introduced by the supply chain [54]. |
In the development of autologous cell therapies, effective raw material management is not merely a logistical concern but a critical strategic component for reducing manufacturing costs and ensuring supply chain resilience. Raw materials directly impact the safety, efficacy, and quality of final cell therapy products, as there are typically no true purification steps, limited clearance/wash steps, and no terminal sterile filtration to remove impurities or contaminants introduced via materials [57]. The financial implications are significant, with companies potentially incurring $3 million to $5 million in unplanned costs to establish robust supplier management processes and analytical capabilities when these elements are not prioritized early in development [57]. For autologous therapies where each patient batch is unique and valuable, material failures or shortages can result in catastrophic product losses and patient treatment delays.
A 2023 analysis of cell and gene therapy programs reveals that >95% of critical raw materials and quality testing materials are sole- or single-sourced within any given program [57]. This creates substantial vulnerability in the supply chain, as qualifying an alternative material during a disruption typically requires over six months and may necessitate expensive comparability studies or even repeated clinical work [57]. Implementing a structured approach to dual sourcing and vendor qualification directly addresses this vulnerability, contributing significantly to the broader thesis of reducing manufacturing costs while maintaining product quality and supply reliability.
Dual Sourcing Strategies for Supply Continuity
Understanding Sourcing Classifications
Dual sourcing involves strategically engaging multiple suppliers for critical materials to mitigate supply chain risks. Understanding the fundamental classifications of sourcing arrangements is essential for implementing effective strategies:
- Sole-Sourced: Only one supplier option exists globally for a particular material due to proprietary technology, patents, or unique manufacturing capabilities [57].
- Single-Sourced: Only one supplier option is currently in use or qualified, though alternatives may exist in the market [57].
- Dual/Multi-Sourced: Multiple suppliers are qualified and actively used for the same material, providing immediate alternatives during supply disruptions.
Implementing a Dual Sourcing Framework
A proactive dual sourcing strategy requires systematic planning and execution. The following table outlines key strategic considerations and implementation approaches:
| Strategic Consideration | Implementation Approach | Risk Mitigation Benefit |
|---|---|---|
| Supplier Capacity Assessment | Evaluate suppliers' ongoing capacity and demand projections; require transparency on production capabilities and expansion plans [57]. | Prevents bottlenecks during manufacturing scale-up; identifies capacity constraints early. |
| Raw Material Qualification | Conduct rigorous comparability studies between primary and secondary sources; maintain inventory of both materials during qualification [57]. | Reduces transition time during supply disruptions; provides scientific evidence for material equivalence. |
| Geographic Diversity | Source similar materials from suppliers with manufacturing facilities in different geographic regions [58]. | Mitigates region-specific disruptions (natural disasters, political instability, transportation issues). |
| Business Continuity Planning | Require suppliers to disclose their disaster recovery plans and dual-sourcing strategies for their own raw materials [58]. | Creates a more resilient multi-tier supply chain; addresses vulnerabilities upstream. |
When engaging suppliers about their dual-sourcing capabilities, specific questions are essential for thorough evaluation. Key inquiries include: "Does the supplier have a dual-sourcing strategy for critical raw materials?" and "How does the supplier qualify its own suppliers and how frequently does it evaluate and audit its own supply chain?" [58]. The responses to these questions provide crucial insights into the supplier's understanding of supply chain risk and their commitment to mitigation.
The following workflow diagram illustrates the strategic decision process for implementing dual sourcing:
Vendor Qualification Methodologies
The Comprehensive Vendor Qualification Framework
Vendor qualification extends far beyond initial material testing to encompass a holistic assessment of supplier capabilities, quality systems, and long-term reliability. The "10 Cs of supplier evaluation and selection" framework provides a comprehensive structure for this assessment [58]. If a potential supplier fails to meet a customer's requirements on more than 30% of the critical attributes in this framework, serious consideration should be given to whether that supplier is suitable for a long-term partnership [58].
The following table details the evaluation criteria and methodologies for each component of the vendor qualification framework:
| Evaluation Criteria | Assessment Methodology | Documentation Requirements |
|---|---|---|
| Competency [58] | Technical assessment of supplier's knowledge and expertise in producing the specific material type. | Review supplier's technical publications, patents, and white papers; interview technical staff. |
| Capacity [58] | Evaluation of production capabilities, facility size, and equipment to meet current and projected demand. | On-site facility audit; review production records and capacity planning documents. |
| Commitment [58] | Assessment of supplier's dedication to quality, customer service, and continuous improvement. | Review quality metrics, customer service response times, and continuous improvement programs. |
| Control [58] | Verification of quality management systems, process validation, and change control procedures. | Audit QMS certification (ISO 9001); review validation protocols and change control records. |
| Cash [58] | Financial stability assessment to evaluate risk of business discontinuity. | Review financial statements, credit ratings, and annual reports. |
| Cost [58] | Total cost of ownership analysis beyond purchase price. | Document cost analysis including shipping, qualification, and inventory carrying costs. |
| Consistency [58] | Evaluation of product quality consistency across multiple batches. | Statistical analysis of Certificate of Analysis data across multiple lots. |
| Culture [58] | Alignment of quality culture, ethics, and business practices. | Employee interviews; review mission statements and corporate social responsibility reports. |
| Clean [58] | Assessment of ethical business practices and regulatory compliance history. | Check for FDA warning letters, regulatory actions, or legal proceedings. |
| Communication [58] | Effectiveness of communication protocols, responsiveness, and technical support. | Evaluate response times to inquiries; assess clarity and completeness of technical documentation. |
Risk-Based Material Qualification
A risk-based approach to material qualification is essential, particularly given the unique manufacturing constraints of cell therapies. According to regulatory guidance, risk assessments must consider multiple factors, including the production steps applied to the raw material, the ability of the drug product manufacturing process to control or remove it from the final medicinal product, and for biologically sourced materials, the traceability to the master cell bank/virus seed and risks related to sourcing [57].
The United States Pharmacopeia (USP) <1043> provides a framework for classifying raw materials into four different tiers based on risk [59]. This classification determines the appropriate qualification activities, with higher-risk materials requiring more extensive testing and documentation. For all raw materials of human or animal origin, a viral risk assessment must be performed according to regulatory requirements, and a TSE (Transmissible Spongiform Encephalopathy) risk assessment is also required for such materials [57].
Particulate contamination represents a special concern for cell therapy manufacturing. As the majority of cell therapy products are administered intravenously, they must comply with particulate matter requirements [57]. However, testing of final cell therapy drug products for particulates has strong limitations given the presence of cells and cell debris [57]. Thus, material risk assessments need to account for this aspect, and testing of certain materials may be required to ensure appropriate quality.
Change Control and Ongoing Supplier Management
Effective vendor qualification extends beyond initial selection to include robust change control processes and ongoing supplier management. The "11th C" for biomanufacturing – change control – requires understanding both a supplier's ability to manage changes and their procedures to mitigate risk associated with customer changes [58]. Critical questions to review with suppliers include: "What is your change notification policy in terms of time?" "What is your right-to-final-buy policy?" and "What is your change management process?" [58].
Ongoing supplier management should include regular business review meetings with key suppliers [57]. These reviews provide opportunities to assess performance against established metrics, discuss potential issues, and align on future requirements. Best practices include establishing a defined communications lead and issue escalation pathway to ensure your organization speaks with one voice when communicating with key suppliers [57]. This approach prevents a siloed engagement strategy and ensures suppliers clearly understand your key priorities.
Troubleshooting Guide: Frequently Asked Questions
Q: What specific steps should we take when our sole-source supplier announces a discontinuation of a critical raw material?
A: Immediately execute your contingency plan: (1) Secure as much of the final lots as possible under "right-to-final-buy" clauses [58]; (2) Engage your cross-functional raw materials team to prioritize alternative identification; (3) Issue a formal supplier assessment questionnaire to potential alternative suppliers focusing on their technical capabilities, capacity, and quality systems [58]; (4) Initiate accelerated comparability testing using a risk-based approach focused on critical quality attributes; (5) Document all activities thoroughly to support regulatory submissions. The entire process typically requires at least six months, so proactive monitoring of supplier communications is critical [57].
Q: How can we effectively assess particulate contamination risk from raw materials when our final cell therapy product cannot be tested for particulates due to cellular interference?
A: Implement a multi-layered testing strategy: (1) Require suppliers of high-risk materials (especially those used in final formulation steps) to provide extensive particulate testing data as part of their Certificate of Analysis [57]; (2) Perform incoming material testing for subvisible particulate matter on a statistical sampling basis according to USP <788> [57]; (3) Conduct extractables and leachables (E&L) assessment on single-use systems and materials that contact the product [57]; (4) Implement enhanced visual inspection procedures for all materials used in final formulation and filling steps.
Q: What is the most effective way to structure our internal team to manage raw materials and supplier relationships?
A: Form a cross-functional raw materials team with representatives from research, process development, quality, supply chain, and regulatory affairs [57]. This team should establish a governance process with key objectives of prioritizing materials and suppliers based on technical risk and supply continuity risk factors [57]. The team should be empowered to make strategic decisions and maintain direct communication channels with senior leadership for escalation of issues with strategic suppliers. Documented procedures should define supplier communication protocols, with a designated lead for each key supplier relationship to prevent mixed messages [57].
Q: How should our qualification approach evolve as we transition from early-phase clinical trials to commercial readiness?
A: Implement a phase-appropriate qualification strategy: During early development, focus on safety and basic functionality using research-grade materials when necessary [57]. As you approach pivotal trials, material risk assessments and qualification activities "should be completely developed" per USP guidelines [35]. For commercial readiness, all critical materials should be qualified under cGMP conditions with comprehensive understanding of critical quality attributes, robust supplier qualification programs, and rigorous incoming material testing protocols [57]. Begin planning for this transition at least two years before anticipated market filing to allow for thorough execution [57].
The Scientist's Toolkit: Essential Research Reagent Solutions
| Material Category | Specific Examples | Critical Function | Key Qualification Considerations |
|---|---|---|---|
| Cell Culture Media [57] | Serum-free media, supplements, growth factors | Provides nutrients and signaling molecules for cell growth and expansion | Composition consistency, endotoxin levels, functional performance testing [57] |
| Genetic Modification Tools [8] | Viral vectors (lentivirus, retrovirus), mRNA, CRISPR-Cas9 systems | Introduces therapeutic genes (e.g., CAR constructs) into patient cells | Potency, identity, purity, sterility, copy number determination (for viral vectors) [8] |
| Cell Separation Reagents [57] | Antibodies, magnetic beads, selection columns | Isulates and purifies target cell populations from heterogeneous mixtures | Specificity, efficiency, viability impact, functional validation [57] |
| Cryopreservation Media [57] | DMSO-containing solutions, cryoprotectants | Preserves cell viability and function during frozen storage | Composition, sterility, post-thaw viability and recovery rates, functionality [57] |
| Single-Use Systems [58] | Bioreactors, tubing sets, connection devices | Provides closed system for aseptic processing | Extractables & leachables profile, sterility, integrity testing, particulate matter [57] [58] |
Visualizing the Supplier Evaluation Workflow
The following diagram illustrates the comprehensive vendor evaluation and qualification workflow, integrating both initial assessment and ongoing management activities:
Technical Support Center
Troubleshooting Common Challenges
This section addresses frequent issues encountered when developing flexible yet GMP-compliant processes for autologous cell therapies.
Challenge 1: High Variable Costs in Patient-Specific Batches
- Problem: Manufacturing costs remain high due to personalized, small-batch production, limiting patient access [15] [5].
- Solution: Implement automated, closed systems and standardized protocols to reduce manual labor and improve efficiency [16] [11].
- Protocol: Evaluate automated systems like the Gibco CTS Rotea Counterflow Centrifugation System for cell washing and concentration. These GMP-compliant, closed systems minimize manual handling, reduce contamination risk, and improve process consistency [16].
Challenge 2: Inconsistent Product Quality and Scalability
- Problem: Manual, open processes lead to operator-dependent variability, making scale-out difficult [15] [16].
- Solution: Adopt modular, automated platforms that enable scale-out production while maintaining GMP standards [60] [16].
- Protocol: Integrate unit operation instruments (e.g., separation, electroporation) into a closed, automated workflow. Use CTS Cellmation software for digital integration and process control. This ensures each batch meets predefined quality specifications with minimal deviation [16].
Challenge 3: Complex Supply Chain and Logistics
- Problem: Patient-specific cell therapies require intricate logistics and real-time tracking of materials across multiple sites [15].
- Solution: Utilize advanced supply chain management systems for end-to-end visibility and coordination from cell collection to final infusion [15].
- Protocol: Deploy digital platforms that track chain of identity and chain of custody. Implement standardized cryopreservation and transport protocols to maintain cell viability during transportation from clinical site to manufacturing facility and back [15].
Frequently Asked Questions (FAQs)
Q1: Can we standardize processes for autologous therapies, which are inherently personalized?
- Answer: Yes. While the source material is patient-specific, key process steps like cell isolation, activation, and expansion can be standardized using validated, platform workflows. This involves using consistent equipment, raw materials, and analytical methods across different production batches to enhance efficiency and control without compromising personalization [15] [16].
Q2: How can we introduce process flexibility without violating GMP principles?
- Answer: GMP requires controlled, validated processes but doesn't mandate rigidity. Flexibility can be achieved through:
- Modular Design: Implement plug-and-play equipment that allows reconfiguration for different processes while maintaining a controlled environment [16].
- Risk-Based Validation: Focus validation efforts on critical process parameters. Use data from automated systems to demonstrate control, allowing operational adjustments within validated boundaries [16] [61].
- Digital Integration: Utilize manufacturing execution systems (MES) and electronic batch records to manage and document process changes effectively, ensuring 21 CFR Part 11 compliance [16].
Q3: What are the most effective strategies to reduce manufacturing costs?
- Answer: A multi-pronged approach is most effective, as summarized in the table below [5].
| Strategy | Description | Potential Impact |
|---|---|---|
| Automation & Closed Systems | Reduces manual labor, errors, and cleanroom requirements [16] [11]. | Lower labor costs; improved consistency; reduced contamination risk [16]. |
| Non-Viral Gene Editing | Uses transposon systems (e.g., Sleeping Beauty) or CRISPR instead of costly viral vectors [5]. | Significant cost reduction vs. viral vectors; simplified manufacturing [5]. |
| Point-of-Care Manufacturing | Decentralized production near the patient clinic [5]. | Eliminates complex transport logistics; shorter vein-to-vein time [5]. |
| Process Intensification | Shortens cell expansion time in bioreactors [5]. | Faster production; reduced resource use per batch [5]. |
Q4: How do we justify a new automated system to regulators?
- Answer: Demonstrate thorough equipment qualification (IQ/OQ/PQ), validate that critical process parameters are consistently met, and show that the closed system reduces contamination risk compared to manual, open processes. Maintain comprehensive documentation and data integrity through integrated software [16] [61].
Experimental Protocols for Cost-Reduction Strategies
Protocol 1: Evaluating Automated, Closed Systems for Cell Processing
- Objective: Compare cell recovery, viability, and labor time between manual and automated processes.
- Materials: Gibco CTS Dynacellect Magnetic Separation System or similar, leukapheresis sample, GMP-grade reagents [16].
- Method:
- Split a leukapheresis sample into two equal parts.
- Process one part manually using standard centrifugation and separation techniques in a biosafety cabinet.
- Process the other part using the automated, closed system according to the manufacturer's instructions.
- Measure and compare cell recovery rates and viabilities for both methods.
- Record the hands-on labor time for each process.
- Outcome Assessment: Automated systems should show comparable or superior cell recovery and viability with a significant reduction in active labor time, thereby lowering costs [16] [11].
Protocol 2: Implementing a Platform Analytical Workflow
- Objective: Establish standardized, quality-control testing for multiple autologous therapy candidates.
- Materials: Validated analytical methods (e.g., flow cytometry for cell phenotype, PCR for vector copy number, potency assays).
- Method:
- Define critical quality attributes (CQAs) for the therapeutic product.
- Select and validate a core set of analytical methods applicable across your therapy portfolio.
- Use the same equipment and software for data acquisition and analysis across different batches and products.
- Establish standardized acceptance criteria for CQAs where possible.
- Outcome Assessment: This standardization reduces method development time, accelerates batch release, and creates consistent data for regulatory submissions [15] [62].
The Scientist's Toolkit: Key Research Reagent Solutions
The table below details essential materials for developing GMP-compliant autologous cell therapy processes.
| Item | Function | GMP Consideration |
|---|---|---|
| Gibco CTS Immune Cell Serum-Free Media | Supports T-cell growth and expansion; a key component of culture systems. | Use GMP-manufactured, xeno-free formulations to ensure quality, safety, and regulatory compliance from research to clinical trials [16]. |
| Clinical-Grade Cytokines (e.g., IL-2, IL-7/IL-15) | Critical for T-cell activation, survival, and differentiation during manufacturing. | Source cytokines that are produced under GMP standards and are included in the regulatory filing (CMC section) for the therapy [5]. |
| Non-Viral Gene Delivery Systems | For CAR gene insertion as an alternative to viral vectors to reduce cost. | Use GMP-grade reagents for electroporation or with transposon/transposase systems like Sleeping Beauty or piggyBac [5]. |
| Closed System Processing Sets | Single-use, sterile fluid pathways for automated instruments. | Ensure these consumables are validated for use with your automated systems and are manufactured under quality-controlled conditions [16]. |
| Cell Cryopreservation Media | For freezing final drug product and intermediate materials like leukapheresis. | Select GMP-grade, defined-formulation media to ensure consistent post-thaw recovery and viability of critical cellular materials [15]. |
Strategic Framework for Standardization and Flexibility
This diagram illustrates the core-principle approach to balancing standardization with operational flexibility.
Autologous Cell Therapy Manufacturing Workflow
This diagram outlines the key stages in the manufacturing of autologous cell therapies, highlighting where standardization and flexibility can be applied.
In the development of autologous cell therapies, such as CAR-T cells, the Chain of Identity refers to the unbroken link between a patient and their own cells throughout the entire lifecycle—from collection (leukapheresis) through manufacturing, testing, and final infusion. The Chain of Custody tracks the physical movement, handling, and storage conditions of the therapeutic product, documenting every transfer between responsible parties [63]. For patient-specific "lot of one" therapies, a break in this chain can render a life-saving product unusable, resulting in significant financial loss and patient risk [63] [64].
Digitalizing these chains is not merely an operational improvement but a fundamental strategy for reducing the Cost of Goods Sold. Logistics alone can account for roughly 25% of total commercialization costs for these advanced therapies [63]. Implementing robust digital tracking systems directly addresses this by minimizing product loss, reducing manual documentation errors, streamlining audits, and enabling more scalable, decentralized manufacturing models essential for global accessibility [35] [64].
Core Tracking Models and Their Application to Cell Therapy
Different operational models can be applied to manage Chain of Custody, each with varying levels of rigor, cost, and complexity. Selecting the appropriate model is critical for balancing integrity with economic feasibility.
Chain of Custody Models
| Model | Description | Relevance to Autologous Cell Therapy |
|---|---|---|
| Identity Preservation | Tracks a product from a single, specific source without mixing with any other materials; maintains unique identity and story [65] [66]. | Ideal for ensuring the absolute integrity of a single patient's cells from vein-to-vein; highest assurance but most logistically complex and costly [65]. |
| Segregation | Tracks certified products kept separate from non-certified products; allows mixing of materials from different certified sources [65] [66]. | Could be applied to allogeneic therapies where donor cells from multiple certified sources are pooled, but less suitable for autologous. |
| Mass Balance | Allows mixing of certified/sustainable materials with non-certified materials; sustainable content is tracked via auditable bookkeeping [65] [66]. | Not typically used for autologous therapy custody but can be relevant for tracking sustainable or certified raw materials (e.g., media, reagents) used in the process. |
| Book and Claim | Decouples the physical flow of materials from the sustainability attributes, which are traded as certificates [65] [66]. | Not applicable to the physical chain of identity/custody for patient-specific cell therapies, as the physical and informational chains cannot be separated. |
For autologous cell therapies, the Identity Preservation model is the de facto standard due to the patient-specific nature of the product. The primary challenge is implementing this model in a cost-effective way [63].
Frequently Asked Questions (FAQs) for Researchers
This section addresses common technical and operational challenges faced in research and process development.
Q1: Our research lab is developing a new autologous therapy. What is the most cost-effective way to start implementing a digital Chain of Identity? Begin with a centralized, cloud-based database that uses a unique identifier (e.g., a QR code or barcode) linked to each patient's cell collection container. This identifier should be assigned immediately after leukapheresis and follow the product through every step. While simpler than full-scale IoT, this provides a foundational audit trail. The goal is to achieve "needle-to-needle" traceability without initial over-investment in complex hardware. As your process scales, this system can integrate with more advanced sensors and orchestration platforms [63].
Q2: We've recorded a temperature excursion in a cryogenic shipment of final product. What are the critical troubleshooting steps?
- Isolate the Product: Immediately move the product to a validated storage condition while the investigation is conducted.
- Review Data: Download and secure all temperature data from the data logger. Analyze the duration, magnitude, and point-in-process of the excursion.
- Check Chain of Custody Log: Review the digital custody log to identify all handling points and personnel involved during the excursion timeframe.
- Assess Product Impact: Consult pre-defined stability data to determine if the excursion falls within validated parameters. If not, a viability assessment (e.g., trypan blue exclusion, flow cytometry) may be necessary on a parallel quality control sample, but this can be destructive.
- Document and Report: Document all findings in a deviation report. The decision to use, discard, or conduct further testing on the product must involve the Quality team and be based on a pre-defined risk assessment [63] [67].
Q3: How can we prevent misidentification of patient samples during the manual "wash and spin" steps in our research process? Implement a "two-person verification" policy where two trained technicians independently scan the sample's barcode at the beginning and end of the manual process. The digital system should require both scans to log the step as complete. Furthermore, use of barcoded, single-use reagents and media bags that can be scanned upon addition creates a linked digital record, reducing manual entry errors [63].
Q4: Our data is siloed between the logistics provider, the manufacturing facility, and the clinic. How can we improve visibility without replacing all our systems? Investigate an orchestration platform that acts as a central hub. These platforms are designed to integrate with disparate systems (e.g., Electronic Medical Records, Laboratory Information Management Systems, and courier tracking APIs) through secure interfaces. This provides a unified view of the supply chain without requiring a complete overhaul of existing infrastructure, thereby protecting previous investments while enhancing transparency [63].
Technical Troubleshooting Guides
Issue 1: Chain of Identity Breakdown During Manufacturing
- Problem: Uncertainty about which patient's cells are in a specific bioreactor, potentially leading to a catastrophic misadministration.
- Required Data: Process log from the manufacturing execution system (MES), operator login records, and bioreactor batch records.
- Diagnostic Steps:
- Trace the unique identifier of the product currently in the bioreactor.
- Verify the digital "hand-off" scans from the incoming quarantine storage to the production suite.
- Confirm the log of all operators who accessed the suite during the transfer and initiation process.
- Cross-reference the patient-specific batch record with the MES data for timestamps and material usage.
- Resolution Protocol: If a break is confirmed, immediately place the product on quality hold. Do not proceed to harvest or formulation. A root cause investigation must be initiated, focusing on procedural adherence and system validation. The product may be deemed unusable if identity cannot be verified with absolute certainty [63] [67].
Issue 2: Cryogenic Storage Failure in Long-Term Storage
- Problem: Liquid nitrogen freezer alarm indicates a rapid loss of temperature or liquid nitrogen levels.
- Required Data: Real-time temperature monitoring alerts, fill-level logs, and preventive maintenance records for the storage unit.
- Diagnostic Steps:
- Check the IoT sensor dashboard for the specific freezer to confirm the alarm and review historical data.
- Visually inspect the unit for signs of failure or icing (which can indicate a vacuum breach).
- Verify the last preventive maintenance date and review any prior minor alarms.
- Check the inventory management system to identify all products stored in the affected unit.
- Resolution Protocol:
- Immediate Action: If a backup freezer is available, immediately transfer products using pre-validated and logged procedures. If not, contact pre-qualified vendors for emergency storage.
- Product Assessment: Assess the duration and severity of the temperature exposure. Products that have warmed above the glass transition temperature (typically <-130°C) are likely non-viable.
- Reporting: Document the incident and all corrective actions. A failure investigation report will be required for regulatory compliance [63] [67].
The Scientist's Toolkit: Essential Digital Tracking Components
The table below lists key technological components essential for establishing a robust digital chain of identity and custody in a research and manufacturing setting.
| Component | Function | Key Consideration for Cost-Reduction |
|---|---|---|
| Orchestration Platform | Software that integrates data from all supply chain partners (clinics, couriers, labs) into a single dashboard for end-to-end visibility [63]. | Reduces costly delays and product losses by providing real-time coordination; essential for managing complex, multi-stakeholder workflows. |
| IoT Temperature Loggers | Wireless sensors that monitor and transmit cryogenic (e.g., -150°C to -196°C) temperature data in real-time during transport and storage [63] [67]. | Prevents the massive cost of batch failure due to undetected temperature excursions, enabling proactive intervention. |
| Barcode/QR Code Labels | Unique, cryogenically durable identifiers applied to primary product containers (e.g., cryobags) [63] [67]. | A low-cost solution that automates data entry, drastically reducing misidentification errors compared to manual recording. |
| Blockchain/DLT Ledger | A decentralized, tamper-proof digital ledger for recording critical custody transfers and chain of identity checkpoints [67]. | Enhances trust and auditability, potentially streamlining regulatory reviews and reducing time-to-approval. |
| Electronic Batch Record (EBR) | A digital version of the batch record that automatically captures data from equipment and manual inputs during manufacturing. | Improves data integrity, reduces documentation errors, and accelerates batch release times, lowering overall labor costs. |
Experimental Protocol: Validating a New Chain of Identity Workflow
This protocol outlines the methodology for validating a new digital Chain of Identity system in a research or pilot-scale GMP environment.
1. Objective To validate that a new digital Chain of Identity system maintains 100% accuracy in linking a patient-specific cell therapy product to the correct donor throughout a simulated manufacturing process, with zero misidentification events.
2. Materials and Equipment
- Mock patient samples (e.g., buffy coats or cell lines)
- Barcoded cryogenic vials and bags
- Handheld barcode scanners
- Orchestration platform or database software
- IoT data loggers (optional, for simultaneous custody tracking)
3. Methodology 1. Sample Labeling: Generate a unique identifier for each mock patient sample. Apply the barcode to the primary container (cryovial). 2. System Baseline: Scan each identifier to register it in the digital system, creating the initial chain of identity record. 3. Process Simulation: Process the samples through a simulated workflow: * Transfer from receiving to quarantine storage. * Move to a biosafety cabinet for a "mock transduction" step. * Transfer to a simulated bioreactor (incubator). * Move to final formulation and cryopreservation. * Place into long-term cryogenic storage. 4. Data Capture: At each transfer and processing step, personnel must scan the container's barcode using the handheld scanner. The system will log the identity, timestamp, location, and operator. 5. Intentional Challenges: Introduce controlled challenges, such as: * Presenting two samples with similar identifiers in sequence. * Attempting to process a sample without a prior scan in the sequence. 6. Data Analysis: At the end of the simulation, run system reports to trace the journey of each individual sample. Manually verify that the digital trail for each sample is complete and without cross-contamination of records.
4. Data Analysis
- Calculate the percentage of process steps that were successfully recorded in the digital system.
- Record the number of any "near-miss" identification errors caught by the system.
- Confirm a 0% error rate in the final product identity assignment.
Workflow Visualization
The diagram below illustrates the integrated digital tracking of both Chain of Identity and Chain of Custody in a simplified autologous cell therapy workflow.
For developers of autologous cell therapies, batch failure is more than a manufacturing setback—it directly impacts patient lives. With process failure rates estimated at 5-10% and each failed batch costing over $100,000 to manufacture, the consequences are both clinically and commercially significant [68]. For patients who have endured intensive collection procedures, a failed batch can be clinically devastating, underscoring the critical need for robust contamination control and process reliability [68]. This technical support center provides practical guidance to help researchers and manufacturers navigate these complex challenges.
Troubleshooting Guides
Bacterial Contamination Control
Problem: Culture media appears turbid with yellow or brown discoloration, pH drops significantly, and microscopic examination reveals black sand-like particles with cellular growth inhibition [69].
Solutions:
- Immediate Action: Apply high concentrations of broad-spectrum antibiotics (penicillin, streptomycin, or gentamicin) for shock treatment, then replace with regular antibiotic-containing media [69].
- Detection Methods: Perform Gram staining, culture contaminated samples on sterile plates, or use PCR for specific bacterial gene sequences [69].
- Prevention Strategy: Implement strict aseptic techniques, use single-use disposable materials where possible, and establish closed systems for cell manipulation [70] [71]. Regularly disinfect incubators and workbenches, and ensure all media and equipment are properly sterilized before use [69].
Fungal Contamination Management
Problem: Visible filamentous structures appear on the medium surface, often with white spots and yellow precipitates, accompanied by slowed cell growth and abnormal cell morphology [69].
Solutions:
- Immediate Action: Apply antifungal agents (amphotericin B or nystatin) immediately upon detection [69].
- Detection Methods: Examine culture microscopically for hyphae or spores, culture on antifungal-containing plates, or use PCR for fungal DNA sequences [69].
- Prevention Strategy: Maintain proper laboratory humidity control, ensure regular HEPA filter changes in laminar flow hoods, and implement strict environmental monitoring programs [70].
Mycoplasma Contamination Resolution
Problem: Medium turns yellow prematurely, cell growth slows significantly, and cells display abnormal morphology with spreading and filamentous growth patterns despite normal appearance under standard microscopy [69].
Solutions:
- Immediate Action: Treat with tetracyclines, macrolides, or kanamycin. For heat-sensitive cells, incubate at 41°C for 10 hours to eradicate mycoplasma [69].
- Detection Methods: Use fluorescence staining (Hoechst 33258), electron microscopy, PCR for specific mycoplasma gene sequences, or immunofluorescence staining [69].
- Prevention Strategy: Implement regular monitoring with mycoplasma detection kits, establish strict cell banking and quarantine procedures for new cell lines, and maintain thorough laboratory cleaning protocols [70] [69].
Table 1: Contamination Characteristics and Detection Methods
| Contamination Type | Visual Characteristics | Impact on Cells | Primary Detection Methods |
|---|---|---|---|
| Bacterial | Turbid, yellow-brown media; pH drop | Growth inhibition; black sand-like particles under microscope | Gram staining; Culture methods; PCR [69] |
| Fungal | Filamentous structures; white spots | Slow growth; abnormal morphology | Microscopic examination; Antifungal culture; PCR [69] |
| Mycoplasma | Premature yellowing of media | Slow proliferation; abnormal spreading | Fluorescence staining; Electron microscopy; PCR [69] |
Process Robustness Optimization
Addressing Donor-to-Donor Variability
Problem: Significant variability in cell growth and performance between different patient donors, leading to inconsistent manufacturing outcomes [72].
Solutions:
- Process Design: Include donor variability assessment early in process development. Test processes with cells from multiple donors with different biological characteristics [72].
- Media Optimization: Develop defined, xeno-free media formulations to reduce batch-dependent variability associated with serum-containing media [72].
- Process Parameters: Systematically optimize critical process parameters like cell seeding densities, media refreshment strategies, and dissolved oxygen tension to accommodate donor variations [72].
Scaling-Out Autologous Processes
Problem: Inefficient translation from laboratory-scale processes to commercially viable manufacturing with multiple simultaneous patient batches [73] [71].
Solutions:
- Platform Selection: Implement scalable production platforms early in development. For adherent cells like MSCs, consider microcarrier-based stirred tank reactors, hollow fiber systems, or wave bags [72].
- Automation: Integrate automated production processes to reduce manual handling, improve consistency, and enable robust process monitoring [72].
- Quality by Design (QbD): Apply QbD principles and Design of Experiment (DoE) approaches to optimize process parameters and identify proven acceptable ranges [73].
Frequently Asked Questions (FAQs)
Q: How can we select the most suitable antibiotics for our cell therapy process? A: First identify the contamination type, then select antibiotics targeting the specific microorganisms. Conduct susceptibility tests to determine optimal antibiotic type and concentration before full implementation, considering potential cytotoxic effects on your specific cell type [69].
Q: What strategies effectively prevent repeated contamination events? A: Implement comprehensive measures including strict aseptic techniques, environmental control, regular staff training, and continuous observation of cell cultures. Establish rigorous reagent quality control and maintain detailed documentation to identify contamination sources quickly [69].
Q: How can we demonstrate product comparability after process changes? A: Develop robust assays that ensure product quality attributes are maintained. Focus on assays with higher biological specificity that link to cell potency and mechanism of action, not just basic characterization metrics. Consider epigenetic analyses and other advanced technologies to comprehensively evaluate therapeutic potential [72].
Q: What are the key considerations when moving from clinical to commercial-scale manufacturing? A: Implement phase-appropriate validations. For early clinical phases, assays should be suitably validated using a single batch of material. For late-stage commercial development, perform full validation with a minimum of three batches under formal product-specific qualification [70].
Q: How can we control costs while maintaining quality in autologous therapies? A: Focus on reducing labor-intensive processes through automation, implement single-use technologies to minimize validation costs, develop defined media formulations to reduce testing requirements, and establish strategic partnerships to leverage existing infrastructure and expertise [68] [72].
Experimental Protocols
Mycoplasma Detection Protocol
Method: Fluorescence Staining Assay
- Culture cells on sterile coverslips in 35-mm dishes until 60-70% confluent
- Fix cells with fresh Carnoy's fixative (methanol:glacial acetic acid, 3:1) for 5 minutes
- Stain with Hoechst 33258 dye (0.1 µg/mL in PBS) for 10 minutes in the dark
- Rinse with distilled water and mount on slides
- Examine under fluorescence microscope with 360 nm excitation filter
- Positive result: Distinct particulate or filamentous fluorescence patterns in cytoplasm and outside cell nuclei
Bioburden Monitoring Protocol
Method: Systematic Environmental Monitoring
- Establish regular testing schedule for critical zones
- Use contact plates for surface monitoring in biosafety cabinets and incubators
- Implement active air sampling using volumetric samplers
- Test water baths weekly for bacterial and fungal contamination
- Monitor personnel technique through regular glove prints
- Document all results with immediate investigation of deviations
Research Reagent Solutions
Table 2: Essential Materials for Contamination Control
| Reagent/Equipment | Function | Application Notes |
|---|---|---|
| Defined, Xeno-Free Media | Provides consistent nutrient base without animal-derived components | Reduces batch variability and contamination risk from serum [72] |
| Broad-Spectrum Antibiotics | Controls bacterial contamination | Use penicillin/streptomycin for prevention; gentamicin for broader coverage [69] |
| Antimycotic Agents | Prevents fungal contamination | Amphotericin B is effective but requires cytotoxicity testing [69] |
| Mycoplasma Detection Kit | Regular monitoring for mycoplasma | Essential for early detection; use monthly or with new cell introductions [69] |
| PCR Assays | Detects specific contaminants | Highly sensitive for mycoplasma and disease-causing viruses [70] |
| Hoechst 33258 Stain | Fluorescent detection of mycoplasma | Critical for identifying contamination not visible under standard microscopy [69] |
Process Visualization
Contamination Control Workflow
Process Robustness Development
Evaluating Cost-Reduction Strategies Through Economic and Workflow Analysis
This technical support guide provides a comparative analysis of autologous and allogeneic cell therapy manufacturing workflows, focusing on economic considerations and common procedural challenges. It is designed to assist researchers and scientists in optimizing processes to reduce manufacturing costs, particularly for autologous therapies.
Comparative Analysis: Autologous vs. Allogeneic Cell Therapies
Table 1: Key Characteristics of Autologous and Allogeneic Cell Therapies
| Characteristic | Autologous Therapy | Allogeneic Therapy |
|---|---|---|
| Cell Source | Patient's own cells [23] [74] | Healthy donor cells [23] [74] |
| Immune Rejection Risk | Minimal [74] [75] | Higher risk of Graft-versus-Host Disease (GvHD) [23] [74] |
| Manufacturing Model | Custom, patient-specific [23] [28] | Batch-produced, "off-the-shelf" [23] [74] |
| Production Scalability | Challenging; scale-out strategy [23] | Easier; scale-up strategy [23] |
| Typical Cost of Goods Sold (COGS) | High [28] | Lower potential due to economies of scale [23] [74] |
Table 2: Economic and Logistics Comparison
| Factor | Autologous Therapy | Allogeneic Therapy |
|---|---|---|
| Treatment Cost Range | ~$5,000 to $50,000+ (varies by condition and region) [76] [77] [78] | Often higher base cost due to donor screening and complex engineering [77] |
| Supply Chain | Complex, circular logistics [23] | More linear, bulk processing [23] |
| Treatment Timelines | Weeks to months (custom manufacturing) [74] [75] | Immediate/"off-the-shelf" availability possible [74] [75] |
| Key Cost Drivers | Personalized production, complex logistics, vein-to-vein time [23] [8] [28] | Donor screening, immune mismatch management, immunosuppressive regimens [23] [74] |
Troubleshooting Guides
FAQ 1: How can we reduce the high costs associated with autologous cell therapy manufacturing?
Challenge: The patient-specific, customized nature of autologous therapies leads to high costs and complex logistics [28].
Solutions & Troubleshooting:
- Implement Automated, Closed Systems: Transition from manual, open-process handling to automated closed-system bioreactors. This reduces contamination risk, lowers cleanroom requirements, and decreases hands-on labor [28].
- Optimize and Shorten Process Duration: Work to reduce the total vein-to-vein time. For CAR-T cells, shorter expansion periods (e.g., 3-day platforms) can enhance cell potency and significantly lower facility and resource costs [8] [28].
- Adopt Point-of-Care (POC) Manufacturing: Explore decentralized manufacturing models. Producing therapies closer to the patient at qualified hospital sites can eliminate extensive and costly cryogenic transport logistics [8].
- Utilize Non-Viral Engineering Methods: Investigate non-viral vectors like the Sleeping Beauty transposon system or CRISPR delivered via electroporation. These methods can be more cost-effective than traditional viral vectors (e.g., lentiviruses) which require advanced labs and are expensive to produce [8] [35].
FAQ 2: What are the primary strategies to mitigate immune rejection in allogeneic "off-the-shelf" therapies?
Challenge: Donor-derived cells are recognized as foreign by the recipient's immune system, leading to graft rejection or GvHD [74].
Solutions & Troubleshooting:
- Genetic Engineering for Immune Evasion: Use gene editing technologies like CRISPR/Cas9 to create Universal or "off-the-shelf" cell products. This involves knocking out genes responsible for immune recognition (e.g., HLA genes) to prevent host T-cells and NK cells from attacking the graft [8] [79].
- Leverage Immune-Privileged Cell Types: Utilize cell sources with inherent low immunogenicity, such as Mesenchymal Stem Cells (MSCs). MSCs have demonstrated low levels of immune rejection, potentially eliminating the need for strong immunosuppression in some applications [74].
- Employ Co-Therapy with Immunosuppressants: Administer immunosuppressive drugs to the patient to prevent rejection of the allogeneic cells. This is a common but less ideal strategy due to associated risks like increased infection susceptibility and organ toxicity [74].
FAQ 3: How can we improve batch-to-batch consistency in autologous therapies despite patient-to-patient variability?
Challenge: The starting cell material from patients varies greatly in quality, potency, and viability due to factors like age, disease status, and prior treatments, leading to heterogeneous final products [74].
Solutions & Troubleshooting:
- Implement Advanced Analytics for In-Process Control: Integrate next-generation sequencing (NGS), particularly single-cell NGS (scNGS), and AI-driven analytics. These tools provide deep characterization of cell populations, allowing for process adjustments to enrich for the most therapeutically relevant cells and ensure they meet critical quality attributes (CQAs) [28].
- Establish Robust Pre-Screening Protocols: Diligently screen patient cell material prior to initiating the manufacturing process. This helps identify patients whose cells may not be suitable for therapy due to poor quality or genetic predisposition, saving resources and preventing failed batches [74].
- Standardize and Control the Manufacturing Process: While the starting material varies, the manufacturing process itself must be highly standardized. Using defined, serum-free media, controlled bioreactor parameters, and automated systems can minimize process-induced variability [23] [28].
Workflow Diagrams
Autologous vs. Allogeneic Cell Therapy Manufacturing Workflow
Strategies for Reducing Autologous Therapy Costs
The Scientist's Toolkit: Key Research Reagent Solutions
Table 3: Essential Materials for Cell Therapy Research and Development
| Reagent/Material | Function/Application | Considerations for Cost Reduction |
|---|---|---|
| Non-Viral Vectors (e.g., Sleeping Beauty transposon system, piggyBac, CRISPR/Cas9 delivered via electroporation) [8] [35] | Genetic modification of T-cells for CAR-T therapy without using costly viral vectors. | Simplifies manufacturing, eliminates need for high-containment viral production labs, reduces raw material costs [8] [35]. |
| Serum-Free, Xeno-Free Cell Culture Media | Supports cell growth and expansion under defined, regulatory-compliant conditions. | Reduces batch-to-batch variability, improves product consistency, and mitigates risk of zoonotic contaminants, leading to fewer failed batches [74]. |
| Closed, Automated Bioreactor Systems | Scalable cell expansion in a controlled, automated environment. | Minimizes manual handling, reduces contamination risk, lowers cleanroom classification requirements, and improves process reproducibility [23] [28]. |
| Advanced Characterization Tools (e.g., Next-Generation Sequencing (NGS), single-cell NGS) [28] | Deep phenotypic and functional analysis of cell products for quality control. | Identifies critical quality attributes early, allows for process optimization to enrich potent cell subsets, and can reduce the number of cells needed per dose [28]. |
This technical support center provides resources for researchers and scientists focused on reducing manufacturing costs for autologous cell therapies. The following guides and FAQs address common challenges and present data-driven case studies on implementing automation.
Frequently Asked Questions (FAQs)
1. What are the primary cost drivers in manual autologous cell therapy manufacturing?
In manual processes, labor is the most significant cost driver, often accounting for about 50% of the overall Cost of Goods (CoG) [25]. Other major costs include materials, facility expenses for high-grade cleanrooms (typically Grade B), and the high capital investment required for multiple segregated processing suites to prevent cross-contamination between patient-specific batches [25] [15].
2. How does automation reduce operational costs beyond just replacing staff?
Automation leads to substantial cost savings by:
- Reducing error rates and contamination risks, which lowers batch failure rates [25].
- Minimizing facility costs by enabling operations in lower-grade (Grade C) cleanrooms through the use of closed systems [25].
- Decreasing long-term operational costs such as overtime and training, while improving process consistency and scalability [80] [81].
3. What is the typical payback period for investing in automated manufacturing systems?
The payback period can be attractive, though the first year may show a negative Return on Investment (ROI). One detailed case study showed a first-year ROI of -£80,400, but a strongly positive second-year ROI of £83,600. Over a three-year period, the cumulative savings can be significant, reaching £86,800 in the cited case [82].
4. Can a process be partially automated, and is it cost-effective?
Yes, implementing partial automation is a common and often highly effective strategy. In one analysis, a partially automated process achieved a lower cost per patient ($46,832) than either the fully manual baseline or a fully automated process with low throughput. Partial automation provides flexibility and can be an excellent way to phase in technology while managing capital investment [25].
5. How does automation impact headcount and the roles of skilled operators?
Automation typically reduces the number of operators required for repetitive manual tasks. A case study demonstrated a reduction from 4 operators per shift to just 2 [82]. However, the roles of skilled personnel often shift from hands-on manual processing to managing automated systems, data analysis, and overseeing multiple parallel processes, thereby increasing overall productivity [83].
Quantitative Data Comparison: Manual vs. Automated Processes
The following tables summarize key cost and performance metrics from published case studies.
Table 1: General Manufacturing Case Study (RNA Automation)
This table details a direct comparison between a manual and an automated assembly system.
| Metric | Manual Process | Automated Process |
|---|---|---|
| Operators per Shift | 4 | 2 [82] |
| Annual Labor Cost | £200,000 | £100,000 [82] |
| System Cost | Not Applicable | £164,000 [82] |
| First-Year ROI | Baseline | -£80,400 [82] |
| Second-Year ROI | Baseline | £83,600 [82] |
| Two-Year Total Expenses | £400,000 | £396,800 [82] |
Table 2: Autologous Cell Therapy Manufacturing Cost Analysis
This table is based on modeling of an autologous dendritic cell therapy process.
| Metric | Manual Process (Baseline) | Partially Automated Process | Fully Automated Process (Double Capacity) |
|---|---|---|---|
| Cost per Batch/Patient | ~$48,000 (est. from 36,482 USD after 24% reduction) [25] | $46,832 [25] | $43,532 [25] |
| Labor as % of CoG | 50% [25] | 26% [25] | Not Explicitly Stated |
| Capital as % of CoG | Lower than labor | 41% [25] | 47% [25] |
| Annual Throughput (Batches) | 50 [25] | 84 [25] | 100 [25] |
| Key Enabler | N/A | Flexibility & targeted automation | Parallel processing & high throughput [25] |
Experimental Protocols for Cost-Benefit Analysis
Protocol 1: Modeling the Impact of Labor Headcount on Cost of Goods (CoG)
Objective: To quantitatively assess how changes in personnel numbers impact the overall cost per batch of an autologous cell therapy.
Methodology:
- Establish Baseline Model: Using software modeling platforms, create a baseline model of your cell therapy manufacturing process (e.g., autologous dendritic cells). Include all manual steps from cell isolation through differentiation and maturation [25].
- Define Labor Teams: The model should account for an operations team (operators and supervisors) and a quality team (quality assurance and quality control personnel). The baseline assumes two operators are required for all GMP processing operations within an 8-hour shift [25].
- Run Sensitivity Analysis: Using the model, calculate the CoG per batch while varying the total headcount. The analysis should range from a minimum viable team (e.g., two operators plus a supervisor for break coverage) to the maximum required for a cleanroom running at full capacity (e.g., 10 personnel) [25].
- Analyze Results: The model will output the cost per batch at different headcount levels. This identifies the potential cost savings from optimizing team size and highlights labor as a primary cost driver [25].
Expected Outcome: A sensitivity analysis chart (similar to Figure 1 in [25]) showing that a reduction in headcount from the baseline can lead to a significant (e.g., 24%) reduction in CoG per batch.
Protocol 2: Evaluating the Financial Payback of an Automation System
Objective: To calculate the Return on Investment (ROI) and payback period for implementing an automated manufacturing system.
Methodology:
- Calculate Current Costs: Determine the total annual cost of manual labor. Include all operators across shifts, factoring in salaries, training, taxes, and other associated expenses [82].
- Example: 4 operators/shift × 2 shifts/day × £25,000/year = £200,000/year [82].
- Define New Automated State: Identify the new, reduced number of operators required to run the automated system. Obtain the total capital cost of the automated system and estimate its useful life (e.g., 10 years) [82].
- Calculate Post-Automation Costs:
- Compute Annual ROI: Compare the annual savings to the costs.
- Year 1 ROI: (Annual Manual Labor Cost) - (Annual Auto Labor Cost + System Cost + First-Year Depreciation). This is often negative due to the high initial investment [82].
- Subsequent Year ROI: (Annual Manual Labor Cost) - (Annual Auto Labor Cost + Annual Depreciation). This shows the recurring annual savings after the first year [82].
Expected Outcome: A clear financial model showing the point at which the cumulative savings from automation exceed the initial investment, demonstrating the payback period and long-term value.
Workflow Diagrams for Process Evaluation
Diagram 1: Decision Workflow for Automating a Manufacturing Process
Diagram 2: Scaling Strategy for Automated Cell Therapy Manufacturing
The Scientist's Toolkit: Key Automation & Reagent Solutions
Table 3: Research Reagent and System Solutions for Cell Therapy Automation
This table details key equipment and platforms used to automate specific unit operations in cell therapy manufacturing.
| Item Name | Function in Automation | Application Context |
|---|---|---|
| Sepax System(BioSafe SA) | Automated, closed-system cell separation and washing [25]. | Cell isolation and concentration steps [25]. |
| Quantum System(Terumo BCT) | Programmable, automated cell expansion platform [25]. | Scaling up cell numbers in a closed, automated system [25]. |
| Cocoon Platform(Octane Biotech) | Automated, closed manufacturing system for individual patient batches [25]. | End-to-end automated processing of autologous cell therapies [25]. |
| CliniMACS System(Miltenyi Biotec) | Automated cell separation using magnetic-activated cell sorting (MACS) technology. | Clinical-scale cell isolation and purification [25]. |
| Closed System Fluid Paths(e.g., Tube Welder/Sealer) | Enables sterile connections and disconnections between single-use assemblies [25]. | Critical for maintaining a closed process, allowing cleanroom grade reduction [25]. |
| Media Sub-aliquoting | Pre-preparation of media into smaller, batch-specific kits [25]. | Reduces material waste and cost per batch in small-scale manufacturing [25]. |
FAQs: CDMO Partnerships for Autologous Cell Therapies
Q1: What are the primary benefits of partnering with a CDMO for autologous cell therapy manufacturing?
Partnering with a CDMO provides cost and time efficiency by eliminating the need for massive capital investment in specialized GMP facilities and operational teams, which is especially beneficial for startups focusing resources on R&D [84]. CDMOs offer specialized expertise and regulatory experience in complex cell therapy manufacturing and global compliance standards, helping to streamline tech transfers and scale-up operations [84] [85]. They also provide scalability and flexible capacity, allowing companies to manage the highly variable, patient-specific production batches of autologous therapies without being limited by fixed internal capacity [85].
Q2: When in the development lifecycle should a company engage a CDMO partner?
Engaging a CDMO early in the development process is highly recommended. Early engagement allows for collaborative development of a 'best-launch' process and facilitates smoother tech transfer and scale-up from clinical to commercial manufacturing [85]. This early partnership ensures that phase-appropriate and commercially viable manufacturing processes are designed with Quality by Design (QbD) principles from the outset [85].
Q3: What are the different partnership models available with CDMOs?
The primary models are the Traditional Service Provider, where specific manufacturing services are outsourced; the Integrated "Innovation Partner", where the CDMO acts as a strategic partner offering end-to-end services from development to commercial manufacturing, often blending CDMO and CRO (Contract Research Organization) capabilities to reduce handoffs and data silos [86] [87]; and the Hybrid Model, where a company keeps critical or proprietary processes in-house while outsourcing other steps to a CDMO for flexibility and risk mitigation [84].
Q4: What key challenges in autologous therapy manufacturing can a CDMO help solve?
CDMOs directly address several critical challenges:
- Supply Chain Complexity: They implement advanced management systems for real-time tracking and coordination of patient-specific materials, mitigating risks during transport and ensuring vein-to-vein timelines are met [15].
- Scalability: They offer solutions like automation, closed systems, and modular flexible facilities to handle multiple patient-specific batches simultaneously, enabling "scale-out" rather than traditional "scale-up" [15] [88].
- High Costs: They leverage standardized processes, automation, and shared transportation protocols to drive down the high per-unit costs inherent in personalized therapies [15].
Troubleshooting Guides
Guide 1: Addressing High Cost of Goods (COGs) in Autologous Manufacturing
- Problem: Resource-intensive, patient-specific production processes lead to unsustainable COGs [15].
- Solution A: Implement Automation and Closed Systems
- Procedure: Transition from manual, open-process steps to automated, closed manufacturing systems. This reduces manual labor, lowers contamination risks, improves batch-to-batch reproducibility, and increases overall process efficiency [86] [88].
- Validation: Execute a comparability study to demonstrate that the product quality from the automated process is equivalent or superior to the manual process.
- Solution B: Optimize Quality Control (QC) Processes
- Procedure: Integrate multi-omics platforms and Process Analytical Technology (PAT) for rapid, in-line, or at-line release testing. This alleviates one of the largest bottlenecks in manufacturing and accelerates product release timelines [88].
- Validation: Perform method validation for new analytical procedures and demonstrate data integrity and reliability for regulatory submissions.
Guide 2: Managing Supply Chain and Logistical Complexity
- Problem: The vein-to-vein chain for patient cells is fragile, time-sensitive, and prone to delays [15].
- Solution A: Deploy Digital Tracking Systems
- Procedure: Implement a cloud-based digital platform that provides end-to-end visibility and real-time monitoring of the apheresis kit, patient cell material, and final product across the entire supply chain [15] [88].
- Validation: Conduct a system operational qualification (OQ) to ensure data accuracy and perform a mock shipment to test chain-of-custody and condition reporting.
- Solution B: Explore Point-of-Care (POC) Manufacturing
- Procedure: For certain therapies, evaluate a decentralized POC manufacturing model. This involves establishing smaller, automated manufacturing units at or near clinical treatment centers, drastically reducing transport logistics and vein-to-vein time [89].
- Validation: Follow emerging regulatory guidance on multi-site manufacturing. Implement a centralized process development and control strategy to ensure product consistency across all POC sites [89].
Guide 3: Overcoming Scalability Limitations
- Problem: Traditional scale-up (increasing batch size) is not feasible for autologous therapies; each patient is a new batch [15].
- Solution: Adopt a Scale-Out Strategy with Platform Processes
- Procedure: Instead of larger bioreactors, use multiple parallel, automated, closed-system processing units (e.g., bioreactors or cell processing devices) within a facility. Standardize these workflows into a platform process that can be replicated consistently [15] [90].
- Validation: Perform process validation on the platform technology itself. Demonstrate consistent Critical Quality Attributes (CQAs) across multiple parallel units running different patient batches concurrently.
Experimental Protocols for Cost-Reduction Strategies
Protocol 1: Evaluating an Automated, Closed Cell Processing System
Objective: To validate the implementation of an automated, closed-system technology for a key manufacturing step (e.g., cell expansion or formulation) and assess its impact on cost and process robustness.
Materials:
- Patient Apheresis Material: Obtain under informed consent.
- Automated, Closed Processing Unit: e.g., A proprietary, functionally closed, automated cell processing system.
- Traditional Manual Process Equipment: e.g., Culture flasks, centrifuges, biosafety cabinets.
- QC Assays: Cell count, viability, flow cytometry, sterility testing.
Methodology:
- Process Setup: Establish the manufacturing process in parallel using both the automated system and the traditional manual method.
- Parallel Processing: Process a minimum of n=10 patient batches using each method. Record all process parameters automatically via the system's software and manually for the traditional method.
- Data Collection:
- Record process metrics: Total hands-on time, processing time, volume of reagents used.
- Record product quality metrics: Final cell yield, viability, and identity/potency markers.
- Record failure rates: Incidences of contamination, manual error, or batch failure.
- Data Analysis:
- Perform a statistical comparison (e.g., t-test) of process and product metrics between the two groups.
- Calculate the cost per batch for each method, factoring in labor, materials, and capital equipment depreciation.
Protocol 2: Implementing a Rapid, In-Line Potency Assay
Objective: To develop and qualify a rapid potency assay to replace a lengthy off-line method, thereby reducing QC testing time and cost.
Materials:
- Final Product Samples: From multiple patient batches.
- Reference Standard: A well-characterized cell therapy product sample.
- New Rapid Assay Kit/Platform: e.g., A multi-omics platform or a flow cytometry-based functional assay.
- Traditional Potency Assay Materials: e.g., Co-culture bioassay components.
Methodology:
- Assay Development: Optimize the protocol for the new rapid assay, defining critical parameters and acceptance criteria.
- Qualification Runs: Test the same set of final product samples (n≥20) using both the new rapid assay and the traditional reference method.
- Data Analysis:
- Assess the correlation between the results of the two methods using linear regression.
- Determine the precision (repeatability and intermediate precision) of the new assay.
- Calculate the time to result and cost per test for both assays.
- Implementation: Submit the qualification data to regulators for approval to use the new assay for lot release, citing ICH Q2(R1) guidelines.
Quantitative Data on CDMO Market and Impact
Table 1: U.S. Cell and Gene Therapy CDMO Market Projections
| Metric | Value/Estimate | Timeframe | Source/Context |
|---|---|---|---|
| Market Size | $1.94 Billion | 2025 | [91] |
| Projected Market Size | $10.34 Billion | 2033 | [91] |
| Compound Annual Growth Rate (CAGR) | 23.26% | 2025-2033 | [91] |
| Global CGT Manufacturing Market | $32.11 Billion | 2025 | [89] |
| Projected Global Market | $403.54 Billion | 2035 | [89] |
| Global Market CAGR | 28.8% | 2025-2035 | [89] |
Table 2: Key Cost Drivers and Reduction Strategies in Autologous Therapy Manufacturing
| Cost Driver | Impact | Proposed Mitigation Strategy | Potential Benefit |
|---|---|---|---|
| Manual, Labor-Intensive Processes | High labor costs, variability, contamination risk [88] | Implement automated, closed systems [86] | Reduces hands-on time, improves reproducibility, lowers failure rates [88] |
| Quality Control Bottlenecks | Long release times, high testing costs [86] | Adopt rapid, in-line PAT and multi-omics platforms [88] | Accelerates release, reduces QC costs, provides deeper product insights [88] |
| Complex Supply Chain & Logistics | High transport costs, cell viability risks, cryopreservation needs [15] | Utilize real-time tracking systems; explore Point-of-Care models [89] | Shortens vein-to-vein time, improves cell viability, may eliminate cryopreservation [89] |
| Lack of Process Standardization | High development costs, difficult tech transfer [15] | Develop platform processes for consistent workflows [15] | Accelerates timelines, reduces development costs, facilitates scaling out [15] |
Workflow and Process Diagrams
Autologous Cell Therapy Vein-to-Vein Workflow
Strategic Framework for Cost Reduction
The Scientist's Toolkit: Key Reagents & Materials
Table 3: Essential Research Reagent Solutions for Autologous Cell Therapy Process Development
| Reagent/Material | Function | Application in Cost-Reduction Research |
|---|---|---|
| Serum-Free Media Formulations | Provides nutrients for cell growth and expansion without animal-derived components. | Essential for developing standardized, chemically defined processes that reduce variability and improve regulatory compliance, crucial for scale-out [90]. |
| Cell Activation & Transduction Reagents | Stimulates T-cells and facilitates the introduction of genetic material (e.g., CAR transgene via viral vectors). | Optimizing the efficiency and cost of these reagents is a primary target for reducing the overall Cost of Goods (COGs) [88]. |
| Viral Vectors (Lentiviral, Retroviral) | Delivery vehicles for stable genetic modification of patient cells (e.g., CAR-T therapies). | The production and cost of viral vectors are major bottlenecks. Research focuses on improving vector titers and transfection efficiency to lower costs [85]. |
| Cryopreservation Media | Protects cell viability during freeze-thaw cycles for storage and transport. | Critical for ensuring final product quality in a complex supply chain. Optimizing formulations can improve post-thaw recovery, reducing the risk of batch failure [15]. |
| Cell Separation & Selection Kits | Isolates and purifies specific cell populations (e.g., CD4+/CD8+ T-cells) from apheresis material. | Standardizing the starting cell population is key to process consistency. Automated, closed-system kits help reduce manual steps and variability [15] [88]. |
This technical support center provides troubleshooting guides and FAQs to help researchers and scientists overcome common challenges in autologous cell therapy manufacturing, with the goal of reducing production costs.
Frequently Asked Questions (FAQs)
What are the primary cost drivers in autologous cell therapy manufacturing? The high costs are driven by personalized production for each patient, complex logistics, reliance on viral vectors, lengthy cell expansion processes, and extensive quality control testing. Manufacturing costs routinely exceed USD 1 million per treatment [92] [8].
How can automation improve manufacturing ROI? Automation reduces human error, improves reproducibility, and increases regulatory capacity. By reducing manual interventions, it minimizes FDA inspection scope, freeing quality-assurance resources to support more concurrent programs. This transforms automation from a cost-containment tool into a revenue-expandability lever [92].
What technological advancements show promise for cost reduction? Non-viral vectors (Sleeping Beauty, piggyBac, CRISPR), delivered via nanoparticles or electroporation, can streamline manufacturing and eliminate viral vector needs. AI-driven analytics optimize cell growth conditions and predict quality deviations, while decentralized point-of-care manufacturing minimizes logistical expenses [8] [93].
Why is viral vector production a critical bottleneck? Viral vectors (AAV, lentiviral systems) remain essential for many therapies, and demand outstrips supply. Contract manufacturers are guaranteeing vector slots under multi-year agreements, crowding out smaller developers and increasing costs [92].
What operational strategies help manage autologous therapy complexity? CDMOs are launching disease-specific cleanroom suites, allowing developers to pre-book capacity years in advance. Digital traceability platforms are crucial for managing dozens of parallel micro-batches daily and maintaining chain-of-identity tracking [92].
Troubleshooting Guides
Poor Cell Viability During Expansion
Problem: Low cell viability during the expansion phase of autologous therapies.
Investigation Questions:
- What is the nutrient composition and pH of your media?
- When did you first observe the viability drop?
- Where is the issue occurring (bioreactor, flask)?
- Why might contamination be occurring?
- Who else has used this media lot?
- How are environmental conditions monitored?
Resolution Protocol:
- Immediate Actions: Check sterility, replace media, and document conditions
- Process Review: Verify handling procedures and quality control checkpoints
- System Implementation: Install real-time biosensors with AI analytics to monitor cell culture conditions continuously [94]
High Batch Failure Rates in Final Product
Problem: Consistent batch failures during final quality assessment.
Investigation Questions:
- What specific quality tests are failing?
- Where in the workflow do deviations occur?
- When did failure rates increase?
- Why might process consistency vary?
- Who performs critical manipulation steps?
- How are operators trained and certified?
Resolution Protocol:
- Root Cause Analysis: Implement AI-based data observability agents to detect anomalies in near real-time [94]
- Process Adjustment: Deploy closed, automated systems that reduce human manipulation points [92]
- Preventive Measures: Establish digital twin models to simulate production before implementation [93]
Inconsistent Transfection Efficiency
Problem: Variable transfection results in gene-modified cell therapies.
Investigation Questions:
- What vector-to-cell ratio are you using?
- Where are vectors stored and how old are they?
- When during culture are you performing transfection?
- Why might cell health be compromised?
- Who prepared the vectors and what lot was used?
- How are you measuring efficiency?
Resolution Protocol:
- Vector Quality Control: Test vector potency and purity
- Process Optimization: Use machine learning algorithms to identify optimal growth conditions and transfection timing [93]
- Alternative Methods: Evaluate non-viral delivery systems (electroporation, nanoparticles) as more consistent alternatives [8]
Cost Analysis Data
Table 1: Cell Therapy Manufacturing Market Forecast
| Metric | 2024 Value | 2025 Value | 2030/2034 Projection | CAGR |
|---|---|---|---|---|
| Cell Therapy Manufacturing Market | USD 4.83 billion [93] | USD 5.55 billion [93] | USD 18.89 billion by 2034 [93] | 14.61% [93] |
| Cell & Gene Therapy Manufacturing Services | - | USD 8.0 billion [92] | USD 17.18 billion by 2030 [92] | 16.5% [92] |
| Autologous Therapy Segment Share | 59% [93] | - | - | - |
| Contract Manufacturing Share | 65.3% [92] | - | - | 18.7% [92] |
Table 2: Automation ROI Factors in Cell Therapy Manufacturing
| Factor | Impact Level | Timeline | Geographic Relevance |
|---|---|---|---|
| Batch Failure Reduction | High | Short-term (≤ 2 years) | Global [92] |
| Labor Cost Optimization | Medium | Short-term (≤ 2 years) | North America, Europe [92] |
| Regulatory Compliance | High | Medium-term (2-4 years) | North America, Europe [92] |
| Scalability Improvement | High | Long-term (≥ 4 years) | Global [92] |
| Staff Shortage Mitigation | Medium | Medium-term (2-4 years) | Asia-Pacific, North America [92] |
Experimental Workflows
Automated Cell Processing Workflow
AI-Optimized Process Development
Research Reagent Solutions
Table 3: Essential Materials for Autologous Therapy Manufacturing
| Reagent/Material | Function | Cost Optimization Considerations |
|---|---|---|
| Viral Vectors (AAV, Lentiviral) | Gene delivery in gene-modified therapies | Multi-year supplier agreements; explore non-viral alternatives [92] [8] |
| Cell Culture Media | Support cell growth and expansion | AI-optimized formulations to reduce waste and improve yields [94] |
| Cell Separation Matrices | Isolation of target cell populations | Closed-system alternatives to reduce contamination risk [92] |
| Cryopreservation Media | Long-term storage of cell products | Standardized formulations across multiple product types [93] |
| Quality Control Assays | Product safety and potency verification | Automated testing platforms to reduce labor and improve consistency [92] |
| Process Analytics | Monitoring critical quality attributes | Biosensors with AI integration for real-time monitoring [94] |
FAQs: Navigating the Regulatory Landscape
Q1: What are the most critical regulatory challenges in autologous cell therapy manufacturing? The primary regulatory challenges stem from the personalized nature of autologous therapies. Each patient-specific batch must undergo full manufacturing and quality control, creating complex logistics that must comply with stringent Good Manufacturing Practices (GMP) [16] [15]. Key hurdles include managing patient-specific supply chains with strict time constraints, maintaining end-to-end traceability, preventing contamination, and demonstrating consistent product quality despite high variability in starting patient material [1] [68]. Regulatory bodies require robust Chemistry, Manufacturing, and Controls (CMC) documentation throughout this complex process [15].
Q2: How can we reduce manufacturing failure rates while maintaining compliance? Current autologous cell therapy manufacturing has process failure rates between 5-10%, far exceeding typical biopharma standards [68]. Each failed batch costs over $100,000 to manufacture and, more critically, delays treatment for patients who may not have time to wait [68]. To reduce failures while staying compliant:
- Implement closed, automated systems to minimize contamination risk and operator variability [16]
- Establish robust quality control at multiple process stages to catch issues early [53]
- Use GMP-compliant, qualified reagents throughout manufacturing [16]
- Develop comprehensive standard operating procedures for handling exceptions like damaged products [95]
Q3: What regulatory considerations apply to implementing automation? When implementing automation to reduce costs and improve consistency, regulators expect systems to maintain GMP compliance and product quality [16]. Automated equipment must be:
- Closed systems that minimize contamination risks [16]
- Digitally integrated with tools that maintain data integrity (supporting CFR 21 Part 11 compliance) [16]
- Properly validated to demonstrate consistent performance [96]
- Designed for human factors to prevent use errors, as training alone is insufficient to eliminate operational mistakes [96]
Q4: How does biological starting material variability affect regulatory strategy? High variability in donor cells creates unpredictable drug product performance, which regulators recognize as a key challenge [1]. Your regulatory strategy should address this by:
- Developing adaptive manufacturing processes that can normalize biological differences [1]
- Implementing real-time monitoring systems to track critical quality attributes [1]
- Establishing comprehensive characterization of cells throughout manufacturing [53]
- Documenting process controls that manage variability while maintaining product safety and efficacy [68]
Troubleshooting Guides
Contamination Control in Cell Processing
Problem: Microbial contamination during autologous cell manufacturing.
Investigation Steps:
- Determine contamination timing: Classify as early (0-3 days), middle (3-7 days), or late phase (after 7 days) based on culture days when turbidity appears [97]
- Identify contamination source:
- Check cross-contamination risks: Review changeover procedures between patient batches [97]
Resolution Protocols:
- For intrinsic contamination: Enhance donor screening and initial material testing [97]
- For extrinsic contamination: Strengthen environmental monitoring, aseptic technique training, and equipment maintenance [97]
- Implement closed processing systems and automated technologies to reduce human intervention points [16]
Preventive Measures:
- Maintain ISO class 5 biosafety cabinets and ISO class 7 cell processing areas [97]
- Use antibiotic-free media to enable easier contamination detection [97]
- Establish rigorous changeover procedures between patient batches [97]
Supply Chain Failure Management
Problem: Disruption in the patient-specific supply chain compromising product viability.
Investigation Steps:
- Immediate assessment: Determine where in the chain the failure occurred (collection, transport, manufacturing, storage, or final delivery) [95]
- Product impact analysis: Evaluate whether the product can be salvaged or must be destroyed [95]
- Patient status evaluation: Determine if the patient has started lymphodepletion and the clinical consequences of delay [95]
Resolution Protocols:
- Implement backup strategies: Collect and store backup starting material during initial apheresis [95]
- Establish emergency communications: Immediate notification protocols between CDMO, sponsor, and clinical site [95]
- Develop contingency plans: Predetermined pathways for repeat manufacturing when possible [95]
Preventive Measures:
- Real-time tracking systems for materials throughout the supply chain [15]
- Temperature monitoring with electronic alerts for deviations [95]
- Redundant storage of final product in multiple bags to mitigate single-container failure [95]
- Mock run-throughs to test all processes before live implementation [95]
Manufacturing Performance Metrics
Table 1: Cell Therapy Manufacturing Performance Data
| Metric | Current Performance | Industry Target | Data Source |
|---|---|---|---|
| Process failure rate | 5-10% | <1% | [68] |
| Contamination incidence | 0.06% (18 cases out of 29,858 batches) | Not specified | [97] |
| Successful product shipment | 90-97% | >99.9% | [96] |
| Typical batch failure rate in biologics | ~5% | Not applicable | [96] |
Regulatory Testing Requirements
Table 2: Essential Quality Control Testing in Cell Therapy Manufacturing
| Test Type | Methodology | Purpose | Timing |
|---|---|---|---|
| Sterility testing | Culture method using soybean-casein digest (SCD) medium | Detect fungi and bacterial contamination | Final product [97] |
| Mycoplasma detection | Polymerase chain reaction (PCR) method | Identify mycoplasma contamination | Final product [97] |
| Endotoxin testing | Gel-clot method of limulus amebocyte lysate (LAL) assay | Detect endotoxin sensitivity | Final product [97] |
| Viability assessment | Flow cytometry, phenotypic analysis | Determine cell purity and viability | Throughout manufacturing [53] |
| Potency assays | Functional assays | Assess therapeutic functionality | Throughout manufacturing [53] |
Experimental Protocols
Automated Cell Processing Validation Protocol
Purpose: Validate automated cell processing systems for regulatory compliance while reducing manual labor and errors [16].
Materials:
- Gibco CTS Rotea Counterflow Centrifugation System [16]
- Gibco CTS Dynacellect Magnetic Separation System [16]
- Gibco CTS Xenon Electroporation System [16]
- GMP-compliant cell culture reagents [16]
- Patient-derived apheresis material [16]
Methodology:
- System Setup
- Install automated systems in GMP-compliant cleanroom environment
- Integrate with CTS Cellmation software for data integrity and record keeping [16]
Process Transfer
- Map manual process steps to automated unit operations
- Establish critical process parameters for each step [16]
Performance Qualification
Quality Assessment
Regulatory Documentation:
- Define and document Critical Quality Attributes (CQAs) [53]
- Establish and validate critical process parameters [16]
- Document system integration and data integrity measures for 21 CFR Part 11 compliance [16]
Contamination Risk Assessment Protocol
Purpose: Systematically evaluate and mitigate contamination risks in autologous cell processing.
Materials:
- Biosafety cabinets (ISO class 5) [97]
- Cell processing areas (ISO class 7) [97]
- Antibiotic-free culture media [97]
- Environmental monitoring equipment
Methodology:
- Environmental Monitoring
- Establish routine monitoring of air quality, surfaces, and equipment
- Set action limits for microbial counts
Process Simulation
- Perform media fills without cells to validate aseptic processing
- Include all manual operations and maximum holding times
Changeover Validation
- Test cleaning and disinfection procedures between patient batches
- Verify effectiveness against potential contaminants
Operator Training Assessment
- Evaluate aseptic technique competency through regular testing
- Monitor contamination rates by operator
Acceptance Criteria:
- Maintain contamination rates below 0.1% [97]
- No cross-contamination events between parallel processes
- Successful media fill runs with zero contamination
Process Workflow Visualization
Autologous Cell Therapy Regulatory Workflow: This diagram illustrates the end-to-end process for autologous cell therapies, highlighting points requiring regulatory oversight and documentation at each stage.
Research Reagent Solutions
Table 3: Essential GMP-Compliant Reagents for Cell Therapy Manufacturing
| Reagent/Category | Function | Regulatory Considerations |
|---|---|---|
| GMP-grade cell culture media | Supports cell growth and expansion during manufacturing | Must be manufactured under GMP conditions with certificates of analysis [16] |
| Cytokines (IL-2, IL-7, IL-15) | Promotes T-cell expansion and alters phenotype | Require GMP-grade quality with documented purity and potency [53] |
| Cell separation reagents | Isolates target cell populations from apheresis material | Must be closed-system compatible and sterile [16] |
| Cryopreservation agents | Protects cells during freezing and storage | DMSO and other agents require pharmaceutical-grade quality [53] |
| Genetic modification reagents | Enables cell engineering (e.g., viral vectors, electroporation reagents) | Must meet strict safety testing requirements for identity, purity, and potency [53] |
| Activation reagents (anti-CD3/CD28) | Stimulates T-cell activation and expansion | Quality must be consistent across batches with minimal variability [53] |
Risk Mitigation Strategy: This diagram outlines the relationship between major risks in autologous cell therapy manufacturing and targeted solutions that address both compliance and cost reduction objectives.
Conclusion
Reducing manufacturing costs for autologous cell therapies requires a multi-faceted approach that addresses fundamental process limitations while embracing technological innovation. The strategies outlined—from automation and process intensification to supply chain optimization and alternative genetic modification methods—collectively present a viable path toward greater affordability and accessibility. As the field advances, the integration of AI, digital twins, and decentralized manufacturing models will further transform the economic landscape. Success will depend on continued collaboration across industry, academia, and regulatory bodies to standardize processes while maintaining therapeutic efficacy. By implementing these evidence-based strategies, researchers and developers can overcome current cost barriers, ultimately democratizing access to these transformative therapies for patients worldwide while ensuring commercial sustainability.
References
- 1. 2025 cell and gene challenges: Scalability, supply chain ... [https://www.cellgenetherapyreview.com/3975-Featured-Articles/617533-2025-cell-and-gene-challenges-Scalability-supply-chain-and-manufacturing/]
- 2. strategies for more affordable CAR-T cell manufacturing [https://appliedcells.com/affordable-car-t-manufacturing/]
- 3. Interactive Visualization for Patient-to-Patient Comparison [https://pmc.ncbi.nlm.nih.gov/articles/PMC3990763/]
- 4. Cost Analysis of Cell Therapy Manufacture: Autologous ... [https://www.bioprocessintl.com/cell-therapies/cost-analysis-of-cell-therapy-manufacture-autologous-cell-therapies-part-1]
- 5. Cost-effective strategies for CAR-T cell therapy manufacturing [https://pmc.ncbi.nlm.nih.gov/articles/PMC12022644/]
- 6. Driving Down Costs of Autologous Cell Therapy ... [https://www.cellandgene.com/doc/driving-down-costs-of-autologous-cell-therapy-manufacturing-0001]
- 7. Cell & Gene Therapy Quality Control Market Grows at ... [https://www.towardshealthcare.com/insights/cell-and-gene-therapy-quality-control-market-sizing]
- 8. Review Cost-effective strategies for CAR-T cell therapy ... [https://www.sciencedirect.com/science/article/pii/S2950329925000499]
- 9. How reducing labor time can save on your cell therapy ... [https://www.insights.bio/cell-and-gene-therapy-insights/journal/article/2946/How-reducing-labor-time-can-save-on-your-cell-therapy-manufacturing-costs]
- 10. Guide To Viral Vector Production & Development [https://bataviabiosciences.com/guide-to-viral-vector-production-from-bench-to-bedside-faster/]
- 11. How reducing labor time can save on your cell therapy ... [https://www.insights.bio/cell-and-gene-therapy-insights/webinars/450/How-reducing-labor-time-can-save-on-your-cell-therapy-manufacturing-costs]
- 12. Autologous Cell Therapy: Key Challenges and ... [https://www.lek.com/insights/hea/us/ei/autologous-cell-therapy-key-challenges-and-bioprocessing-innovations]
- 13. Overcoming Manufacturing Challenges [https://www.nnit.com/insights/articles/overcoming-manufacturing-challenges-cell-gene-therapies]
- 14. The State of Cell Therapy Manufacturing with the Rise ... [https://theconferenceforum.org/editorial/the-state-of-cell-therapy-manufacturing-with-the-rise-of-approved-products]
- 15. Manufacturing autologous cell therapies [https://www.patheon.com/us/en/insights-resources/blog/autologous-cell-therapy-manufacturing-challenges-and-best-practices.html]
- 16. Guide to Cell Therapy GMP Manufacturing for Autologous ... [https://www.thermofisher.com/blog/behindthebench/guide-to-cell-therapy-gmp-manufacturing-for-autologous-car-t-and-beyond/]
- 17. Cell and gene therapy manufacturing: challenges and ... [https://www.labiotech.eu/in-depth/cell-and-gene-therapy-manufacturing/]
- 18. Cell & Gene Therapy Cold Chain: Ensuring Product Integrity [https://www.cellandgene.com/topic/cell-gene-therapy-cold-chain]
- 19. Managing the Complexity of the Supply Chain for Cell and ... [https://www.marken.com/managing-the-complexity-of-the-supply-chain-for-cell-and-gene-therapies/]
- 20. Cell Therapy CDMO Regulatory Compliance Guide [https://cdmoworld.com/cell-therapy-cdmo-compliance/]
- 21. If You're Gonna Play in Cell Therapy, You've Got to.... [https://biobridgeglobal.org/uncategorized/back-to-the-basics-of-access-autologous-cell-therapy-and-mobile-leukapheresis/]
- 22. 3 Key Bottlenecks in Cell Therapy Supply Chains [https://excellos.com/blog/3-key-bottlenecks-in-cell-therapy-supply-chains/]
- 23. Differences Between Autologous and Allogeneic Cell ... [https://www.patheon.com/us/en/insights-resources/blog/differences-between-autologous-and-allogeneic-cell-therapies.html]
- 24. Mitigation of supply chain challenges in cell therapy ... [https://pubmed.ncbi.nlm.nih.gov/39169677/]
- 25. Cost Analysis of Cell Therapy Manufacture: Autologous ... [https://www.bioprocessintl.com/cell-therapies/cost-analysis-of-cell-therapy-manufacture-autologous-cell-therapies-part-2]
- 26. Closed-Loop Manufacturing Is The Cell Therapy ... [https://www.cellandgene.com/doc/closed-loop-manufacturing-is-the-cell-therapy-revolution-we-need-0001]
- 27. Autologous Cell Therapy Market Size, Growth & Industry ... [https://www.mordorintelligence.com/industry-reports/autologous-cell-therapy-market]
- 28. Cell Therapy Innovations: Reducing Costs to Improve ... [https://resilience.com/blog/cell-therapy-innovations?hsLang=en]
- 29. Autologous Cell Therapy Market Expand at 18.9% CAGR ... [https://www.towardshealthcare.com/insights/autologous-cell-therapy-market-sizing]
- 30. Closed System Automation for Cell Therapy [https://www.thermofisher.com/blog/behindthebench/closed-system-automation-cell-therapy/]
- 31. Fully Automated, Scalable, Cell Therapy Manufacturing [https://www.cellares.com/technology/]
- 32. Solving Cell ’s “Garbage in, Garbage...” | Today's Clinical Lab Therapy [https://www.clinicallab.com/solving-cell-therapy-s-garbage-in-garbage-out-problem-with-automation-26582]
- 33. Closed-system manufacturing of therapeutic NK cells using ... [https://pmc.ncbi.nlm.nih.gov/articles/PMC12238007/]
- 34. iPSC generation to enable Automating photoreceptor autologous ... cell [https://pmc.ncbi.nlm.nih.gov/articles/PMC9976478/]
- 35. Cost-effective strategies for CAR-T cell therapy ... [https://pubmed.ncbi.nlm.nih.gov/40291594/]
- 36. Viral and Non-Viral Systems to Deliver Gene Therapeutics ... [https://pmc.ncbi.nlm.nih.gov/articles/PMC11242246/]
- 37. Faster, Cheaper, Safer, T cell engineering - PMC [https://pmc.ncbi.nlm.nih.gov/articles/PMC3521862/]
- 38. CRISPR Clinical Trials: A 2025 Update [https://innovativegenomics.org/news/crispr-clinical-trials-2025/]
- 39. Optimising and adapting perfusion feeds in serum-free ... [https://pmc.ncbi.nlm.nih.gov/articles/PMC12171161/]
- 40. How to Make Cell Culture Expansion Easy [https://www.labiotech.eu/partner/cell-culture-expansion-biomanufacturing-perfusion/]
- 41. Bioprocess Intensification For Biopharmaceuticals [https://bataviabiosciences.com/bioprocess-intensification-biopharmaceutical-production/]
- 42. Decentralizing Autologous Cell Therapies with ... [https://www.thermofisher.com/blog/behindthebench/decentralizing-autologous-cell-therapies-with-accelerated-manufacturing-workflows/]
- 43. The Evolution of Decentralized Autologous Cell Therapy ... [https://www.healthadvances.com/insights/blog/breaking-barriers-the-evolution-of-decentralized-autologous-cell-therapy-manufacturing]
- 44. Point-Of-Care Manufacturing vs Decentralized ... [https://www.cellandgene.com/doc/point-of-care-manufacturing-vs-decentralized-manufacturing-in-cell-gene-therapies-0001]
- 45. Implementation of a quality management system for ... [https://pmc.ncbi.nlm.nih.gov/articles/PMC12361990/]
- 46. Point-of-care manufacturing of cell therapies [https://www.imec-int.com/en/articles/how-point-care-manufacturing-will-enable-cell-therapies-reach-patients-who-need-them]
- 47. Promises and challenges of a decentralized CAR T-cell ... [https://pmc.ncbi.nlm.nih.gov/articles/PMC11235344/]
- 48. Management of point-of-care testing [https://acutecaretesting.org/en/articles/management-of-pointofcare-testing]
- 49. AI‐Driven Quality Monitoring and Control in Stem Cell Cultures [https://pmc.ncbi.nlm.nih.gov/articles/PMC12336434/]
- 50. R&D Project Spotlight: Developing a smart bioprocessing platform... [https://ct.catapult.org.uk/news/r-d-project-spotlight-developing-a-smart-bioprocessing-platform-integrating-real-time-process-monitoring-and-advanced-process-control-for-autologous-cell-therapy]
- 51. Cell Therapy CMC and Manufacturing - 2025 Archive [https://www.bioprocessingeurope.com/25/cell-therapy-manufacturing]
- 52. AI-Powered Process Optimization: Comparing the Best ... [https://superagi.com/ai-powered-process-optimization-comparing-the-best-workflow-automation-tools-for-business-efficiency/]
- 53. Process Steps in Cell Therapy Manufacturing [https://www.cellandgene.com/topic/cell-therapy-manufacturing]
- 54. Managing Raw Material Variability for Autologous Cell ... [https://www.biopharminternational.com/view/managing-raw-material-variability-for-autologous-cell-therapies]
- 55. PAT strategies and applications for cell therapy processing [https://www.sciencedirect.com/science/article/abs/pii/S2468451122000381]
- 56. Requirement for smart in-process control systems to deliver ... [https://www.insights.bio/cell-and-gene-therapy-insights/journal/article/453/Requirement-for-smart-in-process-control-systems-to-deliver-cell-therapy-processes-fit-for-the-21st-century]
- 57. Best Practices For Raw Material And Supplier ... [https://www.cellandgene.com/doc/best-practices-for-raw-material-and-supplier-management-for-cell-gene-therapy-manufacturing-0001]
- 58. Part 3: Best Practices for Supplier Selection, Qualification, ... [https://www.bioprocessintl.com/single-use/the-role-of-single-use-polymeric-solutions-in-enabling-cell-and-gene-therapy-production-part-3-best-practices-for-supplier-selection-qualification-and-validation-to-ensure-supply-chain-security]
- 59. Raw material considerations for cell therapies [https://www.thermofisher.com/blog/behindthebench/raw-material-considerations-cell-therapy/]
- 60. How to achieve flexible GMP programs for biopharma [https://www.linkedin.com/posts/chrysalisgxp_advancedtherapies-biotech-pharmamanufacturing-activity-7371527892834492416-t_fX]
- 61. What is GMP | Good Manufacturing Practices [https://safetyculture.com/topics/gmp]
- 62. Standardisation is the key to the sustained, rapid and healthy ... [https://pmc.ncbi.nlm.nih.gov/articles/PMC10993161/]
- 63. Cell & Gene Therapy Logistics: Clinical Trial Supply Chain ... [https://intuitionlabs.ai/articles/cell-gene-therapy-logistics-supply-chain]
- 64. Making CAR-T more accessible: rethinking manufacturing ... [https://appliedcells.com/making-car-t-more-accessible-rethinking-manufacturing-economics/]
- 65. Four chain of custody models explained [https://www.circularise.com/blogs/four-chain-of-custody-models-explained]
- 66. 4 Chain of Custody Models in Supply Chain Transparency [https://tracextech.com/chain-of-custody-models/]
- 67. Why is Chain of Custody Important in Logistics? [https://trackonomy.ai/blog/why-is-the-chain-of-custody-important/]
- 68. Navigating cell therapy's maze of risks [https://www.cellgenetherapyreview.com/3975-Featured-Articles/621117-Navigating-a-maze-of-risks/]
- 69. Troubleshooting Cell Culture Contamination [https://www.creative-bioarray.com/support/troubleshooting-cell-culture-contamination-a-comprehensive-guide.htm]
- 70. Contamination Control for Cell Therapy [https://www.biopharminternational.com/view/contamination-control-cell-therapy]
- 71. Guidance in Developing Commercializable Autologous ... [https://pmc.ncbi.nlm.nih.gov/articles/PMC3808202/]
- 72. Bioprocess engineering strategies for autologous human ... [https://www.insights.bio/cell-and-gene-therapy-insights/journal/article/404/Bioprocess-engineering-strategies-for-autologous-human-MSC-based-therapies-one-size-does-not-fit-all]
- 73. Process Development Considerations for Cell Therapy - PMC [https://pmc.ncbi.nlm.nih.gov/articles/PMC4572896/]
- 74. Autologous vs. Allogeneic Cell Therapies: Promises & ... [https://www.genedata.com/resources/learn/details/blog/autologous-allogeneic-cell-therapies]
- 75. Autologous Cell Therapy vs Allogeneic: 7 Key Differences ... [https://int.livhospital.com/autologous-cell-therapy-vs-allogeneic-7-key-differences-benefits/]
- 76. The Cost Of Stem Cell Therapy in 2026 [https://bioinformant.com/cost-of-stem-cell-therapy/]
- 77. How Much Does Stem Cell Therapy Cost in 2025 [https://www.startstemcells.com/stem-cell-therapy-cost.html]
- 78. Stem Cell Therapy Costs by Country: Comparison 2025 [https://masi.eu/en-usd/blogs/longevity-news/stem-cell-therapy-costs-by-country-comparison-2025?srsltid=AfmBOoqDr1L95D5Vnw6QOtIbvtVZ2QeciOp2d7vQFdJutjsxQJxvGZ6_]
- 79. Autologous vs allogenic cell therapy: key differences and ... [https://greenelephantbiotech.com/blog/autologous-vs-allogenic-cell-therapy-key-differences-and-applications/]
- 80. 17 statistics measuring the impact of AR head-count ... [https://resolvepay.com/blog/17-statistics-measuring-the-impact-of-ar-head-count-reduction-via-automation]
- 81. Manual Workflows vs AI Automations: Which is cost-effective? [https://www.smartflow.ie/post/manual-workflows-vs-ai-automations-a-cost-efficiency-breakdown]
- 82. Cost of Manual Labour vs. Automation Infographic [https://www.rnaautomation.com/insight/cost-of-manual-labour-vs-automation-infographic/]
- 83. Trends Shaping the Future of Cell and Gene Therapy ... [https://www.agcbio.com/biopharma-blog/trends-shaping-the-future-of-cell-and-gene-therapy-manufacturing]
- 84. Comparing In-house Vs Outsourced Manufacturing ... [https://www.cellandgene.com/doc/comparing-in-house-vs-outsourced-manufacturing-strategies-for-cgts-0001]
- 85. Scaling Up Cell Therapies Capacity [https://www.biopharminternational.com/view/scaling-up-cell-therapies-capacity]
- 86. Trends Shaping the Future of Cell and Gene Therapy ... [https://www.agcbio.com/biopharma-blog/trends-shaping-the-future-of-cell-and-gene-therapy-manufacturing?hs_amp=true]
- 87. From Outsourcing to Integration: How CDMOs Have ... [https://www.thermofisher.com/blog/biotechnology/from-outsourcing-to-integration-how-cdmos-have-evolved-over-time/]
- 88. Advanced Manufacturing And CDMOs Are Rewriting The ... [https://www.outsourcedpharma.com/doc/advanced-manufacturing-and-cdmos-are-rewriting-the-cgt-cost-equation-0001]
- 89. Contract Manufacturing Outsourcing Trends For Advanced ... [https://www.outsourcedpharma.com/doc/contract-manufacturing-outsourcing-trends-for-advanced-therapies-in-and-beyond-0001]
- 90. Advancing Cell Therapies in Development Through CDMOs [https://www.bioprocessintl.com/cell-therapies/overcoming-scalability-barriers-to-advance-cell-therapies-in-development-cdmos-can-be-the-key-to-success]
- 91. U.S. Cell and Gene Therapy CDMO Market Trends ... [https://finance.yahoo.com/news/u-cell-gene-therapy-cdmo-120700229.html]
- 92. Cell and Gene Therapy Manufacturing Services Market ... [https://www.mordorintelligence.com/industry-reports/cell-and-gene-therapy-manufacturing-services-market]
- 93. Cell Therapy Manufacturing Market Size 2025 to 2034 [https://www.precedenceresearch.com/cell-therapy-manufacturing-market]
- 94. AI-Powered Manufacturing in Cell & Gene Therapy [https://www.agilisium.com/blogs/when-precision-meets-production-ai-in-the-cgt-manufacturing-lifecycle]
- 95. What Really Happens When A Cell Therapy Supply Chain ... [https://www.clinicalsupplyleader.com/doc/what-really-happens-when-a-cell-therapy-supply-chain-fails-0001]
- 96. Failure rate in cell therapy manufacture [https://www.ttp.com/insights/what-failure-rate-are-we-willing-to-accept-in-cell-therapy-manufacture-insights-from-medical-device-development-2]
- 97. Experience of contamination during autologous cell ... [https://pmc.ncbi.nlm.nih.gov/articles/PMC6581811/]