Unlocking Stem Cell Heterogeneity: A Comprehensive Guide to Single-Cell RNA Sequencing Characterization
Single-cell RNA sequencing (scRNA-seq) has revolutionized stem cell research by enabling the decoding of cellular heterogeneity, identification of rare subpopulations, and reconstruction of developmental trajectories at unprecedented resolution.
Unlocking Stem Cell Heterogeneity: A Comprehensive Guide to Single-Cell RNA Sequencing Characterization
Abstract
Single-cell RNA sequencing (scRNA-seq) has revolutionized stem cell research by enabling the decoding of cellular heterogeneity, identification of rare subpopulations, and reconstruction of developmental trajectories at unprecedented resolution. This article provides researchers, scientists, and drug development professionals with a comprehensive framework covering foundational principles, methodological applications, troubleshooting strategies, and validation approaches for scRNA-seq in stem cell characterization. By integrating the latest technological advances with practical implementation guidelines, we address critical challenges from experimental design to data interpretation, offering actionable insights for leveraging this transformative technology in basic research and therapeutic development.
Decoding Cellular Complexity: How scRNA-seq Reveals Stem Cell Heterogeneity and Dynamics
Stem cell heterogeneity represents a fundamental biological characteristic with profound implications for basic research and clinical applications. This variation exists at multiple levels—between donors, tissue sources, subpopulations, and individual cells—significantly impacting the efficacy and reproducibility of stem cell-based therapies [1]. Traditional bulk RNA-sequencing methods, which average gene expression across thousands of cells, obscure these critical differences, masking rare cell populations and continuous transitional states [2]. The advent of single-cell RNA sequencing (scRNA-seq) has revolutionized our capacity to dissect this complexity, providing an unbiased, high-resolution view of the transcriptomic landscape within stem cell populations [3] [4]. This application note details how scRNA-seq methodologies are deployed to characterize stem cell heterogeneity, offering structured protocols, data interpretation frameworks, and resource guidance for researchers.
Experimental Protocols: scRNA-seq for Stem Cell Characterization
Core Workflow: From Cell Culture to Sequencing
The following protocol, adapted from studies on human embryonic stem cells (ESCs) and feeder-free extended pluripotent stem cells (ffEPSCs), outlines a robust pipeline for scRNA-seq analysis [5].
A. Cell Culture and Preparation:
- Maintenance of Human ESCs: Culture H9 human ESCs on Matrigel-coated plates in mTeSR1 medium supplemented with 1% penicillin-streptomycin [5].
- Transition to ffEPSCs: Initiate transition by dissociating single ESCs with Accutase and replating. Replace medium with LCDM-IY, a specialized cocktail containing recombinant human LIF, CHIR99021, (S)-(+)-dimethindene maleate, minocycline hydrochloride, IWR-endo-1, and Y-27632 to promote the extended pluripotent state [5].
- Quality Control: Confirm pluripotency and tri-lineage differentiation potential (adirogenic, osteogenic, chondrogenic) prior to sequencing. Validate surface marker profiles (e.g., positive for CD90, CD73, CD105; negative for CD11b, CD19, CD34, CD45, HLA-DR) using flow cytometry [1].
B. Single-Cell Isolation and Library Construction:
- Cell Dissociation: Manually dissociate cells with care to ensure viability and minimize stress. Filter cells through a 40-μm strainer and perform flow cytometry sorting to remove dead cells and enrich for target populations [5] [1].
- Smart-seq2 Library Preparation: This full-length transcript protocol is recommended for its high sensitivity [5] [3].
- Lysis and Reverse Transcription: Place single cells into a lysis buffer. Perform first-strand cDNA synthesis using UP1 primers with poly(dT) tails to capture mRNA.
- cDNA Amplification: Pre-amplify cDNA via PCR—an initial 20 cycles followed by an additional 9 cycles for sufficient yield.
- Library Generation: Fragment the amplified cDNA using Covaris. Capture 3′ fragments with Dynabeads and perform a second round of PCR using NH2-blocked primers to ensure library integrity. Prepare final libraries using the Kapa Hyper Prep Kit [5].
- Sequencing: Perform paired-end sequencing on an Illumina HiSeq 2000 platform or equivalent [5].
C. Bioinformatic Analysis Pipeline:
- Quality Control & Alignment: Assess raw read quality with FastQC. Align reads to the GRCh38 reference genome using HISAT2. For repeat element analysis, use the T2T (Telomere-to-Telomere) reference genome [5].
- Quantification & Normalization: Generate expression matrices with featureCounts. Normalize data by scaling to 10,000 total counts per cell (cp10k) and log-transform using
ln(cp10k + 1)[5]. - Dimensionality Reduction & Clustering: Using the Seurat package in R, perform Principal Component Analysis (PCA), retain top principal components, and cluster cells with the
FindNeighborsandFindClustersfunctions. Visualize results with Uniform Manifold Approximation and Projection (UMAP) [5]. - Differential Expression & Trajectory Inference: Identify differentially expressed genes (DEGs) between clusters using
FindMarkers(e.g., avg_log2FC > 0.1, p-value < 0.05). Reconstruct developmental trajectories and cellular transitions using pseudotime analysis tools like Monocle [5].
Protocol for Challenging Samples: Single-Nucleus RNA Sequencing (sNuc-seq)
For tissues difficult to dissociate (e.g., neural) or archived samples, sNuc-seq is a powerful alternative [6].
- Nuclei Isolation: Use hypotonic-mechanical or detergent-mechanical cell lysis in cold conditions to release nuclei, followed by centrifugation to separate nuclei from cellular debris. The former offers a controllable balance between yield and purity [6].
- sNuc-seq Platform: Adapt droplet-based methods like Drop-seq for nuclei (DroNc-seq). A microfluidic device encapsulates single nuclei with uniquely barcoded beads. After breakage of droplets and exonuclease treatment, RNA is amplified via PCR for library construction [6].
- Considerations: Commercial platforms may require additional PCR cycles to compensate for lower cDNA yield from nuclei versus whole cells [6].
Quantitative Insights: Dissecting Heterogeneity through Data
scRNA-seq generates quantitative metrics that precisely define stem cell heterogeneity. The table below summarizes key findings from a massive atlas of over 130,000 human mesenchymal stem cells (MSCs) [1].
Table 1: Heterogeneity Metrics in Human Mesenchymal Stem Cells (MSCs)
| Metric | Finding | Biological Significance |
|---|---|---|
| Subpopulations Identified | 7 tissue-specific, 5 conserved | Reveals specialized functional units within the broader MSC population. |
| Primary Heterogeneity Driver | Extracellular Matrix (ECM) genes | ECM contributes significantly to immune regulation, antigen presentation, and senescence. |
| Tissue-Specific Variation | Heterogeneous ECM-associated immune regulation & senescence | Explains inter-donor and intra-tissue variability, impacting therapeutic consistency. |
| Functional Specialization | Umbilical-cord-specific subpopulation had superior immunosuppressive properties. | Informs source selection for cell-based therapies targeting immune disorders. |
Further analysis, such as silhouette scoring, quantifies clustering quality. The score s(i) = [b(i) - a(i)] / max[a(i), b(i)] calculates how well each cell fits within its assigned cluster, where a(i) is the mean intra-cluster distance and b(i) is the mean nearest-cluster distance. Scores near 1 indicate well-defined clusters [5].
Table 2: Common scRNA-seq Protocols and Their Applications in Stem Cell Research
| Protocol | Transcript Coverage | Amplification Method | Key Application in Stem Cell Research |
|---|---|---|---|
| Smart-seq2 [5] [3] | Full-length | PCR | High-resolution analysis of pluripotency transitions; ideal for detecting low-abundance transcripts and splice variants. |
| Drop-Seq [3] | 3'-end | PCR | High-throughput mapping of heterogeneous tissues and tumor microenvironments to identify rare stem cell subpopulations. |
| 10x Genomics [4] | 3'-end | PCR | Large-scale atlas projects (e.g., MSC atlas) profiling hundreds of thousands of cells across multiple tissues and donors. |
| SPLiT-Seq [3] | 3'-end | PCR | Fixed or hard-to-dissociate samples; does not require single-cell isolation, enabling massive scalability. |
The Scientist's Toolkit: Essential Reagent Solutions
Table 3: Key Research Reagents for scRNA-seq in Stem Cell Studies
| Reagent / Kit | Function | Application Example |
|---|---|---|
| mTeSR1 Medium | Maintains human pluripotent stem cells in a primed state of pluripotency. | Culture of human ESCs prior to induction of state transition [5]. |
| LCDM-IY Chemical Cocktail | Induces and maintains the extended pluripotent stem cell (EPSC) state. | Transitioning primed ESCs to a more naive-like, ffEPSC state [5]. |
| TrypLE Express | Enzyme for gentle cell dissociation into single cells. | Passaging and preparing stem cells for single-cell capture, minimizing clumping [1]. |
| Smart-seq2 Reagent Kits | Provides all necessary components for full-length scRNA-seq library prep. | Generating high-sensitivity transcriptome libraries from individual stem cells [5]. |
| Chromium Single Cell 3' Reagent Kits (10x Genomics) | Enables high-throughput, droplet-based single-cell library preparation. | Profiling tens of thousands of cells to construct comprehensive stem cell atlases [1]. |
| Seurat / Monocle R Packages | Comprehensive toolkits for scRNA-seq data analysis, clustering, and trajectory inference. | Computational dissection of heterogeneity, DEG analysis, and pseudotime ordering of stem cells [5]. |
Visualization of Experimental and Analytical Workflows
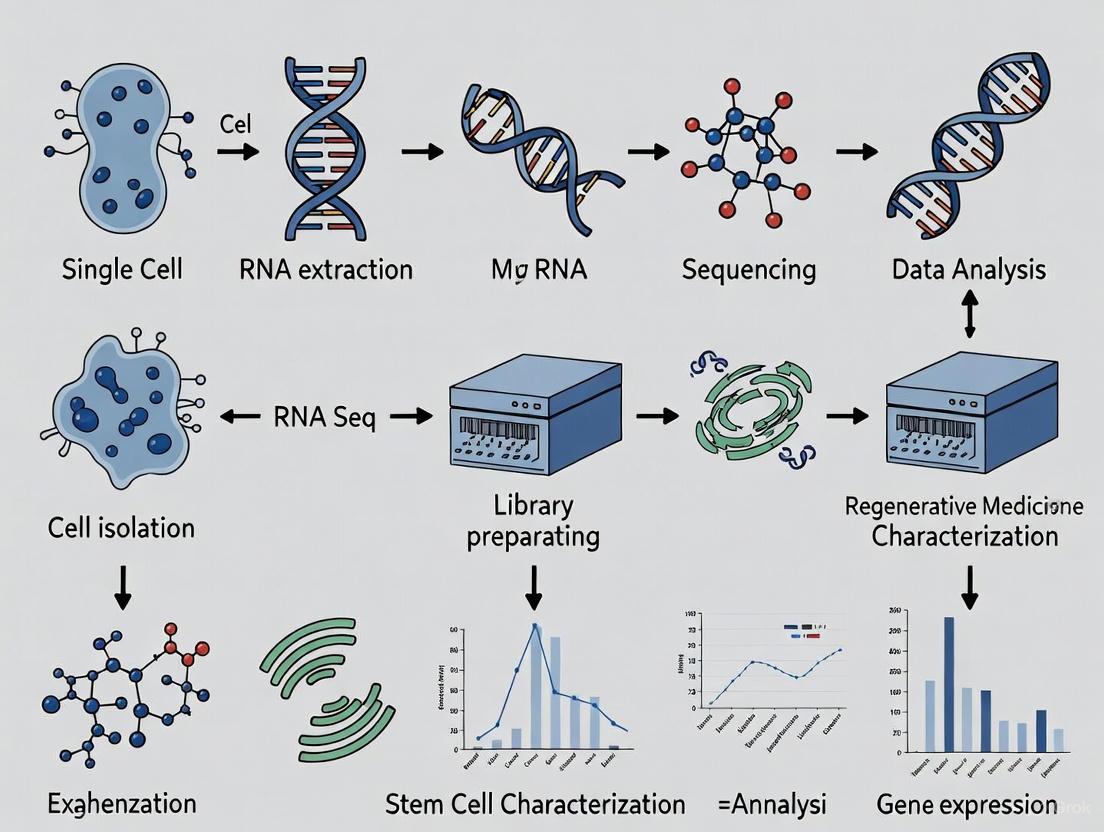
The following diagrams, generated with Graphviz, illustrate the core experimental and analytical processes described in this note.
Diagram 1: Core scRNA-seq workflow for stem cell analysis.
Diagram 2: How scRNA-seq dissects functional heterogeneity.
Single-cell RNA sequencing has transitioned from a niche technology to an indispensable tool for deconvoluting stem cell heterogeneity. By providing detailed protocols, quantitative frameworks, and standardized analytical toolkits, this application note equips researchers to systematically investigate the cellular diversity that underpins stem cell biology. The insights gained are critical for improving the precision, safety, and efficacy of stem cell-based applications in regenerative medicine and drug discovery.
Stem cells, by their very nature, are heterogeneous. A pure-looking population of pluripotent stem cells is, in fact, a complex mixture of individual cells in varying states of self-renewal and differentiation priming. For decades, bulk RNA sequencing was the standard tool for studying their transcriptomes, but it provided only a average gene expression profile across thousands to millions of cells. This averaging effect masks critical cell-to-cell variation, concealing rare subpopulations, continuous transitional states, and the true complexity of cellular dynamics [7] [8]. The inability to resolve this heterogeneity has been a significant bottleneck in understanding the fundamental biology of stem cell fate decisions.
The advent of single-cell RNA sequencing (scRNA-seq) has fundamentally transformed this landscape. Since its first demonstration in 2009, scRNA-seq has evolved into a powerful set of technologies that enable researchers to profile the transcriptomes of individual cells within a population [9] [4]. This shift in resolution allows for the unbiased dissection of cellular heterogeneity, revealing distinct phenotypic cell types and dynamic transitions within a seemingly 'homogeneous' stem cell population. This Application Note details the core principles of scRNA-seq and provides detailed protocols for its application in stem cell biology, demonstrating how it moves characterization beyond the limitations of bulk sequencing.
Core Principle: Resolving Cellular Heterogeneity
The Fundamental Limitation of Bulk RNA-Seq in Stem Cell Research
Bulk RNA-Seq excels at providing a global overview of a tissue's transcriptome and is effective for discovering broadly expressed markers. However, its critical weakness in stem cell studies lies in its inability to resolve differences between individual cells [7]. Key biological information is lost in the averaging process:
- Rare Subpopulations: Transcripts from biologically relevant but rare subpopulations, such as stem cells or circulating tumor cells, may be diluted beyond detection or misinterpreted as low-level expression in all cells [7].
- Dynamic Processes: During critical processes like differentiation, proliferation, and tumorigenesis, cells do not move in lockstep. Bulk RNA-Seq can only capture a blurred average of these asynchronous dynamics, missing the individual trajectories of cells [7].
The Single-Cell Resolution of scRNA-Seq
In contrast, scRNA-seq generates data for individual cells, enabling deep insights into the nuanced distinctions between cells within the same sample [7]. The variation between individual cells can be immense, even when examining the same cellular subpopulation. This is especially true of the transcriptome, a more reactive and dynamic -ome compared to the relative stability of the genome and epigenome [7]. The power of scRNA-seq lies in its ability to:
- Discover Novel and Rare Cell Types: Identify distinct cell types and states without prior knowledge [8] [4].
- Deconstruct Continuous Processes: Map continuous cellular transitions, such as differentiation, using pseudotime trajectory analysis [8] [10].
- Characterize Tumor Microenvironment: Dissect the complex cellular ecosystem of tumors, including cancer stem cells [11].
Table 1: Key Differences Between Bulk RNA-Seq and Single-Cell RNA-Seq
| Feature | Bulk RNA-Seq | Single-Cell RNA-Seq |
|---|---|---|
| Resolution | Population average | Individual cell |
| Heterogeneity | Masks cell-to-cell variation | Reveals and quantifies heterogeneity |
| Rare Cell Detection | Fails to detect rare subpopulations | Capable of identifying rare cell types |
| Primary Output | Consolidated expression profile | Expression matrix (cells x genes) |
| Key Strength | Global profiling, cost-effective for large cohorts | Discovering diversity, mapping trajectories |
| Data Complexity | Lower | High-dimensional, noisy, sparse |
Application Note: Identifying Clinically Relevant Stem Cell Subpopulations
Case Study: Deconstructing Human Induced Pluripotent Stem Cell (hiPSC) Cultures
A landmark study profiling 18,787 individual WTC-CRISPRi human induced pluripotent stem cells (hiPSCs) exemplifies the power of scRNA-seq. The researchers developed an unsupervised high-resolution clustering (UHRC) method to objectively assign cells into subpopulations based on genome-wide transcript levels. This approach identified four transcriptionally distinct subpopulations within the supposedly homogeneous pluripotent culture [10]:
- A core pluripotent population (48.3% of cells)
- A proliferative population (47.8% of cells)
- An early primed for differentiation population (2.8% of cells)
- A late primed for differentiation population (1.1% of cells) [10]
This study highlights that even under optimal culture conditions, standard hiPSC cultures contain a small but significant fraction of cells that have already initiated the departure from the pluripotent state. Bulk RNA-seq would have been entirely blind to these rare, primed subpopulations. The researchers identified four predictor gene sets composed of 165 unique genes that define these specific pluripotency states and developed a machine learning model to accurately classify single cells [10]. This resource provides a high-resolution reference for future studies manipulating pluripotent states.
Case Study: Linking Cancer Stemness to Immunotherapy Resistance
scRNA-seq is also revolutionizing the understanding of stemness in cancer. An integrated analysis of 34 scRNA-seq datasets, comprising 345 patients and 663,760 cells across 17 cancer types, was used to investigate the role of cancer stemness in immune checkpoint inhibitor (ICI) resistance [11].
Researchers used the computational framework CytoTRACE to characterize cancer stemness at single-cell resolution. Analysis of scRNA-seq data from ICI-treated patients revealed that higher cancer stemness was significantly associated with ICI resistance in melanoma and basal cell carcinoma. This finding was validated using a novel stemness signature (Stem.Sig) developed from the pan-cancer scRNA-seq data, which also showed a negative association with anti-tumor immunity in large-scale bulk transcriptomic data [11]. This study provides direct clinical evidence linking stemness to therapy resistance, a connection that was previously difficult to establish, and showcases how scRNA-seq can generate biomarkers with significant predictive power for patient stratification.
Table 2: Quantitative Findings from Key scRNA-seq Studies in Stem Cells
| Study Focus | Number of Cells Sequenced | Key Quantitative Finding | Clinical/Biological Implication |
|---|---|---|---|
| hiPSC Heterogeneity [10] | 18,787 | 48.3% core pluripotent, 47.8% proliferative, 2.8% early primed, 1.1% late primed | Standard hiPSC cultures contain rare cells spontaneously exiting pluripotency. |
| Cancer Stemness & Immunotherapy [11] | 663,760 (across 34 datasets) | Stemness signature (Stem.Sig) predicted ICI response with AUC of 0.71 in validation sets. | Stemness is a major driver of therapy resistance; a potential biomarker for patient selection. |
| Cortical Cell Atlas [8] | 3,005 | Identification of 47 molecularly distinct subclasses of cells from mouse brain. | Demonstrates the power of scRNA-seq to deconstruct complex tissues into a catalog of cell types. |
Experimental Protocols for scRNA-seq in Stem Cell Research
Comprehensive Workflow for Single-Cell RNA Sequencing
The following diagram illustrates the generalized end-to-end workflow for a scRNA-seq experiment, from sample preparation to data interpretation.
Detailed Methodologies
Sample Preparation and Single-Cell Isolation
The initial and most critical wet-lab step is obtaining a high-quality single-cell suspension from your stem cell population.
- Objective: To extract viable, individual cells from stem cell cultures or complex tissues without inducing stress that alters the transcriptome.
- Protocol Details:
- Tissue Dissociation: For tissue-derived stem cells (e.g., from biopsies), use a combination of gentle mechanical mincing and enzymatic digestion (e.g., collagenase, trypsin) tailored to the specific tissue. Balance cell yield with viability; harsh conditions can stress cells and affect gene expression [7].
- Cell Culture Handling: For adherent stem cell cultures (e.g., hiPSCs), standard enzymatic passaging (e.g., Accutase) is often sufficient. Quench the enzyme quickly and centrifuge to pellet cells.
- Washing and Resuspension: Wash cells in a cold, protein-rich buffer like PBS with 0.04% BSA to prevent re-aggregation and adhesion to tubes.
- Viability and Concentration Assessment: Use Trypan Blue staining or an automated cell counter to assess viability (aim for >80%) and calculate concentration.
- Cell Isolation Methods:
- Microfluidic Droplet-Based (High-Throughput): e.g., 10x Genomics, Drop-seq. Cells are encapsulated into nanoliter droplets with barcoded beads. Recommended for profiling hundreds to millions of cells to explore population heterogeneity [7] [8] [4].
- Fluidics-Based (Low-Throughput): e.g., Fluidigm C1. Cells are captured in microfluidic chambers. Ideal for processing dozens to a few hundred cells with higher sequencing depth, suitable for focused studies on a small number of cells [7] [8].
- Single Nucleus RNA-seq (snRNA-seq): For tissues that are difficult to dissociate (e.g., frozen samples, fragile cells). Nuclei are isolated instead of whole cells, bypassing the need for intact membranes [7] [4].
- Critical Considerations:
- Work quickly on ice to minimize transcriptional changes.
- Filter the suspension through a flow cytometry-compatible strainer (e.g., 35-40 µm) to remove cell clumps and debris.
- Include viability dyes during flow sorting if used, to exclude dead cells.
Molecular Barcoding, Amplification, and Library Prep
This step assigns a unique cellular identity to the RNA from each individual cell.
- Objective: To reverse-transcribe captured mRNA into cDNA, amplify it, and prepare sequencing libraries while preserving the single-cell origin of each transcript.
- Protocol Details:
- Cell Lysis and RNA Capture: Within each droplet or chamber, the cell is lysed, and mRNA molecules are released and captured by poly(dT) oligonucleotides on the beads [4].
- Reverse Transcription and Barcoding: The poly(dT) primers contain several key elements:
- A Cell Barcode: A unique DNA sequence that tags every mRNA molecule from the same cell.
- A Unique Molecular Identifier (UMI): A random sequence that uniquely labels each individual mRNA molecule, allowing for accurate quantification and correction of PCR amplification biases [8] [4].
- The poly(dT) sequence for hybridization. Reverse transcription creates barcoded cDNA.
- cDNA Amplification: The cDNA is amplified via PCR to generate sufficient material for library construction. Some older methods use in vitro transcription (IVT) for linear amplification [4].
- Library Preparation: The amplified cDNA is fragmented, and sequencing adapters (e.g., Illumina P5/P7) are ligated. The final library is purified and quantified by qPCR or bioanalyzer before sequencing [4].
- Critical Considerations: The use of UMIs is essential for accurate digital counting of transcripts and should be a standard requirement in your chosen protocol.
Data Analysis Workflow
The analysis of scRNA-seq data requires specialized computational tools to handle its high-dimensional and sparse nature.
- Objective: To process raw sequencing data into interpretable results that reveal cell types, states, and functions.
- Protocol Details (using tools like Seurat or Scanpy):
- Preprocessing & Quality Control (QC):
- Raw Data Demultiplexing: Use tools like
Cell Ranger(10x Genomics) orKallisto/bustoolsto demultiplex raw sequencing data, align reads to a reference genome, and generate a cell-by-gene count matrix [12]. - QC Filtering: Filter out low-quality cells using thresholds for:
- Number of genes detected per cell (
min.features = 50) - Total UMI counts per cell (remove extremes suggesting doublets or empty droplets)
- Percentage of mitochondrial reads (high percentage indicates stressed/dying cells) [12].
- Number of genes detected per cell (
- Raw Data Demultiplexing: Use tools like
- Normalization and Harmonization:
- Normalization: Normalize counts to account for varying sequencing depth per cell (e.g., log normalization or SCTransform in Seurat) [12].
- Harmonization: If multiple samples/batches are combined, apply batch correction algorithms (e.g., Harmony, Seurat CCA) to remove technical variation while preserving biological differences [12].
- Dimensionality Reduction and Clustering:
- Feature Selection: Identify highly variable genes that drive heterogeneity.
- Principal Component Analysis (PCA): Perform linear dimensionality reduction.
- Clustering: Use graph-based clustering (e.g., Louvain algorithm) on PCA components to group transcriptionally similar cells. This unbiasedly identifies distinct cell subpopulations [8] [12].
- Visualization: Project cells into 2D space using non-linear methods like t-SNE or UMAP to visualize clusters [13].
- Downstream Analysis & Cell Annotation:
- Differential Expression (DE): Identify marker genes for each cluster using methods like MAST or NEBULA [12].
- Cell Type Annotation: Manually annotate clusters based on canonical marker genes or use automated tools (e.g., Azimuth, scRef) to transfer labels from reference datasets [12].
- Trajectory Inference: Use algorithms like Monocle or Waterfall to order cells along a pseudotime trajectory, modeling processes like differentiation [8].
- Preprocessing & Quality Control (QC):
The Scientist's Toolkit: Essential Reagents and Computational Tools
Table 3: Research Reagent Solutions and Computational Tools for scRNA-seq
| Item Name / Platform | Function / Purpose | Specific Example(s) |
|---|---|---|
| Commercial scRNA-seq Kits | All-in-one reagents for cell lysis, barcoding, RT, amplification, and library prep. | Illumina Single Cell 3' RNA Prep kit; Parse Biosciences kits [7] [13]. |
| Microfluidic Controller & Chips | Hardware for partitioning individual cells into droplets or nanowell arrays. | 10x Genomics Chromium Controller; Fluidigm C1 System [7] [4]. |
| Barcoded Beads | Microgels containing cell-barcode and UMI primers for mRNA capture in droplets. | 10x Genomics Barcoded Gel Beads [8] [4]. |
| Viability Staining Dye | To distinguish and remove dead cells during cell sorting. | DAPI, Propidium Iodide (PI). |
| Analysis Software (No-Code) | User-friendly platforms for end-to-end analysis without programming. | Nygen, Partek Flow, BBrowserX [13]. |
| Analysis Packages (Code-Based) | Flexible, open-source programming frameworks for custom analysis. | Seurat (R), Scanpy (Python) [12]. |
| Trajectory Analysis Tools | To infer pseudotemporal ordering of cells along a biological process. | Monocle, Waterfall [8]. |
Single-cell RNA sequencing is no longer a niche technology but a cornerstone of modern stem cell biology. By enabling the unbiased characterization of cellular heterogeneity, it has transformed our understanding of pluripotency, differentiation, and disease mechanisms. The protocols and tools outlined in this Application Note provide a roadmap for researchers to move beyond the averaging limitations of bulk sequencing. As scRNA-seq technologies continue to evolve, becoming more accessible and integrated with other omics modalities, they will undoubtedly continue to pave the way for novel discoveries in basic developmental biology and the advancement of regenerative medicine.
Single-cell RNA sequencing (scRNA-seq) has revolutionized stem cell research by enabling the deconvolution of cellular heterogeneity, investigation of lineage priming, and mapping of developmental trajectories at unprecedented resolution. Unlike bulk RNA-seq, which provides averaged transcriptomic profiles, scRNA-seq captures the unique gene expression patterns of individual cells, revealing rare subpopulations and dynamic state transitions that are critical for understanding stem cell biology, differentiation, and reprogramming. This application note details key protocols and methodologies for leveraging scRNA-seq to address fundamental questions in stem cell characterization, with a focus on identifying rare stem cell populations, elucidating multilineage priming, and reconstructing developmental pathways.
Identifying Rare Stem Cell Subpopulations
scRNA-seq is particularly powerful for discovering and characterizing rare stem cell populations that are often masked in bulk analyses but may possess critical functional properties.
Key Experimental Findings
Table 1: Case Studies of Rare Stem Cell Subpopulation Identification Using scRNA-seq
| Stem Cell Type | Rare Subpopulation | Identifying Markers | Functional Significance | Reference |
|---|---|---|---|---|
| Human Dental Pulp Stem Cells (hDPSCs) | MCAM(+)JAG1(+)PDGFRA(-) | MCAM, JAG1, NOTCH3, THY1 | Maintains transcriptional profile of fresh isolates; enhanced osteogenic, chondrogenic, and adipogenic differentiation potential | [14] |
| Human Thymic Progenitors | CD34+CD7- (Thy1) | CD34, CD7 (negative), stem cell-like genes | Earliest thymic progenitors with multilineage priming and T-cell specification potential | [15] |
| Human Thymic Progenitors | Plasmacytoid Dendritic-primed | Specific transcriptional priming | Revealed intrathymic dendritic cell specification pathway | [15] |
| Bone Marrow-derived MSCs | Multiple primed subpopulations | Variable expression of lineage-specific genes | Distinct profiles of osteogenic, chondrogenic, and adipogenic priming | [16] |
Experimental Protocol: Identification of Rare hDPSC Subpopulations
Objective: To identify and characterize rare subpopulations within monolayer-cultured human dental pulp stem cells that maintain native transcriptional profiles.
Workflow:
- Tissue Dissociation: Fresh human dental pulp is dissected and dissociated into single-cell suspensions using enzymatic digestion (collagenase/dispase)
- Cell Processing: Both freshly isolated and 10-day monolayer-cultured hDPSCs are processed for scRNA-seq
- scRNA-seq Library Preparation: Use 10x Genomics Chromium platform for high-throughput single-cell capture and library preparation
- Sequencing: Sequence libraries to a depth of >50,000 reads per cell using Illumina platform
- Bioinformatic Analysis:
- Cluster cells using Seurat with principal component analysis and harmony batch correction
- Identify differentially expressed genes between clusters
- Perform RNA velocity analysis to predict developmental trajectories
- Use SingleR package for cell type annotation against reference datasets
Key Technical Considerations: Include cell cycle regression in analysis to minimize confounding effects of proliferation states [14]. For rare population identification, sequence a minimum of 10,000 cells to ensure adequate representation of minority subsets.
Investigating Lineage Priming in Stem Cells
Lineage priming refers to the phenomenon where stem cells simultaneously express low levels of genes associated with multiple differentiation pathways before commitment to a specific lineage.
Key Experimental Findings
Table 2: Evidence of Multilineage Priming in Stem Cells from scRNA-seq Studies
| Stem Cell System | Evidence of Priming | Technical Approach | Key Insights | Reference |
|---|---|---|---|---|
| Bone Marrow-derived MSCs | Co-expression of osteogenic, chondrogenic, and adipogenic lineage genes in individual cells | Full-transcript scRNA-seq (Fluidigm C1) | Individual MSCs show biased priming toward specific lineages while maintaining multipotency | [16] |
| Human Thymopoiesis | Multilineage priming in CD34+ progenitors followed by gradual T-cell commitment | droplet-based scRNA-seq (10x Genomics, inDrop) | CD2 expression defines T-cell commitment stages; loss of B-cell potential precedes myeloid potential | [15] |
| Mouse Hematopoiesis | Progenitor cell lineage priming | CellTag-multi multi-omic lineage tracing | Early chromatin accessibility changes predict differentiation outcome | [17] |
Experimental Protocol: Assessing Multilineage Priming in MSCs
Objective: To characterize the heterogeneity of lineage priming in individual bone marrow-derived mesenchymal stem cells.
Workflow:
- Single-Cell Isolation: Use Fluidigm C1 system for capture of individual MSCs (17-25 μm chip)
- cDNA Synthesis: Prepare cDNA from individual cells using SMARTer Ultra Low RNA kit with included RNA spike-in controls
- Library Preparation: Construct sequencing libraries using Illumina Nextera XT kit
- Sequencing: Sequence on Illumina MiSeq with 75bp paired-end reads, targeting 18-22 million reads per cell
- Data Analysis:
- Align reads to reference genome using TopHat2
- Quantify gene expression using Cufflinks
- Identify expression of lineage-specific genes in individual cells (osteogenic: RUNX2, SP7; adipogenic: PPARG, CEBPA; chondrogenic: SOX9, ACAN)
- Perform principal component analysis to visualize heterogeneity in priming states
Key Technical Considerations: Include control cell types (e.g., HL-1 cardiomyocytes) in the same Fluidigm C1 run to assess technical variability. Use spike-in RNAs (ERCC or Sequins) to normalize for technical artifacts and enable quantitative comparisons between cells [16].
Mapping Developmental Transitions
scRNA-seq enables the reconstruction of developmental trajectories and identification of key transcriptional switches during stem cell differentiation and reprogramming.
Key Experimental Findings
- Human Thymopoiesis: scRNA-seq revealed a continuous differentiation trajectory from CD34+CD7- progenitors to committed T-cell precursors, identifying CD2 as a key marker defining commitment stages [15]
- Mouse Kidney Development: Full-transcript length scRNA-seq identified splice isoform switching during mesenchymal-to-epithelial transition (MET) and revealed splicing regulators (Esrp1/2, Rbfox1/2) driving this transition [18]
- Direct Reprogramming: CellTag-multi multi-omic lineage tracing identified early gene regulatory changes determining reprogramming outcomes of fibroblasts to endoderm progenitors, revealing Zfp281 as a regulator biasing cells toward off-target mesenchymal fate [17]
Experimental Protocol: Multi-omic Lineage Tracing with CellTag-Multi
Objective: To simultaneously track cell lineage and transcriptional/epigenomic changes during stem cell differentiation or reprogramming.
Workflow:
- CellTagging: Lentivirally deliver CellTag libraries (complexity ~80,000 barcodes) to progenitor cells with multiplicity of infection (MOI) of 2-3
- Differentiation/Reprogramming: Induce differentiation or reprogramming following standard protocols for your system
- Multi-omic Profiling:
- scRNA-seq: Process cells using 10x Genomics Chromium Single Cell 3' Reagent Kit
- scATAC-seq: Isolate nuclei and process using modified CellTag-multi protocol with in situ reverse transcription for CellTag capture
- Sequencing: Sequence libraries appropriately for each modality
- Data Integration:
- Process CellTag data with error correction and allowlisting
- Integrate clonal information with transcriptional and chromatin accessibility profiles
- Perform state-fate analysis to link early progenitor states to differentiation outcomes
Key Technical Considerations: The modified scATAC-seq protocol increases CellTag capture by >50,000-fold compared to standard protocols. For optimal results, perform sequential rounds of CellTagging at key timepoints to build multilevel lineage trees [17].
The Scientist's Toolkit: Essential Research Reagents and Solutions
Table 3: Key Reagents and Tools for scRNA-seq Studies of Stem Cells
| Reagent/Tool | Function | Example Products | Application Notes |
|---|---|---|---|
| Single-Cell Isolation Platform | Partitioning individual cells for sequencing | Fluidigm C1, 10x Genomics Chromium, Drop-Seq | 10x Chromium enables higher throughput; Fluidigm C1 provides full-transcript coverage |
| CellTag/Multiplexing Barcodes | Lineage tracing and sample multiplexing | CellTag libraries, MULTI-Seq barcodes | Complex barcode libraries (>80,000) reduce homoplasy in lineage tracing |
| scRNA-seq Library Prep Kit | cDNA synthesis and library construction | SMARTer Ultra Low RNA Kit, 10x Chromium Single Cell 3' Reagent Kit | SMARTer technology enables full-transcript coverage; 10x kit optimized for high throughput |
| Spike-in Controls | Quality control and normalization | ERCC RNA Spike-In Mix, Sequins | Essential for technical variance normalization and quantitative comparisons |
| Cell Viability Stains | Identification of live cells for sequencing | DEAD cell viability assays, DAPI exclusion | Critical for ensuring high-quality RNA from intact cells |
| Bioinformatic Tools | Data analysis and visualization | Seurat, Monocle, SCANPY, Harmony | Seurat widely used for clustering; Monocle for trajectory inference; Harmony for batch correction |
scRNA-seq technologies have fundamentally transformed our understanding of stem cell biology by revealing the complexity and dynamics of stem cell populations at single-cell resolution. The applications detailed here—identifying rare functional subpopulations, characterizing multilineage priming, and reconstructing developmental trajectories—provide a framework for leveraging these powerful approaches in stem cell research. As multi-omic technologies continue to evolve, integrating transcriptional data with epigenetic, proteomic, and spatial information will further enhance our ability to decipher the molecular logic of stem cell fate decisions, with significant implications for regenerative medicine, disease modeling, and therapeutic development.
Single-cell RNA sequencing (scRNA-seq) has revolutionized stem cell research by enabling the dissection of cellular heterogeneity and the characterization of rare subpopulations at unprecedented resolution [19]. Since its conceptual breakthrough in 2009, scRNA-seq technology has evolved rapidly, with significant advancements in throughput, cost reduction, and computational analytical capabilities [19] [4]. In stem cell biology, this technology has become indispensable for unraveling complex transcriptional landscapes, identifying novel stem cell subtypes, mapping developmental trajectories, and understanding the molecular mechanisms governing self-renewal and differentiation [20] [21]. The integration of machine learning and multi-omics approaches is further accelerating discoveries in this field, paving the way for enhanced regenerative medicine applications and personalized therapeutic strategies [21] [22].
Bibliometric Analysis of scRNA-seq in Stem Cell Research
Global Research Output and Trends
Bibliometric analyses reveal the rapid expansion and evolving landscape of scRNA-seq applications in biomedical research, with stem cell studies representing a significant proportion of this growth.
Table 1: Global Research Contributions in scRNA-seq and Stem Cell Research
| Country/Region | Publication Volume | Citation Impact | Key Research Institutions |
|---|---|---|---|
| China | Leading output (54.8%) | Consistent annual growth | Chinese Academy of Sciences, Shanghai Jiao Tong University, China Medical University |
| United States | Second highest output | H-index 84, 37,135 total citations | Harvard Medical School, Mayo Clinic |
| European Union | Moderate output | Strong collaborative networks | Multiple institutions across Italy, Germany, France |
| Other Regions | Growing contribution | Emerging presence | Institutions in Japan, South Korea, Australia |
China and the United States dominate the research output, collectively contributing approximately 65% of publications in this interdisciplinary field [23] [22]. China leads in publication volume (54.8%), while the United States demonstrates superior academic influence as measured by H-index (84) and total citations (37,135) [22]. The Chinese Academy of Sciences and Harvard University serve as core collaboration hubs, with international cooperation networks primarily featuring US-China collaboration [22].
Research hotspots have transitioned from fundamental algorithm development to clinical applications, particularly in tumor immune microenvironment analysis, stem cell therapy optimization, and rare cell population identification [22] [24]. Keyword clustering analysis reveals four major thematic concentrations: gene expression profiling, immunotherapy applications, bioinformatics tool development, and inflammation-related research [22].
Disease-specific Focus Areas
Table 2: Primary Disease Applications of scRNA-seq in Stem Cell Research
| Disease Area | Research Focus | Key Findings |
|---|---|---|
| Kidney Diseases | Mesenchymal stem cells, acute kidney injury models | Cellular heterogeneity mapping, therapeutic mechanism identification [23] [24] |
| Hematologic Disorders | Hematopoietic stem cell (HSC) differentiation, lineage commitment | Transcriptional regulation of self-renewal, HSC subpopulation identification [21] |
| Neurological Diseases | Glioblastoma stem cells, neural differentiation | Rare "neoplastic-stemness" subpopulation characterization [25] |
| Dental & Craniofacial Disorders | Dental pulp stem cells (DPSCs) | MCAM(+)JAG(+)PDGFRA(−) subpopulation with enhanced regenerative capacity [20] |
The application of scRNA-seq in kidney disease research has identified 1,210 publications between 2015-2024, with major contributions from Harvard Medical School, Sun Yat-sen University, and Shanghai Jiao Tong University [23]. Similarly, stem cell therapy for kidney disease encompassed 1,874 articles from 2015-2024, demonstrating a steady increase in annual publications with particularly high output in recent years [24].
Experimental Protocols and Methodologies
Standardized scRNA-seq Workflow
The fundamental scRNA-seq workflow involves several critical steps that must be optimized for stem cell applications to preserve their delicate transcriptional states.
Sample Preparation and Cell Isolation The initial stage involves extracting viable single cells from stem cell populations or complex tissues. For delicate stem cell populations, dissociation-induced stress responses must be minimized. Studies confirm that protease dissociation at 37°C can induce artificial expression of stress genes, leading to inaccurate cell type identification [19]. Tissue dissociation at 4°C has been suggested to minimize isolation procedure-induced gene expression changes [19]. For tissues that are difficult to dissociate or when working with frozen samples, single-nucleus RNA sequencing (snRNA-seq) provides a valuable alternative that minimizes artificial transcriptional stress responses [19].
Single-cell Capture and Barcoding High-throughput scRNA-seq platforms utilize microfluidic-based approaches to capture individual cells in nanoliter droplets containing barcoded beads. Each transcript from a single cell is uniquely labeled with a cellular barcode during reverse transcription, enabling pooling of thousands of cells while maintaining transcriptome individuality [19] [4]. The 10x Genomics Chromium system represents one of the most widely used platforms for stem cell characterization due to its high cell throughput and robust performance [19].
Library Preparation and Sequencing Following cell lysis and barcoded reverse transcription, cDNA amplification occurs via polymerase chain reaction (PCR) or in vitro transcription (IVT) [19] [4]. PCR-based amplification is utilized in protocols such as Smart-seq2, Drop-seq, and 10x Genomics, while IVT is employed in CEL-seq and MARS-Seq [19]. To address amplification biases, unique molecular identifiers (UMIs) are incorporated during reverse transcription to barcode individual mRNA molecules, significantly enhancing quantitative accuracy by correcting for PCR amplification biases [19] [4].
Stem Cell-Specific Methodological Considerations
Stem cells present unique challenges for scRNA-seq due to their heterogeneity, rarity, and sensitivity to microenvironmental cues. Specialized protocols have been developed to address these challenges:
Preserving Stem Cell States For hematopoietic stem cells (HSCs), which reside primarily in quiescent states, rapid processing and minimal ex vivo manipulation are critical to prevent activation artifacts [21]. Intracellular staining for surface markers combined with fluorescence-activated cell sorting (FACS) enables isolation of highly purified HSC populations while preserving RNA integrity [21].
Handling Low Input Material Rare stem cell populations often yield limited starting material. Full-length transcript protocols such as Smart-seq2 provide enhanced sensitivity for detecting low-abundance transcripts, making them suitable for characterizing rare stem cell subtypes [4]. Modified protocols incorporating terminal repair principles improve coverage uniformity and detection efficiency [19].
Multi-omics Integration Combining scRNA-seq with other single-cell modalities (scATAC-seq, CITE-seq) provides complementary information about regulatory mechanisms governing stem cell fate decisions [21]. Computational integration of these datasets enables reconstruction of gene regulatory networks and identification of key transcription factors driving stem cell differentiation [21].
Computational Analysis Framework
Essential Bioinformatics Tools
The analysis of scRNA-seq data from stem cells requires specialized computational tools tailored to address questions of cellular heterogeneity, developmental trajectories, and regulatory networks.
Table 3: Computational Tools for scRNA-seq Analysis in Stem Cell Research
| Analytical Task | Tool Options | Stem Cell-Specific Applications |
|---|---|---|
| Quality Control & Preprocessing | FastQC, CellRanger | Filtering low-quality cells, doublet detection in rare stem populations |
| Dimensionality Reduction & Clustering | Seurat, SCANPY | Identification of novel stem cell subtypes, cellular heterogeneity mapping |
| Trajectory Inference | Monocle, PAGA | Reconstruction of stem cell differentiation pathways, lineage commitment |
| Gene Regulatory Network Analysis | SCENIC, GENIE3 | Inference of transcription factors governing stem cell fate decisions |
| Cell-Cell Communication | CellChat, NicheNet | Analysis of stem cell niche interactions, paracrine signaling |
Machine Learning Applications
Machine learning has emerged as a core computational approach for analyzing single-cell transcriptomics data from stem cells [22]. Key applications include:
Cell Type Identification and Classification Supervised learning approaches, including random forest and support vector machines, enable automated annotation of stem cell subtypes based on reference datasets [22]. Deep learning models such as scANVI and scVI leverage neural network architectures to enhance classification accuracy, particularly for rare or transitional stem cell states [22].
Dimensionality Reduction and Visualization Non-linear dimensionality reduction techniques like UMAP and t-SNE are essential for visualizing high-dimensional stem cell data in two or three dimensions [22]. These approaches reveal inherent structures in the data, enabling researchers to identify novel stem cell subpopulations and transitional states during differentiation [22].
Trajectory Inference and Pseudotemporal Ordering Machine learning algorithms such as TIGON employ deep learning frameworks to reconstruct developmental trajectories from snapshots of stem cell populations [22]. These methods order cells along pseudotemporal axes, enabling the identification of key transcriptional switches and branch points in stem cell differentiation pathways [22].
Research Reagent Solutions
Table 4: Essential Research Reagents for scRNA-seq in Stem Cell Studies
| Reagent Category | Specific Examples | Function in scRNA-seq Workflow |
|---|---|---|
| Cell Dissociation Kits | Gentle Cell Dissociation Enzyme, Accutase | Tissue dissociation while preserving cell viability and RNA integrity |
| Cell Viability Stains | Propidium Iodide, DAPI, Calcein AM | Identification and exclusion of dead cells to reduce background noise |
| Surface Marker Antibodies | CD34, CD133, CD90, CD105, CD73 | Fluorescence-activated cell sorting (FACS) of specific stem cell populations |
| Barcoded Beads | 10x Genomics Gel Beads, Drop-seq Beads | Cellular barcoding for single-cell transcriptome identification |
| Reverse Transcriptase | Maxima H-, SmartScribe | High-efficiency cDNA synthesis with template-switching capability |
| Library Preparation Kits | Nextera XT, SMARTer | Construction of sequencing-ready libraries from amplified cDNA |
| Sample Multiplexing | Cell Multiplexing Oligos (CMO) | Sample barcoding to enable pooling and reduce batch effects |
Signaling Pathways and Molecular Mechanisms
scRNA-seq studies have identified critical signaling pathways and molecular mechanisms governing stem cell behavior across various biological systems.
Dental Pulp Stem Cell Regulation
In human dental pulp stem cells (hDPSCs), scRNA-seq revealed a specialized perivascular subpopulation characterized by MCAM(+)JAG(+)PDGFRA(−) expression that maintains enhanced differentiation capacity after monolayer expansion [20]. This subpopulation uniquely located in the perivascular region of human dental pulp tissue and maintained transcriptional characteristics most similar to freshly isolated hDPSCs [20]. Functional analyses demonstrated that MCAM(+)JAG(+)PDGFRA(−) hDPSCs exhibited higher proliferation capacity and enhanced in vitro multilineage differentiation potentials (osteogenic, chondrogenic, and adipogenic) compared to PDGFRA(+) subpopulations [20].
Hematopoietic Stem Cell Regulation
scRNA-seq analyses of hematopoietic stem cells (HSCs) have revealed complex regulatory networks controlled by key transcription factors including PU.1, GATA2, LMO2, and MYB [21]. These factors operate within gene regulatory networks that balance self-renewal and lineage commitment decisions [21]. Studies utilizing scRNA-seq have identified distinct HSC subpopulations with transcriptional signatures linked to quiescence, immune activation, and megakaryocyte-erythroid lineage bias [21].
Cancer Stem Cell Pathways
In glioblastoma multiforme, scRNA-seq analysis using InfoScan identified a rare "neoplastic-stemness" subpopulation exhibiting cancer stem cell-like features [25]. This subpopulation was regulated by tumor-associated macrophages (TAMs) secreting SPP1, which binds to CD44 on neoplastic-stemness cells, activating the PI3K/AKT pathway and driving lncRNA transcription to promote metastasis [25]. Drug sensitivity assays indicated that these neoplastic-stemness cells were sensitive to omipalisib, a PI3K inhibitor, highlighting a potential therapeutic target identified through scRNA-seq analysis [25].
The integration of scRNA-seq with emerging technologies represents the next frontier in stem cell research. Spatial transcriptomics approaches are bridging the gap between cellular identity and tissue localization, providing critical insights into stem cell niches [19] [26]. Multi-omics integrations combining scRNA-seq with epigenomic, proteomic, and metabolomic data are enabling comprehensive views of stem cell regulation [21]. The application of CRISPR/Cas9 gene editing in conjunction with scRNA-seq facilitates functional validation of identified regulatory mechanisms [26].
Machine learning and artificial intelligence are increasingly driving the analysis and interpretation of scRNA-seq data from stem cells [22]. Future developments will likely focus on enhancing model generalizability, improving algorithm interpretability, and integrating multi-omics datasets [22]. These advancements will address current technical bottlenecks including data heterogeneity, insufficient model interpretability, and weak cross-dataset generalization capability [22].
In clinical translation, scRNA-seq is poised to revolutionize stem cell therapy by enabling precise characterization of therapeutic cell populations, identifying potency biomarkers, and monitoring functional stability during expansion [20] [26]. The technology facilitates quality control of stem cell products and provides insights into mechanisms underlying therapeutic efficacy [27] [24]. As the field progresses, scRNA-seq will continue to be an indispensable tool for unlocking the full therapeutic potential of stem cells in regenerative medicine.
From Lab to Analysis: scRNA-seq Workflows, Technologies, and Stem Cell Applications
Stem cell research represents a cornerstone of regenerative medicine and developmental biology. The isolation of pure, viable stem cell populations is a critical prerequisite for downstream applications, including single-cell RNA sequencing (scRNA-seq) for comprehensive characterization [8] [28]. Cellular heterogeneity is a fundamental characteristic of stem cell populations, and bulk analysis methods often mask critical differences between individual cells [8]. The transition to single-cell technologies has, therefore, become imperative for elucidating the true complexity of stem cell systems.
This application note details established and emerging strategies for stem cell isolation, with a specific focus on fluorescence-activated cell sorting (FACS) and microfluidic platforms. Furthermore, it addresses the unique challenges associated with isolating particularly sensitive cell types, such as quiescent stem cells. The protocols and data presented herein are designed to be directly applicable within the context of a broader research thesis utilizing scRNA-seq for stem cell characterization, ensuring that isolated cells are of the highest quality and viability for subsequent genomic analysis [29].
Core Stem Cell Isolation Technologies
The choice of isolation technology significantly impacts the purity, viability, and molecular fidelity of the resulting stem cell population. The following table summarizes the key characteristics of the primary methods discussed in this note.
Table 1: Comparison of Core Stem Cell Isolation Technologies
| Technology | Principle | Key Advantages | Key Limitations | Typical Purity/Recovery |
|---|---|---|---|---|
| FACS [30] | Antibody- or ligand-based fluorescent labeling followed by electrostatic droplet sorting. | High purity and flexibility; multiparameter sorting based on multiple markers. | Can be stressful for cells; requires specific surface markers. | High purity (>95%) possible; recovery depends on cell rarity and viability. |
| Microfluidics [31] [32] | Lab-on-a-chip platform for cell manipulation using physical properties or droplets. | Gentle processing; high-throughput; label-free options; minimal reagent volumes. | Lower purity than FACS in some formats; can be low-throughput for complex protocols. | Purity of ~89% shown for mES cells [32]; high viability maintained. |
| Magnetic-Activated Cell Sorting (MACS) | Antibody-based magnetic labeling followed by column-based separation. | Fast; simple; gentle; suitable for large sample volumes. | Lower purity than FACS; typically limited to single-parameter sorting. | High recovery, but purity is generally lower than FACS. |
Fluorescence-Activated Cell Sorting (FACS)
FACS remains a gold standard for stem cell isolation due to its high precision and versatility. The fundamental principle involves labeling cells with fluorescent antibodies or ligands against specific surface markers, then passing them through a vibrating nozzle to form a stream of single-cell droplets. Each droplet is electrically charged based on its fluorescence characteristics and deflected into collection tubes [30].
A key application in stem cell research is the isolation of neural and glioma stem cells based on their ability to bind to the Epidermal Growth Factor (EGF) ligand. This method isolates functional EGFR+ populations directly from fresh human tissues, which have been demonstrated to encompass the sphere-forming, self-renewing cells [30]. The subtractive FACS method is another powerful technique, useful for isolating planarian stem cells by comparing the FACS profiles of intact and stem-cell-depleted (γ-irradiated) organisms stained with Hoechst 33342 and Calcein AM [33].
Microfluidic Platforms
Microfluidic technology has emerged as a powerful alternative, enabling high-throughput, label-free, and low-reagent-consumption isolation of stem cells [31]. These systems manipulate cells within microscale channels and chambers, often using physical properties like size, deformability, or electrical impedance for separation.
A notable application is the feeder-separated co-culture system for mouse Embryonic Stem (mES) cells. This approach uses a polydimethylsiloxane (PDMS) porous membrane-assembled 3D-microdevice to co-culture mES cells with normal (non-inactivated) mouse Embryonic Fibroblasts (mEFs) as a feeder layer. The membrane allows for the free exchange of essential signaling molecules, maintaining mES cells in an undifferentiated state, as confirmed by Nanog and Oct-4 expression. Crucially, this setup allows for the direct collection of highly pure mES cell populations (89.2% purity) without the need for further purification, as the mEFs are physically separated [32].
Special Considerations for Sensitive Cell Types
Standard isolation protocols can activate or stress sensitive stem cells, altering their transcriptomic profile. This is a critical consideration for scRNA-seq, where preserving the in vivo state is paramount [29]. Quiescent muscle stem cells (satellite cells) are a prime example, as they rapidly activate upon conventional FACS isolation.
An innovative protocol to overcome this challenge involves the perfusion of fixative (paraformaldehyde, PFA) in vivo prior to cell isolation [34]. This approach crosslinks cellular components, effectively "snapshotting" the quiescent state and preserving the native gene expression signature during the subsequent dissociation and sorting process. Fixed cells remain suitable for downstream scRNA-seq library preparation, providing a more accurate representation of the quiescent transcriptome.
Table 2: Key Reagents for In Situ Fixation of Quiescent Muscle Stem Cells [34]
| Reagent | Function/Description | Application Note |
|---|---|---|
| Paraformaldehyde (PFA) | Crosslinking fixative. | Perfused through the circulatory system to fix tissues in vivo before dissection. |
| Glycine | Quenching agent. | Neutralizes residual PFA to stop the fixation process and prevent over-fixation. |
| Collagenase II & Dispase II | Enzymatic digestion cocktail. | Used sequentially to dissociate fixed muscle tissue into a single-cell suspension. |
| Pax7-nGFP Reporter Mouse | Genetic labeling. | Provides GFP expression specifically in quiescent satellite cells for FACS gating. |
The following diagram illustrates the core decision-making workflow for selecting an appropriate stem cell isolation strategy based on key experimental requirements.
Detailed Experimental Protocols
Protocol: FACS-based Isolation of Human Neural and Glioma Stem Cells using EGF Ligand
This protocol is adapted from a peer-reviewed method for the prospective isolation of stem cell populations from fresh human germinal matrix and glioblastoma tissues [30].
Research Reagent Solutions:
- EGF Ligand-AF647 Conjugated: For labeling EGFR+ cells.
- Papain Solution: For enzymatic tissue dissociation.
- Viability Dye (DAPI): To exclude dead cells during FACS.
- Lineage Exclusion Antibodies (PE-conjugated): Anti-CD24, Anti-CD34, Anti-CD45 to exclude hematopoietic and endothelial cells.
- FACS Buffer: PBS with 1% BSA.
Methodology:
- Tissue Dissociation: Mince fresh tissue into a fine slurry and digest using an activated Papain solution (20 U/mL) containing DNase I (150 U/mL) for 30-45 minutes at 37°C. Gently triturate every 10-15 minutes.
- Single-Cell Suspension: Pass the digested tissue through a 40 μm cell strainer. Pellet cells and resuspend in a solution of Ovomucoid Trypsin Inhibitor to neutralize the papain. Perform a density gradient centrifugation with Percoll to remove myelin and debris if necessary.
- Staining: Resuspend the single-cell pellet in FACS buffer. Incubate with EGF-AF647 ligand and a cocktail of PE-conjugated lineage exclusion antibodies for 30 minutes on ice, protected from light.
- FACS Sorting: Wash cells to remove unbound ligand/antibody and resuspend in FACS buffer containing DAPI. Sort using a high-speed cell sorter. The target population is EGF-AF647+ / Lineage-PE- / DAPI-.
- Quality Control: Assess sorted cell viability via Trypan Blue exclusion. Validate stem cell properties through in vitro sphere-forming assays and checks for self-renewal and multilineage differentiation capacity.
Protocol: Microfluidic Co-culture and Isolation of mES Cells
This protocol describes a feeder-separated co-culture system that yields pure mES cells without the need for feeder inactivation or post-culture purification [32].
Research Reagent Solutions:
- PDMS Porous Membrane Microdevice: The custom-fabricated core component for spatially separated co-culture.
- Normal Mouse Embryonic Fibroblasts (mEFs): Used as mitotically active feeder layers.
- mES Cell Medium: Standard culture medium supplemented with LIF.
- Trypsin Solution: For harvesting purified mES cells.
Methodology:
- Device Preparation: Fabricate the microdevice by bonding a porous PDMS membrane (~10 μm thick, ~11 μm pore diameter) between two PDMS layers containing microchannels. Sterilize before use.
- Cell Seeding: Introduce a suspension of normal, non-inactivated mEFs into the bottom microchannel. Allow cells to adhere to the underside of the porous membrane. Subsequently, introduce mES cells into the top microchannel, allowing them to adhere to the upper side of the same membrane.
- Co-culture: Culture the assembled device for 5-7 days. The porous membrane allows for the free diffusion of nutrients and critical signaling molecules from the mEFs to the mES cells, maintaining pluripotency.
- Harvesting Pure mES Cells: To harvest, introduce a trypsin solution only into the top microchannel containing the mES cells. Collect the outflow from the top channel. This suspension contains a highly pure population of mES cells, physically separated from the mEFs located in the bottom channel.
- Validation: Confirm the undifferentiated state of the isolated mES cells by assaying for pluripotency markers such as Nanog and Oct-4 via immunostaining or ALP activity.
The strategic isolation of stem cells is a dynamic field that balances the competing demands of purity, viability, and biological fidelity. FACS offers high-precision isolation based on specific markers, while microfluidic technologies provide gentler, high-throughput alternatives that are increasingly integrated with multi-omic analyses. For the most sensitive cell populations, such as quiescent stem cells, specialized methods like in vivo fixation are necessary to preserve their native state for accurate molecular characterization via scRNA-seq. The choice of protocol is therefore contingent on the specific stem cell type, the required yield and purity, and the ultimate goal of the downstream analysis, all of which must be carefully considered in the design of a robust research thesis.
Single-cell RNA sequencing (scRNA-seq) has revolutionized biological sciences by enabling the dissection of cellular heterogeneity at an unprecedented resolution. For stem cell biology, this technology is indispensable. Stem cell populations are fundamentally heterogeneous; even within a 'homogeneous' population, cell-to-cell variation in gene expression exists due to differences in physiological states, differentiation potential, and microenvironmental influences [8]. Traditional bulk RNA sequencing methods mask this heterogeneity by providing averaged read-outs across thousands of cells, potentially obscuring rare stem cell subtypes and transitional states [35]. scRNA-seq overcomes this limitation, allowing researchers to comprehensively characterize stem cell populations, identify novel subpopulations, reconstruct developmental trajectories, and uncover the regulatory networks underlying pluripotency and differentiation [8] [36]. The application of scRNA-seq has led to exciting discoveries across various stem cell types, including pluripotent stem cells, tissue-specific stem cells, and cancer stem cells [36] [37].
As the field has advanced, numerous scRNA-seq platforms have been developed, each with distinct advantages and limitations. Among these, Smart-seq2, 10X Genomics Chromium, and Drop-seq have emerged as widely used technologies. Selecting the appropriate platform is critical for designing successful experiments in stem cell research. This article provides a systematic comparison of these three platforms, detailing their technical principles, performance characteristics, and protocol considerations to guide researchers in making informed choices for their specific applications in stem cell characterization.
Technology Comparison and Performance Metrics
The three platforms employ fundamentally different approaches for single-cell capture and library preparation:
Smart-seq2: A plate-based, full-length scRNA-seq method that uses fluorescence-activated cell sorting (FACS) to isolate individual cells into multi-well plates [38]. It employs template-switching oligonucleotides (TSO) and PCR to generate full-length cDNA with high sensitivity, enabling detection of both coding and poly(A)-minus RNAs [8]. This method provides comprehensive transcriptome coverage with superior detection of alternatively spliced isoforms and single-nucleotide polymorphisms.
10X Genomics Chromium: A high-throughput, droplet-based system that partitions single cells into nanoliter-scale droplets along with barcoded beads [39] [38]. Each bead contains oligonucleotides with unique molecular identifiers (UMIs), cell barcodes, and poly(dT) primers for reverse transcription. This platform uses a 3'-end counting approach, quantifying gene expression based on UMI counts rather than full-length transcripts.
Drop-seq: Similar in concept to 10X Genomics, Drop-seq also employs a droplet-based method where single cells are co-encapsulated with barcoded beads in microscopic droplets [40] [8]. The core difference lies in the commercial implementation and specific biochemistry. Drop-seq uses a lower-cost, open-source approach but generally requires more extensive optimization compared to the commercial 10X Genomics system [41].
Comprehensive Performance Comparison
The table below summarizes the key performance characteristics of each platform based on comparative analyses:
Table 1: Performance Comparison of Major scRNA-seq Platforms
| Parameter | Smart-seq2 | 10X Genomics Chromium | Drop-seq |
|---|---|---|---|
| Throughput (cells per run) | 96-384 cells (low-throughput) [41] | 1,000-80,000 cells (high-throughput) [40] [38] | ~10,000 cells (high-throughput) [8] |
| Sensitivity (genes detected per cell) | Higher (detects more genes, especially low-abundance transcripts) [39] [38] | Moderate (higher noise for low-expression genes) [39] [38] | Lower compared to 10X and Smart-seq2 [41] |
| Transcript Coverage | Full-length transcript sequencing [38] | 3'-end counting (UMI-based) [38] [35] | 3'-end counting (UMI-based) [8] |
| Mapping Efficiency | ~80% unique mapping ratio [38] | ~80% unique mapping ratio [38] | Lower fraction of exonic reads (~20-46%) [41] |
| Doublet Rate | Low (manual cell inspection) | Varies with cell loading concentration | Similar to 10X, depending on loading concentration |
| Detection of Non-coding RNAs | Lower proportion of lncRNAs [38] | Higher proportion of lncRNAs (6.5%-9.6%) [38] | Not specifically reported in studies |
| Technical Noise | Lower technical variation [39] | Higher noise for low-expression mRNAs [39] | Moderate to high technical variation [41] |
| Data Sparsity (Dropout Rate) | Less severe dropout problems [38] | More severe dropout, especially for low-expression genes [38] | High dropout rate common to droplet methods |
| Multiplexing Capability | Limited (plate-based) | High (cell barcoding) | High (cell barcoding) |
| RNA Input Requirements | Higher RNA input, suitable for low-RNA cells | Lower RNA input, requires sufficient mRNA capture | Lower RNA input, similar to 10X |
Platform-Specific Advantages and Limitations in Stem Cell Research
Each platform offers distinct benefits for specific applications in stem cell research:
Smart-seq2 excels in detecting subtle expression differences, splice variants, and low-abundance transcripts, making it ideal for investigating transcriptional heterogeneity in seemingly homogeneous stem cell populations [39] [38]. Its full-length transcript coverage enables identification of allele-specific expression and novel isoforms in pluripotent stem cells [8]. However, its lower throughput limits its utility for capturing rare cell types within complex stem cell niches.
10X Genomics Chromium provides the scale needed to comprehensively profile complex stem cell populations and identify rare subpopulations, such as tissue-specific stem cells or transitional states during differentiation [39] [38]. The UMI-based quantification reduces amplification biases, improving quantification accuracy [35]. Limitations include inability to detect splice variants and higher data sparsity, particularly for lowly-expressed transcription factors that regulate stem cell fate.
Drop-seq offers a cost-effective alternative for high-throughput profiling, suitable for large-scale studies of stem cell populations when budget constraints preclude 10X Genomics [8]. However, it generally demonstrates lower sensitivity and higher technical noise compared to 10X Chromium, potentially missing critical but lowly-expressed markers of stem cell identity [41].
Table 2: Platform Selection Guide for Specific Stem Cell Applications
| Research Application | Recommended Platform | Rationale |
|---|---|---|
| Characterizing rare stem cell populations | 10X Genomics Chromium | High throughput enables capture of rare cell types [39] |
| Analyzing splice variants in pluripotent cells | Smart-seq2 | Full-length transcript detection enables isoform-level analysis [38] |
| Large-scale differentiation experiments | 10X Genomics Chromium or Drop-seq | High throughput tracks population shifts across time points [36] |
| Single-cell multiornics integration | 10X Genomics Chromium | Compatible with feature barcoding for surface protein detection |
| Low-input precious samples | Smart-seq2 | Higher sensitivity with limited cell numbers [38] |
| Building developmental trajectories | Either 10X (large populations) or Smart-seq2 (detailed kinetics) | Balance between population size and transcriptional detail [8] |
Experimental Design and Platform Selection Framework
Decision Framework for Platform Selection
Selecting the optimal scRNA-seq platform requires careful consideration of multiple experimental factors. The following diagram illustrates the key decision points in platform selection:
Sample Preparation Considerations for Stem Cells
Proper sample preparation is critical for successful scRNA-seq experiments, particularly for sensitive stem cell populations:
Cell Dissociation: Stem cells are particularly vulnerable to dissociation-induced stress. Enzymatic dissociation should be optimized to minimize cellular stress, which can alter transcriptional profiles [35]. Cold-active proteases or gentle mechanical dissociation can help preserve RNA integrity and cell viability.
Viability and Quality Control: Stem cell viability should exceed 90% to minimize ambient RNA contamination from dying cells [42]. Flow cytometry with viability dyes (e.g., Calcein AM/ EthD-1) provides accurate assessment of live/dead cell ratios and detects doublets that could confound analysis [40].
Cell Sorting and Enrichment: For rare stem cell populations, fluorescence-activated cell sorting (FACS) enables isolation based on specific surface markers [35]. However, antibody binding to surface markers may activate signaling pathways that alter transcriptional states, requiring appropriate controls [35].
RNA Quality: Assessment of RNA integrity is particularly important for stem cells, which may have distinct RNA metabolism compared to differentiated cells. The RNA integrity number (RIN) should be measured when possible, though this requires bulk cell samples [35].
Detailed Experimental Protocols
Smart-seq2 Protocol for Stem Cell Characterization
The Smart-seq2 protocol provides high-sensitivity transcriptome profiling ideal for detailed analysis of stem cell populations:
Sample Preparation:
- Prepare single-cell suspension from stem cell cultures using gentle dissociation techniques to preserve viability.
- Sort individual cells into 96-well or 384-well plates containing lysis buffer using FACS. Include visual confirmation of single-cell deposition.
- Cell lysis buffer composition: 0.2% Triton X-100, 2 U/μl RNase inhibitor, 1 mM dNTPs, 2.5 μM oligo-dT30VN primer.
Reverse Transcription and cDNA Amplification:
- Add reverse transcription mix: 1× First Strand buffer, 5 mM MgCl2, 2 U/μl RNase inhibitor, 10 mM DTT, 1 M betaine, 6 mM MgCl2, 1.25 μM TSO, 10 U/μl Reverse Transcriptase.
- Incubate: 90 min at 42°C, 10 cycles of (50°C for 2 min, 42°C for 2 min), then 85°C for 5 min.
- Add PCR preamplification mix: 1× KAPA HiFi HotStart ReadyMix, 0.1 μM ISPCR primer.
- Amplify: 98°C for 3 min; 21-25 cycles of (98°C for 20 sec, 67°C for 15 sec, 72°C for 4 min); 72°C for 5 min.
Library Preparation and Sequencing:
- Purify amplified cDNA using paramagnetic beads (0.6:1 bead-to-sample ratio).
- Quantify cDNA yield using fluorometric assays (e.g., PicoGreen).
- Prepare sequencing libraries using Nextera XT DNA Sample Preparation Kit with 150 pg cDNA input.
- Sequence on Illumina platforms with recommended read length: 75 bp paired-end for high gene detection sensitivity.
10X Genomics Chromium Protocol for Stem Cell Analysis
This protocol enables high-throughput profiling of complex stem cell populations:
Sample Preparation:
- Prepare single-cell suspension with concentration of 700-1,200 cells/μl in PBS with 0.04% BSA.
- Filter through 40 μm flowmi cell strainer to remove aggregates and debris.
- Confirm viability >90% using automated cell counters or flow cytometry.
Single Cell Partitioning and Barcoding:
- Load Chromium Chip B with:
- 70 μl Master Mix (Reverse Transcription reagents)
- 55 μl cell suspension (targeting 5,000-10,000 cells)
- 35 μl Partitioning Oil
- Run the chip on Chromium Controller to generate single-cell droplets.
- Incubate droplets: 53°C for 45 min (reverse transcription), then 85°C for 5 min (enzyme inactivation).
Library Construction:
- Break droplets and recover barcoded cDNA using Recovery Agent.
- Purify cDNA using Silane magnetic beads.
- Perform cDNA amplification: 98°C for 3 min; 12 cycles of (98°C for 15 sec, 67°C for 20 sec, 72°C for 1 min); 72°C for 1 min.
- Fragment and add sample index: 95°C for 1 min; 4°C hold; then add Fragmentation Buffer, 32°C for 5 min, 65°C for 30 min, 4°C hold.
- Perform sample index PCR: 98°C for 45 sec; 14 cycles of (98°C for 20 sec, 54°C for 30 sec, 72°C for 20 sec); 72°C for 1 min.
- Purify library with double-sided SPRIselect bead cleanup (0.6X and 0.8X ratios).
Sequencing:
- Quantify library using Bioanalyzer High Sensitivity DNA kit (expect ~500 bp peak).
- Sequence on Illumina NovaSeq or HiSeq with recommended configuration: 28 bp Read 1 (cell barcode and UMI), 91 bp Read 2 (transcript), and 8 bp i7 index (sample barcode).
Quality Control Measures Across Platforms
Rigorous quality control is essential for generating reliable scRNA-seq data from stem cells:
- Cell Quality Metrics: Monitor mitochondrial RNA percentage (should generally be <20% for healthy cells, though stem cells may have naturally higher levels), number of genes detected per cell, and total reads/UMIs per cell [38].
- Contamination Control: Include empty wells (Smart-seq2) or empty droplets (droplet methods) to assess ambient RNA contamination.
- Batch Effects: Distribute different experimental conditions across multiple plates/chips to minimize batch effects [42].
- Spike-in Controls: Use synthetic RNA spike-ins (e.g., ERCC standards) to quantify technical sensitivity, particularly for absolute transcript counting.
The Scientist's Toolkit: Essential Research Reagents and Materials
Table 3: Essential Research Reagents and Materials for scRNA-seq
| Reagent/Material | Function | Platform Compatibility |
|---|---|---|
| RNase Inhibitors | Prevent RNA degradation during cell processing | All platforms |
| Viability Stains (Calcein AM/ EthD-1) | Distinguish live/dead cells during sorting | All platforms [40] |
| Barcoded Beads with Oligo(dT) | Cell barcoding and mRNA capture | 10X Genomics, Drop-seq |
| Template Switching Oligo (TSO) | cDNA synthesis with universal PCR handle | Smart-seq2 |
| Magnetic Beads (SPRIselect) | cDNA and library purification | All platforms |
| Nextera XT DNA Library Prep Kit | Library preparation for full-length methods | Smart-seq2 |
| Chromium Single Cell 3' Reagent Kits | Integrated reagents for 10X platform | 10X Genomics only |
| Single-Cell Lysis Buffer | Cell membrane disruption and RNA stabilization | Smart-seq2, plate-based methods |
| Partitioning Oil | Generation of water-in-oil emulsions | 10X Genomics, Drop-seq |
| UMI Barcoded Primers | Molecular counting and reduction of amplification bias | 10X Genomics, Drop-seq [35] |
Data Analysis Considerations and Challenges
Addressing the Zero-Inflation Challenge
A universal characteristic of scRNA-seq data is the high proportion of zero counts, which can exceed 90% in some datasets [43]. These zeros have multiple origins:
- Biological Zeros: Represent genuine absence of gene expression in specific cell types or due to stochastic transcriptional bursting [43].
- Technical Zeros: Arise from inefficient mRNA capture during reverse transcription, particularly problematic for low-abundance transcripts [43].
- Sampling Zeros: Result from limited sequencing depth, where expressed genes are not detected due to random sampling effects [43].
The following diagram illustrates the relationship between data sparsity and key analytical considerations across platforms:
A standardized computational pipeline ensures consistent processing across different platforms:
- Quality Control and Filtering: Remove low-quality cells based on detected genes, total counts, and mitochondrial percentage.
- Normalization: Account for sequencing depth variation between cells (e.g., SCTransform for 10X data).
- Feature Selection: Identify highly variable genes for downstream dimensionality reduction.
- Integration: Remove batch effects when combining multiple experiments using methods like Harmony or CCA.
- Clustering: Identify cell subpopulations using graph-based or centroid-based methods.
- Differential Expression: Identify marker genes using methods accounting for zero inflation (e.g., MAST, DESeq2).
- Trajectory Inference: Reconstruct developmental pathways using tools like Monocle3 or PAGA.
The selection of an appropriate scRNA-seq platform represents a critical decision point in experimental design for stem cell research. Smart-seq2, 10X Genomics Chromium, and Drop-seq each offer distinct advantages that make them suitable for different research applications. Smart-seq2 provides superior sensitivity and full-length transcript information ideal for characterizing known stem cell populations in detail. 10X Genomics Chromium offers unparalleled throughput for discovering rare stem cell subtypes and reconstructing complex differentiation landscapes. Drop-seq presents a cost-effective alternative for large-scale studies where budget constraints preclude commercial solutions.
As the field advances, emerging technologies that combine high sensitivity with high throughput will further enhance our ability to decipher stem cell biology. Additionally, multi-omics approaches that simultaneously profile gene expression alongside other molecular features (chromatin accessibility, surface proteins, etc.) will provide more comprehensive views of stem cell states and regulatory mechanisms. By understanding the strengths and limitations of current scRNA-seq platforms, researchers can make informed decisions that optimize their experimental approach and maximize the biological insights gained from precious stem cell samples.
Single-cell RNA sequencing (scRNA-seq) has revolutionized stem cell research by enabling the dissection of cellular heterogeneity within populations previously considered 'homogeneous'. This capability is crucial for identifying distinct phenotypic cell types and understanding the early stages of cell fate decisions [8]. For hematopoietic stem and progenitor cells (HSPCs), scRNA-seq provides unprecedented resolution to analyze primitive stem cell populations and their progressive lineage restriction, often depicted as a "hematopoietic tree" [44]. However, obtaining high-quality scRNA-seq data from precious stem cell samples requires an optimized, reproducible workflow from cell sorting through sequencing and data analysis. This protocol details a streamlined workflow specifically optimized for stem cells, incorporating recent methodological advances to enhance sensitivity, reproducibility, and practical implementation in research and drug development settings.
Experimental Design and Preparation
Key Considerations for Stem Cell scRNA-seq
Successful scRNA-seq experiments begin with careful experimental design tailored to stem cell biology. Several factors must be considered before selecting a scRNA-seq method. First, the number of cells needed per experiment depends on the heterogeneity of the cell population and the proportion of the cell type of interest [45]. For rare stem cell populations, pre-purification via fluorescence-activated cell sorting (FACS) with deeper sequencing is recommended. Cell size is another critical factor; smaller cells (less than 25 μm in diameter) are generally easier to process with minimal damage compared to larger or irregularly-shaped cells [45]. When working with challenging cell types like adult cardiomyocytes or neurons, single nuclei RNA-seq (snRNA-seq) presents a valuable alternative [45]. Finally, experimental design should limit confounding factors through balanced conditions and appropriate controls, even as computational methods for removing technical biases continue to advance [45].
Research Reagent Solutions and Essential Materials
The following table details key reagents and materials essential for implementing a robust stem cell scRNA-seq workflow:
Table 1: Essential Research Reagents and Materials for Stem Cell scRNA-seq
| Item | Function/Purpose | Examples/Specifications |
|---|---|---|
| FACS Antibodies | Enrichment of target stem cell populations | CD34, CD133, CD45, Lineage cocktail (CD235a, CD2, CD3, CD14, CD16, CD19, CD24, CD56, CD66b) [44] |
| Cell Sorting System | Isolation of pure cell populations | MoFlo Astrios EQ cell sorter or similar [44] |
| Tissue Dissociation System | Mechanical/enzymatic digestion of tissues | gentleMACS Dissociator with optimized enzyme cocktails [46] |
| Fixation Reagent | Cell preservation for flexible processing timing | DSP (3,3-dithio-bis-(sulfosuccinimidyl) propionate) - reversible crosslinker [46] |
| scRNA-seq Library Kit | Single-cell library preparation | 10X Genomics Chromium Next GEM Single Cell 3' Kit v3.1 [44] or Scale Biosciences QuantumScale Single Cell RNA [47] |
| Sequencing System | High-throughput sequencing | Illumina NextSeq 1000/2000, NovaSeq X [44] [47] |
| Bioinformatics Tools | Data processing and analysis | Cell Ranger, Seurat, STARsolo, scran [44] [45] [48] |
Laboratory Workflow: From Cell to Library
Cell Isolation and Sorting
Stem Cell Isolation from Human Umbilical Cord Blood (hUCB): Begin with fresh hUCB diluted with phosphate-buffered saline (PBS) and carefully layered over Ficoll-Paque for density gradient centrifugation (30 min at 400× g at 4°C) [44]. Collect the mononuclear cell (MNC) phase, wash, and proceed to staining. For intracellular targets, consider fixation options at this stage.
Fluorescence-Activated Cell Sorting (FACS): Stain MNCs with antibody cocktails for positive and negative selection. For hematopoietic stem/progenitor cells (HSPCs), use:
- Hematopoietic lineage markers (Lin) cocktail: CD235a, CD2, CD3, CD14, CD16, CD19, CD24, CD56, CD66b (FITC-conjugated)
- PE-Cy7-conjugated anti-CD45
- PE-conjugated anti-CD34
- APC-conjugated anti-CD133 [44] Incubate cells with antibodies in the dark at 4°C for 30 minutes, then centrifuge and resuspend in RPMI-1640 medium with 2% FBS. Sort cells using a gating strategy that first selects small events (2–15 μm) in a "lymphocyte-like" gate, then isolates Lin-negative events, and finally gates for CD45+ combined with either CD34+ or CD133+ populations [44]. Sort directly into appropriate collection media.
Tissue Dissociation Optimization: For solid tissues, mechanical/enzymatic digestion using systems like the gentleMACS Dissociator with optimized enzyme cocktails significantly improves live cell recovery compared to mechanical dissociation alone (90% vs. 10% live cells in pancreatic cancer models) [46]. This is particularly crucial for tissues with inherently low viability such as treated tumors or delicate stem cell niches.
Cell Fixation and Preservation (Optional)
For flexibility in timing between cell sorting and library preparation, consider reversible fixation. DSP (3,3-dithio-bis-(sulfosuccinimidyl) propionate) fixation effectively preserves cell RNA integrity and maintains antibody staining patterns while allowing storage at 4°C for at least 24 hours before FACS sorting and scRNA-seq [46]. After storage, reverse crosslinking with dithiothreitol (DTT) before proceeding to library preparation. This approach is particularly valuable when coordinating with shared sorting or sequencing facilities.
Single-Cell Library Preparation
10X Genomics Workflow: After sorting, process cells directly using the Chromium X Controller and Chromium Next GEM Chip G Single Cell Kit according to manufacturer guidelines [44]. Use Chromium Next GEM Single Cell 3' GEM, Library & Gel Bead Kit v3.1, and Single Index Kit T Set A for library preparation. Libraries can be pooled and sequenced on Illumina platforms with P2 flow cell chemistry (200 cycles) in paired-end mode (read 1: 28 bp, read 2: 90 bp), targeting approximately 25,000 reads per single cell [44].
Alternative Platform: QuantumScale Single Cell RNA: Scale Biosciences offers an alternative with streamlined workflow benefits, including over 75% reduction in hands-on time without specialized instrumentation [47]. This platform supports a wide range of project scales (from 168,000 to 4 million cells) and is compatible with fixation, allowing sample storage for up to one year at -80°C before processing. The technology uses Quantum Barcoding to consolidate barcoding steps and includes integrated sample multiplexing (ScalePlex) that enables combining 10 to over 9,000 samples in a single run, significantly reducing batch effects [47].
CRISPR-based Depletion of Abundant Transcripts: For samples with problematic abundant transcripts (e.g., mitochondrial 16S rRNA in planarians, which can comprise 5-74% of reads), integrate CRISPR/Cas9-based depletion (DASH - Depletion of Abundant Sequences by Hybridization) after initial cDNA amplification [49]. Design 30 non-overlapping single-guide RNAs (sgRNAs) spanning the target transcript, then incubate cDNA with pooled sgRNAs complexed with Cas9 after limited PCR cycles (e.g., 10 cycles), followed by additional amplification after depletion [49]. This physical depletion outperforms in silico removal, reducing dropout rates and improving detection of rare transcripts.
Sequencing and Data Analysis
Sequencing Platform Considerations
Different sequencing platforms offer various trade-offs for scRNA-seq. Second-generation sequencers (e.g., Illumina) provide high sensitivity for variant detection and comprehensive coverage at lower cost per base, but generate short reads and require large, expensive instruments [50]. Third-generation platforms (e.g., PacBio, Oxford Nanopore) generate long reads useful for novel genome assembly and can detect epigenetic modifications, but typically have higher error rates and cost per base [50]. For most scRNA-seq applications requiring high accuracy and throughput, Illumina platforms (NextSeq, NovaSeq) are currently preferred, with Ultima Genomics also emerging as a compatible option for certain platforms like QuantumScale [47].
Bioinformatics Analysis Pipeline
A standardized bioinformatics workflow is essential for reproducible scRNA-seq analysis. The following diagram illustrates the complete computational workflow from raw data to biological insights:
Pre-processing and Quality Control: Begin with quality assessment of raw reads using FastQC, followed by trimming of adapters and low-quality bases with tools like Trim Galore or cutadapt [45]. For UMI-based datasets, quantify expression using Cell Ranger or the faster alternative STARsolo, which produces nearly identical results but is approximately 10 times faster [45]. Perform cell-level quality control by calculating key metrics and filtering out:
- Cells with fewer than 200 or more than 2500 detected genes [44]
- Cells with high mitochondrial read percentage (>5-20%, depending on cell type) [44] [45]
- Potential doublets using tools like scrublet or DoubletFinder [45]
Filter genes expressed in extremely few cells, but exercise caution as overly stringent thresholds may eliminate biologically relevant rare cell populations [45].
Normalization and Batch Correction: Normalize count data to correct for differing sequencing depths using scRNA-seq-specific methods like scran or SCnorm, which outperform bulk RNA-seq methods, particularly for asymmetric gene expression distributions common across cell types [48]. When integrating multiple datasets, apply batch correction methods to remove technical variation while preserving biological differences.
Dimensionality Reduction and Clustering: Identify highly variable genes to focus subsequent analyses on the most biologically informative features. Perform dimensionality reduction using principal component analysis (PCA) followed by visualization with uniform manifold approximation and projection (UMAP) [44]. Cluster cells using graph-based or k-means approaches to identify distinct cell populations. For hematopoietic stem cells, this reveals subpopulations corresponding to different lineage priming states [44].
Downstream Analysis: Identify marker genes for each cluster to facilitate cell type annotation using differential expression testing. For developmental processes like stem cell differentiation, apply trajectory inference algorithms (Monocle, Waterfall) to reconstruct pseudotemporal ordering of cells along differentiation trajectories [8]. Analyze cell-cell communication patterns to understand signaling interactions within stem cell niches.
Quality Assessment Metrics
Establish rigorous quality control metrics throughout the workflow to ensure data reliability. The following table summarizes key quantitative metrics to assess at each stage:
Table 2: Key Quality Control Metrics Across the scRNA-seq Workflow
| Workflow Stage | Metric | Target/Threshold |
|---|---|---|
| Cell Sorting | Purity | >95% for target population |
| Cell Viability | Viability | >90% (tissue-dependent) [46] |
| Library Preparation | Cell Recovery | 50-60% or higher [47] |
| Multiplets | ≤4% [47] | |
| Sequencing | Reads/Cell | 25,000-50,000 [44] |
| Data Processing | Genes/Cell | 500-2500 (after QC) [44] [45] |
| Mitochondrial % | <5-20% (cell type dependent) [44] [45] | |
| UMI Counts/Cell | >1000 (after QC) [45] |
Application to Stem Cell Research
Case Study: Hematopoietic Stem/Progenitor Cells (HSPCs)
Applying this optimized workflow to human umbilical cord blood-derived HSPCs has demonstrated that CD34+Lin-CD45+ and CD133+Lin-CD45+ populations show remarkably similar transcriptomic profiles (R = 0.99), despite the hypothesis that CD133+ populations might be enriched for more primitive stem cells [44]. This integrated "pseudobulk" analysis approach revealed that working with FACS-sorted material rather than full pellets of blood cells enables robust HSPC analysis even with limited cell numbers [44] [51]. The workflow successfully identified subpopulations and priming states within these stem cell compartments, highlighting the importance of standardized protocols for biological interpretation.
Troubleshooting and Optimization
Common challenges in stem cell scRNA-seq include low cell viability after dissociation, high mitochondrial RNA content, and limited cell numbers. To address these:
- Optimize dissociation protocols using mechanical/enzymatic approaches rather than mechanical alone to significantly improve viability [46]
- Consider physical depletion of problematic abundant transcripts using CRISPR/DASH when mitochondrial or ribosomal RNA dominates libraries [49]
- Utilize fixed cell protocols when coordinating multiple experimental steps is challenging [46]
- Implement cell hashing or multiplexing to process multiple samples together, reducing batch effects and costs [47]
For computational challenges including asymmetric expression distributions between cell types, use normalization methods (scran, SCnorm) that maintain false discovery rate control even with substantial differences in total mRNA content between cell types [48].
This complete workflow breakdown provides a standardized framework for implementing scRNA-seq from cell sorting through sequencing and data analysis, specifically optimized for stem cell research. The integration of experimental wet-lab protocols with computational analysis pipelines ensures reproducibility and enhances data quality. For stem cell biologists and drug development professionals, this comprehensive approach enables more precise characterization of stem cell heterogeneity, differentiation trajectories, and molecular regulation, ultimately advancing both basic research and therapeutic applications. As scRNA-seq technologies continue to evolve, maintaining standardized workflows while incorporating validated improvements will remain essential for generating biologically meaningful and comparable data across studies and laboratories.
Application Note
Single-cell RNA sequencing (scRNA-seq) has revolutionized stem cell research by enabling the precise characterization of cellular heterogeneity, the identification of rare subpopulations, and the elucidation of differentiation trajectories. This application note details how scRNA-seq is applied within three critical areas: characterizing primary hematopoietic stem and progenitor cells (HSPCs), mapping the differentiation of induced pluripotent stem cells (iPSCs) into cardiomyocytes, and modeling in vitro hematopoiesis from iPSCs. The protocols and data presented herein provide a framework for leveraging scRNA-seq to uncover novel regulatory mechanisms and cellular states in stem cell biology, with direct implications for regenerative medicine and drug development.
scRNA-seq of Primary Human Hematopoietic Stem/Progenitor Cells (HSPCs)
Background and Objectives: Human umbilical cord blood (UCB) is a rich source of HSPCs, which are traditionally enriched using surface markers like CD34 and CD133. A key research objective is to determine whether these markers delineate functionally distinct stem cell populations at the molecular level. scRNA-seq was employed to compare the transcriptomes of CD34+Lin−CD45+ and CD133+Lin−CD45+ HSPCs to uncover similarities and differences in their gene expression profiles and subpopulation structures [44].
Key Findings:
- High Transcriptomic Similarity: The study revealed a very strong positive linear relationship (R = 0.99) in gene expression between CD34+ and CD133+ HSPCs, indicating that these populations do not differ significantly at the bulk transcriptome level [44].
- Revealed Cellular Subpopulations: Uniform Manifold Approximation and Projection (UMAP) analysis successfully identified distinct subpopulations within both HSPC types, demonstrating the power of scRNA-seq to resolve cellular heterogeneity even within putatively pure sorted populations [44].
- Workflow Validation: The study established that a workflow involving rigorous FACS sorting, followed by scRNA-seq library preparation using the 10X Genomics platform (Chromium X Controller) and subsequent analysis with Seurat, is feasible and effective even with a limited number of primary cells [44].
Table 1: Key Experimental Parameters for HSPC scRNA-seq
| Parameter | Specification |
|---|---|
| Cell Source | Human Umbilical Cord Blood (UCB) |
| Sorted Populations | CD34+Lin−CD45+ HSPCs and CD133+Lin−CD45+ HSPCs |
| Cell Sorter | MoFlo Astrios EQ |
| scRNA-seq Platform | 10X Genomics (Chromium X Controller) |
| Library Kit | Chromium Next GEM Single Cell 3' GEM, Library & Gel Bead Kit v3.1 |
| Sequencer | Illumina NextSeq 1000/2000 (P2 flow cell) |
| Target Reads/Cell | 25,000 |
| Bioinformatic Pipeline | Cell Ranger → Seurat (v5.0.1) |
| Key QC Filters | Cells with <200 or >2500 genes; >5% mitochondrial reads |
Differentiation Trajectory of iPSC-Derived Cardiomyocytes
Background and Objectives: The differentiation of iPSCs into cardiomyocytes (iPSC-CMs) holds immense promise for regenerative therapy, disease modeling, and drug discovery. However, challenges such as uneven differentiation efficiency and the immaturity of derived cells remain. This study utilized scRNA-seq to delineate the dynamic gene regulatory networks and key transcriptional regulators involved in the cardiomyocyte differentiation process [52].
Key Findings:
- Identification of Differentiation Intermediates: Analysis of 32,365 cells across four time points (days 0, 2, 4, and 10) identified nine distinct cell clusters, including pluripotent stem cells, primitive streak (PS) mesoderm, cardiac progenitors, definitive cardiomyocytes, and smooth muscle cells [52].
- Marker Gene Expression: The true iPSC-CM cluster (Cluster 6) was identified by high expression of key cardiac transcription factors (e.g.,
NKX2-5,TBX5,GATA4,ISL1) and structural genes (e.g.,MYL7,MYH6,TNNT2). This cluster was also enriched in pathways like "Cardiac muscle contraction" and "Hypertrophic cardiomyopathy" [52]. - Regulator Discovery: Differential gene expression and SCENIC analysis identified candidate genes, including
CREGandNR2F2, as playing important regulatory roles in cardiomyocyte lineage commitment [52]. - Trajectory Inference: Pseudotime analysis successfully reconstructed the developmental trajectory from iPSCs to committed cardiomyocytes, revealing a key branching point at day 2 of differentiation where cells commit to the cardiac lineage [52].
Table 2: Key Experimental Parameters for iPSC-Cardiomyocyte scRNA-seq
| Parameter | Specification |
|---|---|
| Cell Lines | Two human iPSC lines (CA4024106, CA4027106) |
| Differentiation Kit | Chemically defined cardiac differentiation kit (Cellapy, CA2004500) |
| Time Points Collected | Days 0, 2, 4, and 10 |
| Total Cells Sequenced | 32,365 |
| Sequencing Platform | 10x Genomics |
| Total Clean Reads | 2,066,741,896 |
| Bioinformatic Pipeline | Seurat |
| Key Analyses | UMAP/t-SNE, Pseudotime, Differential Expression, SCENIC |
Modeling Hematopoiesis using iPSC-Derived Hematopoietic Stem/Progenitor Cells
Background and Objectives: Differentiating iPSCs into HSPCs in vitro provides a valuable model for studying embryonic hematopoiesis and generating cells for clinical applications. This study employed a multi-omics single-cell approach, combining scRNA-seq with single-cell dynamic RNA sequencing (DynaSCOPE) and single-cell glycosylation sequencing (ProMoSCOPE) to dissect the process and investigate the role of glycosylation in hematopoietic regulation [53].
Key Findings:
- Staged Differentiation Process: The in vitro differentiation model was divided into three distinct stages based on the new‐to‐total RNA ratio and glycosylation level, mirroring phased hematopoietic development [53].
- Identification of Hematopoietic Precursors: Precursor hematopoietic cells with high glycosylation levels were found to highly express genes associated with hematopoietic regulation and vascular endothelial development, suggesting a link between glycosylation and the endothelial-to-hematopoietic transition (EHT) [53].
- Similarity to In Vivo Hematopoiesis: The in vitro model recapitulated key events of in vivo hematopoiesis, including yolk sac-like hematopoiesis and specific cellular communication between non-hematopoietic and hematopoietic subsets [53].
Table 3: Key Experimental Parameters for iPSC-Hematopoiesis scRNA-seq
| Parameter | Specification |
|---|---|
| iPSC Line | Clone10 hiPSC line (derived from MRC5 fibroblasts) |
| Differentiation Cytokines | Activin A, BMP4, CHIR-99021, VEGF, bFGF, SCF, EPO |
| Sequencing Technologies | scRNA-seq, DynaSCOPE (dynamic RNA), ProMoSCOPE (glycosylation) |
| Key Surface Markers | CD34, CD43 |
| Functional Validation | Colony-forming unit (CFU) assay |
Experimental Protocols
Protocol 1: scRNA-seq of Sorted Primary HSPCs from Umbilical Cord Blood
This protocol is adapted from the workflow used in the featured study [44].
1. Cell Isolation and Staining:
- Collect human UCB with appropriate ethical approval and participant consent.
- Dilute UCB with PBS and layer over Ficoll-Paque. Centrifuge at 400x g for 30 minutes at 4°C to isolate mononuclear cells (MNCs).
- Wash the MNC fraction and stain with the following antibody cocktail for 30 minutes at 4°C in the dark:
- Lineage (Lin) Cocktail (FITC): CD235a, CD2, CD3, CD14, CD16, CD19, CD24, CD56, CD66b.
- PE-Cy7-conjugated anti-CD45
- PE-conjugated anti-CD34
- APC-conjugated anti-CD133
- Wash cells and resuspend in RPMI-1640 with 2% FBS for sorting.
2. Fluorescence-Activated Cell Sorting (FACS):
- Using a high-speed cell sorter (e.g., MoFlo Astrios EQ), first gate on small, lymphocyte-like events (2–15 μm).
- From this parent gate, select Lin-negative events.
- Finally, sort the CD45+CD34+ (for CD34+ HSPCs) and CD45+CD133+ (for CD133+ HSPCs) populations into collection tubes.
- It is critical to maintain cell viability and proceed quickly to library preparation.
3. Single-Cell Library Preparation and Sequencing:
- Process the sorted cells immediately using a Chromium X Controller (10X Genomics) and the Chromium Next GEM Chip G Single Cell Kit.
- Construct libraries using the Chromium Next GEM Single Cell 3' GEM, Library & Gel Bead Kit v3.1, following the manufacturer's instructions.
- Pool libraries and sequence on an Illumina NextSeq 1000/2000 system using a P2 flow cell (200 cycles) in paired-end mode, targeting a minimum of 25,000 reads per cell.
4. Data Preprocessing and Analysis:
- Demultiplex raw sequencing data and generate FASTQ files using
bcl2fastqor thecellranger mkfastqpipeline. - Align reads, quantify gene expression, and generate count matrices using
cellranger count(Cell Ranger version 7.2.0) with a reference genome (e.g., GRCh38). - Perform downstream analysis in R using the Seurat package (version 5.0.1).
- Filter cells to remove those with <200 or >2,500 detected genes and >5% mitochondrial transcript counts.
- Normalize data using SCTransform and perform linear dimensionality reduction (PCA).
- Cluster cells using a graph-based clustering algorithm (e.g., FindNeighbors and FindClusters in Seurat) and visualize using UMAP.
- Identify differentially expressed genes between clusters using Seurat's
FindAllMarkersfunction.
Protocol 2: scRNA-seq Analysis of iPSC Differentiation to Cardiomyocytes
This protocol summarizes the bioinformatic workflow employed in the featured cardiomyopathy study [52].
1. Data Preprocessing and Quality Control:
- Load the UMI count matrix into Seurat. Filter out low-quality cells and potential multiplets by applying thresholds. A common approach is to exclude cells with an abnormally high number of genes detected (>8,000) and cells where the percentage of mitochondrial genes is ≥10% [52].
- Log-normalize the data using the
NormalizeDatafunction.
2. Dimensionality Reduction and Clustering:
- Identify the top 2,000 highly variable genes using the
FindVariableFeaturesfunction. - Scale the data using
ScaleDatato regress out unwanted sources of variation (e.g., cell cycle stage, mitochondrial percentage). - Perform principal component analysis (PCA) on the scaled data.
- Construct a shared nearest neighbor (SNN) graph based on a defined number of principal components (PCs) and cluster cells using the
FindClustersfunction. - Visualize the clusters in two dimensions using UMAP.
3. Cell Type Annotation and Marker Identification:
- Annotate cell clusters based on the expression of known marker genes [52]:
- Pluripotency:
POU5F1(OCT4),NANOG,SOX2 - Primitive Streak/Mesoderm:
T(Brachyury),MIXL1,EOMES - Cardiac Progenitors:
ISL1,GATA4,NKX2-5,TBX5 - Cardiomyocytes:
TNNT2,MYH6,MYL7 - Smooth Muscle Cells:
TAGLN,ACTA2
- Pluripotency:
- Identify cluster-specific marker genes using
FindAllMarkers.
4. Trajectory and Differential Expression Analysis:
- Perform pseudotime analysis using tools like Monocle or Slingshot to infer the differentiation trajectory and order cells along a continuous path.
- Conduct differential gene expression analysis between specific clusters or along the pseudotime trajectory to identify genes that define lineage commitment.
General Guidelines for scRNA-seq Data Normalization and Batch Correction
Normalization: A critical step to correct for differences in sequencing depth (library size) between cells.
- SCTransform: A widely recommended method based on a regularized negative binomial model. It effectively removes the variation due to sequencing depth and returns Pearson residuals, which are used for downstream dimensionality reduction. It is generally superior to simple log-normalization for UMI data [54].
- scran: Employs a deconvolution approach to compute size factors for pools of cells, making it robust for sparse single-cell data [55].
Batch Effect Correction: Essential when integrating multiple scRNA-seq datasets processed at different times or locations.
- Assessment: Before correction, assess batch effects using PCA, UMAP, or quantitative metrics. If cells cluster strongly by batch rather than biological cell type, correction is needed [56].
- Correction Methods: Several tools are available. Benchmarks suggest Harmony and scANVI are high-performing options [56].
- Avoiding Over-correction: Be cautious of over-correction, which can manifest as distinct cell types being incorrectly merged together in UMAP space [56].
Visualizations
Diagram 1: scRNA-seq Workflow for Stem Cell Analysis
Diagram 2: Key Signaling in iPSC to Cardiomyocyte Differentiation
The Scientist's Toolkit
Table 4: Essential Research Reagents and Kits for Stem Cell scRNA-seq Studies
| Reagent / Kit | Function / Purpose | Example (from Studies) |
|---|---|---|
| FACS Antibody Panels | Isolation of highly pure stem/progenitor cell populations based on surface marker expression. | Anti-CD34, Anti-CD133, Anti-CD45, Lineage Cocktail (CD235a, CD2, CD3, etc.) [44]. |
| Chromium Single Cell Kit (10X Genomics) | Generation of barcoded single-cell RNA-seq libraries from cell suspensions. | Chromium Next GEM Single Cell 3' GEM, Library & Gel Bead Kit v3.1 [44]. |
| Cell Culture & Differentiation Kits | Directed differentiation of iPSCs into specific lineages under defined, reproducible conditions. | Chemically defined cardiac differentiation kit (e.g., from Cellapy) [52]. |
| Cytokines & Growth Factors | Key signaling molecules that drive stem cell fate decisions during differentiation. | Activin A, BMP4, VEGF, bFGF, SCF, EPO [52] [53]. |
| Bioinformatic Pipelines | Software suites for processing raw sequencing data, normalization, clustering, and analysis. | Cell Ranger (10X Genomics), Seurat (R), Scanpy (Python) [44] [12]. |
| Data Integration Tools | Algorithms to combine multiple scRNA-seq datasets and remove technical batch effects. | Harmony, Seurat CCA, scANVI [56] [12]. |
Single-cell RNA sequencing (scRNA-seq) has revolutionized transcriptomic studies by enabling the comprehensive analysis of cellular heterogeneity in complex biological systems, providing unprecedented insights into gene expression at the individual cell level [3]. This technology is particularly valuable for stem cell characterization research, where understanding cellular diversity, developmental pathways, and state transitions is paramount for uncovering mechanisms of differentiation, self-renewal, and reprogramming. The analysis of scRNA-seq data, however, presents significant challenges due to its high-dimensionality, sparsity, and technical noise [57]. This application note provides a detailed protocol for the critical computational steps in scRNA-seq analysis—dimensionality reduction, clustering, and trajectory inference—framed within the context of stem cell research. We present current best practices, method comparisons, and standardized workflows to enable researchers to reliably identify stem cell subpopulations, reconstruct differentiation trajectories, and uncover novel regulatory dynamics.
Experimental Protocols and Workflows
Sample Preparation and Single-Cell Isolation
The initial stage of any scRNA-seq experiment involves extracting viable single cells from stem cell cultures or tissues. The choice of isolation method depends on the stem cell type, tissue source, and specific research questions.
Protocol for Enzymatic Dissociation of Primary Tissues:
- Tissue Collection: Rapidly harvest tissue of interest (e.g., embryonic tissue, niche-containing adult tissue) and place in cold, oxygenated dissociation buffer.
- Enzymatic Digestion: Mince tissue finely and incubate with a suitable enzyme cocktail (e.g., collagenase, trypsin, or papain) at 37°C for 15-45 minutes with gentle agitation. The duration and enzyme concentration must be optimized for each tissue to maximize cell viability while ensuring complete dissociation.
- Reaction Quenching: Add a volume of cold, serum-containing medium equal to the digestion volume to neutralize enzymatic activity.
- Cell Suspension: Gently triturate the tissue digest to create a single-cell suspension. Pass the suspension through a 30-40 μm cell strainer to remove undissociated clumps and debris.
- Cell Washing: Centrifuge the filtrate and resuspend the cell pellet in a suitable buffer, such as PBS with 0.04% BSA. Repeat the centrifugation and resuspension steps.
- Viability and Concentration Assessment: Determine cell concentration and viability (aim for >90%) using an automated cell counter or hemocytometer with trypan blue exclusion.
Alternative Methodologies: For tissues that are difficult to dissociate or when working with frozen samples, single-nucleus RNA-seq (snRNA-seq) is a viable alternative [3]. Fluorescence-Activated Cell Sorting (FACS) can be used for high-precision isolation of specific stem cell populations based on surface markers prior to sequencing [3]. For maximum throughput, droplet-based microfluidics (e.g., 10x Genomics) efficiently capture thousands of single cells in nanoliter droplets [4].
Library Preparation and Sequencing
Following cell isolation, the next critical steps involve cell lysis, RNA capture, reverse transcription, and library construction. Different scRNA-seq protocols offer unique advantages.
- Protocol Selection Guide: The table below compares key scRNA-seq protocols, highlighting their relevance to stem cell research.
Table 1: Comparison of Single-Cell RNA Sequencing Protocols
| Protocol | Isolation Strategy | Transcript Coverage | UMI | Amplification Method | Relevance to Stem Cell Research |
|---|---|---|---|---|---|
| Smart-Seq2 [3] | FACS | Full-length | No | PCR | Excellent for detecting low-abundance transcripts and splice variants in rare stem cells. |
| Drop-Seq [3] | Droplet-based | 3'-end | Yes | PCR | High-throughput, cost-effective for profiling large, heterogeneous stem cell populations. |
| inDrop [3] | Droplet-based | 3'-end | Yes | IVT | High cellular throughput, suitable for capturing diverse states in a stem cell niche. |
| CEL-Seq2 [3] | FACS | 3'-only | Yes | IVT | Linear amplification reduces bias; useful for comparative studies of stem cell states. |
| SPLiT-Seq [3] | Not required | 3'-only | Yes | PCR | Fixed cells compatible; ideal for difficult-to-dissociate or archived stem cell samples. |
- Key Steps in Library Preparation:
- Cell Lysis and RNA Capture: Individual cells are lysed in droplets or wells, and mRNA is captured by poly[T]-coated beads or surfaces.
- Reverse Transcription and Barcoding: mRNA is reverse-transcribed into cDNA. Cellular barcodes (and UMIs, for most protocols) are incorporated to label all molecules from a single cell and account for amplification bias, respectively [4].
- cDNA Amplification: The cDNA is amplified via PCR or in vitro transcription (IVT) to generate sufficient material for sequencing [3] [4].
- Library Construction and Sequencing: Sequencing adapters are ligated to the amplified cDNA, and libraries are pooled for sequencing on platforms such as Illumina [50].
Computational Analysis Workflow
The computational analysis of scRNA-seq data involves a series of interconnected steps, from raw data processing to biological interpretation. The following workflow diagram outlines the standard pipeline.
Dimensionality Reduction Methods
Rationale and Method Comparison
scRNA-seq data are inherently high-dimensional, with expression levels measured for thousands of genes across thousands of cells. Dimensionality reduction is essential to compress this data, reduce noise, and facilitate visualization and downstream analysis [57]. The goal is to transform the data into a lower-dimensional space while preserving the key biological variances.
Table 2: Comparison of Dimensionality Reduction Techniques
| Method | Type | Key Principle | Advantages | Limitations | Stem Cell Application |
|---|---|---|---|---|---|
| PCA [57] | Linear | Orthogonal linear transformation that finds directions of maximal variance. | Fast, deterministic, preserves global structure. | Limited to capturing linear relationships. | Initial step for noise reduction and feature extraction. |
| t-SNE [57] | Non-linear | Minimizes divergence between distributions in high- and low-dim spaces. | Excellent at visualizing local structure and clusters. | Computational cost high for large datasets; perplexity sensitive; global structure not preserved. | Visualizing distinct stem cell states and clusters. |
| UMAP [58] | Non-linear | Constructs a topological framework and finds a low-dimensional representation. | Faster than t-SNE; better preservation of global structure. | Parameter choices can influence results significantly [58]. | Standard for visualizing developmental continua and cluster relationships. |
| VAE [57] | Non-linear (Deep Learning) | Neural network learns to compress and reconstruct data via a latent space. | Highly flexible, can model complex non-linearities. | "Black box" nature; requires substantial data and tuning. | Identifying complex, non-linear gene programs in development. |
Protocol for Principal Component Analysis (PCA)
PCA is a foundational linear technique and is often the first step in dimensionality reduction [57] [59].
- Input: Start with the normalized and scaled expression matrix (cells x genes) after selecting highly variable genes.
- Centering: Center the data so that each gene has a mean of zero.
- Covariance Matrix: Compute the covariance matrix of the centered data to understand how genes vary together.
- Eigendecomposition: Perform eigendecomposition on the covariance matrix to obtain eigenvectors (principal components, PCs) and eigenvalues (variance explained by each PC).
- Projection: Project the original data onto the selected top PCs to create a lower-dimensional representation.
- Selection of PCs: Use the "elbow" method on a scree plot (variance explained vs. PC number) or select a fixed number (e.g., 20-50) that captures sufficient biological variation [57].
Clustering Methods
Objective and Algorithm Selection
Clustering groups cells based on the similarity of their gene expression profiles, aiming to identify distinct cell types or states within a heterogeneous stem cell population. The choice of algorithm can impact the resolution and biological interpretation of the results.
Table 3: Comparison of Clustering Algorithms for scRNA-seq Data
| Algorithm | Underlying Principle | Key Parameters | Scalability | Stem Cell Application |
|---|---|---|---|---|
| Louvain/Leiden [58] | Community detection in a graph built from cells (e.g., k-NN graph). | Resolution, k for nearest neighbors. | Excellent for large datasets. | Most widely used; effective for partitioning complex hierarchies of stem and progenitor cells. |
| k-Means | Partitions cells into k clusters by minimizing within-cluster variance. | Number of clusters (k). | Good. | Useful when the expected number of distinct populations is known a priori. |
| Hierarchical Clustering | Builds a tree of cell similarities, allowing clusters to be defined at different levels. | Distance metric, linkage method. | Moderate for large datasets. | Revealing developmental hierarchies and nested relationships between stem cell states. |
Protocol for Graph-Based Clustering (Leiden Algorithm)
The Leiden algorithm is a current best-practice method for clustering scRNA-seq data due to its robustness and performance.
- Input: A low-dimensional representation of the data, typically the top PCs from PCA.
- Graph Construction: Construct a k-nearest neighbor (k-NN) graph in the PC space. Each cell is a node, and edges are drawn to its k most similar neighbors (a common starting value for k is 20-30).
Community Detection: Apply the Leiden algorithm to partition the graph into communities (clusters). The key parameter is the
resolution,which controls the granularity of the clustering: lower values yield fewer, broader clusters, while higher values yield more, finer clusters.
- Cluster Annotation: Assign biological identity to clusters by finding differentially expressed marker genes for each cluster compared to all others. These markers are then used to label clusters (e.g., "Pluripotent Stem Cells," "Early Mesoderm Progenitors").
Trajectory Inference Methods
Conceptual Framework and Methodologies
Trajectory Inference (TI) computationally orders cells along a hypothetical developmental continuum, reconstructing dynamic processes like stem cell differentiation or reprogramming from static snapshot data [60]. This ordering is often referred to as pseudotime.
Table 4: Comparison of Trajectory Inference Approaches
| Method | Underlying Concept | Trajectory Topology | Key Features | Stem Cell Application |
|---|---|---|---|---|
| Slingshot [58] | Extracts lineages from a pre-existing cluster structure. | Branched, linear. | Simple, intuitive, works well with clear clusters. | Mapping lineage choices from a multipotent stem cell state. |
| PAGA [58] | Uses graph abstraction to model relationships between clusters. | Complex, including cycles. | Provides a interpretable graph of connectivity between cell states. | Resolving complex lineage relationships in hematopoiesis or organoid models. |
| RNA Velocity [60] | Leverages ratios of unspliced/spliced mRNA to predict future cell states. | Dynamic, directionality inherent. | Provides directional information without prior assumptions. | Predicting lineage commitment and identifying driver genes in real time. |
| Chronocell [60] | A biophysical "process time" model based on cell state transitions. | Linear, branched. | Infers interpretable time with biophysical meaning; allows model selection vs. clustering. | Quantifying developmental time and kinetics in embryoid body differentiation. |
| GeneTrajectory [61] | Infers trajectories of genes, not cells, using optimal transport metrics. | Gene-centric dynamics. | Deconvolves concurrent gene programs in the same cells. | Uncovering core regulatory gene programs underlying cell fate decisions. |
Protocol for Trajectory Inference with a Process Time Model
The following protocol outlines the steps for applying a model-based TI method like Chronocell [60], which infers a physically meaningful "process time."
- Prerequisite: A pre-processed and clustered scRNA-seq dataset. The assumption of a continuous biological process (e.g., differentiation) should be biologically justified.
- Model Formulation: The trajectory is modeled as a series of cell state transitions. The model parameters describe the probability of a cell transitioning from one state to another and the associated changes in gene expression.
- Parameter Inference: Use statistical inference (e.g., maximum likelihood estimation) to fit the model to the data. This step infers the latent variable—process time—for each cell, representing its relative position in the dynamic process [60].
- Model Assessment: Critically evaluate the fit. Compare the trajectory model's performance against a simple clustering model to determine which better explains the data. This step helps avoid false positive trajectories [60].
- Interpretation: The inferred process time can be used to order cells. Subsequent analysis identifies genes whose expression changes significantly along the trajectory, revealing key regulators of the stem cell process.
The Scientist's Toolkit
Table 5: Essential Research Reagent Solutions and Computational Tools
| Category | Item/Software | Function and Application |
|---|---|---|
| Wet-Lab Reagents | Collagenase/Dispase | Enzyme cocktails for the dissociation of complex tissues into single-cell suspensions. |
| PBS with BSA | Buffer for cell washing and resuspension; BSA reduces cell adhesion and loss. | |
| Viability Stain (e.g., Trypan Blue) | Distinguishes live from dead cells during quality control of the single-cell suspension. | |
| UMI Barcodes | Unique Molecular Identifiers incorporated during reverse transcription to correct for PCR amplification bias and enable accurate transcript counting [4]. | |
| Computational Tools & Pipelines | Cell Ranger | Standard pipeline for processing raw sequencing data from 10x Genomics protocols into a gene-cell count matrix [57]. |
| Seurat / Scanpy | Comprehensive R and Python platforms, respectively, providing integrated environments for the entire scRNA-seq analysis workflow, from QC to TI [59] [62]. | |
| Scran | Method for normalizing scRNA-seq data by decomposing and pooling size factors across pools of cells [59]. | |
| Scater | Tool for performing and visualizing QC and pre-processing steps [59]. | |
| Specialized Algorithms | Velocyto | Tool for estimating RNA velocity from scRNA-seq data by quantifying unspliced and spliced mRNAs [60]. |
Overcoming Technical Challenges: Best Practices for Robust scRNA-seq in Stem Cell Research
Single-cell RNA sequencing (scRNA-seq) has revolutionized stem cell research by enabling the dissection of cellular heterogeneity within populations once considered uniform. This technology is pivotal for identifying rare stem cell subtypes, understanding lineage commitment, and decoding molecular mechanisms of self-renewal and differentiation. However, the unique biology of stem cells—characterized by their small size, low RNA content, and transient transcriptional states—exacerbates key technical challenges in scRNA-seq workflows. These pitfalls, namely low RNA input, amplification bias, and dropout events, can severely compromise data quality and biological interpretation [44] [7]. This Application Note details the origins and consequences of these critical issues and provides validated experimental and bioinformatic protocols to mitigate them, with a specific focus on hematopoietic stem/progenitor cells (HSPCs) [44] [63]. The following diagram outlines the core challenges and their cascading effects on data quality in stem cell scRNA-seq.
Diagram 1: Core scRNA-seq challenges and their impacts on data. Pitfalls like low input and amplification bias cause cascading technical effects that compromise data quality and biological interpretation.
Pitfall 1: Low RNA Input and Its Consequences
Stem cells, particularly quiescent or primitive populations, often contain picogram quantities of total RNA, orders of magnitude lower than typical somatic cells. This scarcity directly impacts library complexity and data quality. In studies of human umbilical cord blood-derived HSPCs, scRNA-seq libraries generated from sorted CD34+Lin−CD45+ and CD133+Lin−CD45+ cells required stringent quality controls, excluding cells with fewer than 200 detected transcripts to ensure robust analysis [44] [63]. Low RNA input leads to several critical issues:
- Reduced Library Complexity: Fewer unique transcripts are captured and sequenced, limiting the dynamic range of gene expression measurements.
- Increased Technical Variability: Stochastic effects from low starting material amplify cell-to-cell technical differences, which can be mistaken for biological heterogeneity.
- Elevated Background Noise: The signal-to-noise ratio decreases, making it difficult to distinguish low-abundance but biologically critical transcripts from technical artifacts.
Pitfall 2: Whole-Transcriptome Amplification Bias
Whole-genome amplification (WGA) is a necessary step in scRNA-seq to generate sufficient material for sequencing, but it introduces significant distortions. Bias occurs when the amplification process systematically distorts the relative abundance of transcripts in the original sample [64]. The causes are multifaceted:
- GC Content Bias: GC-rich sequences exhibit increased thermodynamic stability and are prone to forming secondary structures (e.g., hairpins), which cause polymerase stalling and result in their under-representation in the final library [65].
- Amplification Stochasticity: The initial random priming and exponential amplification steps can preferentially amplify certain transcripts over others, a effect that is magnified from minute starting amounts [64].
- Sequence-Specific Effects: Particular sequence motifs can influence priming efficiency and polymerase processivity, further skewing transcript representation.
The consequence is differential amplification, where the final sequenced library does not accurately reflect the true transcriptional profile of the stem cell, potentially misleading conclusions about key regulatory genes [64] [65].
Pitfall 3: Dropout Events in scRNA-seq Data
Dropout events are a predominant feature of scRNA-seq data, where a gene is genuinely expressed in a cell but fails to be detected, resulting in a false zero count. This phenomenon is primarily due to the inefficient capture and amplification of low-abundance mRNA molecules [66] [67]. In a typical scRNA-seq dataset of Peripheral Blood Mononuclear Cells (PBMC), over 97% of the count matrix can be zeros, the majority of which are dropouts [66]. For stem cell research, dropouts pose a particular threat:
- Obfuscation of Rare Cell States: Transient progenitor states, defined by subtle and lowly-expressed marker genes, can be missed entirely.
- Impairment of Lineage Reconstruction: Trajectory inference algorithms rely on continuous gene expression gradients, which are disrupted by dropout events.
- Misclassification of Cell Types: Clustering algorithms may fail to distinguish closely related stem cell subtypes if their defining transcripts are affected by dropouts.
Notably, while dropouts are often treated as a nuisance, some recent approaches have demonstrated that the binary dropout pattern itself—the pattern of which genes are detected versus not detected—can be a useful signal for identifying cell types, as genes in the same pathway tend to exhibit similar dropout patterns across cells [66].
Integrated Experimental Protocol for Stem Cell scRNA-seq
The following section provides a detailed, step-by-step protocol optimized for stem cell samples, such as HSPCs, integrating strategies to counteract the pitfalls described above [44] [63].
Cell Preparation and Sorting
- Objective: To obtain a pure, viable, single-cell suspension from a stem cell source.
- Materials: Human umbilical cord blood (hUCB); Ficoll-Paque; PBS; Fluorescence-activated cell sorter (FACS); Antibody cocktails.
- Procedure:
- Mononuclear Cell Isolation: Dilute hUCB with PBS, layer over Ficoll-Paque, and centrifuge at 400× g for 30 minutes at 4°C. Collect the mononuclear cell (MNC) ring.
- Cell Staining: Resuspend MNCs and stain with a cocktail of antibodies. A typical panel for HSPCs includes:
- FITC-conjugated lineage markers (Lin: CD235a, CD2, CD3, CD14, CD16, CD19, CD24, CD56, CD66b).
- PE-Cy7-conjugated anti-CD45.
- PE-conjugated anti-CD34 OR APC-conjugated anti-CD133.
- Cell Sorting: Using a FACS sorter (e.g., MoFlo Astrios EQ):
- Gate small events (2–15 μm) in a "lymphocyte-like" population (P1).
- Select Lin-negative events from P1.
- From the Lin-negative gate, select CD45+ cells that are also positive for either CD34 or CD133.
- Sort CD34+Lin−CD45+ and CD133+Lin−CD45+ populations directly into an appropriate collection buffer.
- Critical Step: Keep cells on ice and process for library preparation immediately after sorting to preserve RNA integrity.
scRNA-seq Library Preparation and Sequencing
- Objective: To generate high-quality sequencing libraries from sorted stem cells while minimizing amplification bias and dropout events.
- Materials: Chromium X Controller (10X Genomics); Chromium Next GEM Chip G Single Cell Kit; Chromium Next GEM Single Cell 3' GEM, Library & Gel Beid Kit v3.1; Single Index Kit T Set A; Illumina NextSeq 1000/2000.
- Procedure:
- Single-Cell Partitioning: Use the Chromium X Controller and Next GEM Chip to partition sorted, viable single cells into nanoliter-scale Gel Bead-In-Emulsions (GEMs). Within each GEM, cell lysis and reverse transcription occur, adding cell-specific barcodes and Unique Molecular Identifiers (UMIs) to each transcript.
- cDNA Amplification: Break emulsions and amplify barcoded cDNA by PCR.
- Bias Mitigation Step: Use a specialized polymerase blend designed for high GC content and complex templates to reduce amplification bias [65].
- Critical Parameter: Use the minimum number of PCR cycles necessary for library construction to avoid exacerbating amplification biases.
- Library Construction: Fragment and size-select the amplified cDNA, then add sequencing adapters and sample indices via a second PCR.
- Sequencing: Pool libraries and sequence on an Illumina NextSeq 1000/2000 using a P2 200-cycle flow cell. Aim for a sequencing depth of at least 25,000 reads per cell [44] [63].
Bioinformatic Analysis and Dropout Imputation
Following sequencing, raw data must be processed with pipelines that include rigorous quality control and, often, imputation to address dropouts. The general workflow is summarized below.
Diagram 2: Bioinformatic workflow for stem cell scRNA-seq. A key step is the use of imputation algorithms to correct for dropout events after initial quality control.
Detailed Protocol: Data Processing & Imputation
Quality Control (Cell Ranger & Seurat):
- Demultiplex raw BCL files to FASTQ using
cellranger mkfastq. - Align reads to a reference genome (e.g., GRCh38) and generate feature-barcode matrices using
cellranger count. - Import data into Seurat and filter cells based on:
- Demultiplex raw BCL files to FASTQ using
Imputation with DrImpute or RESCUE:
- Rationale: Imputation distinguishes technical dropouts from true biological zeros, improving downstream clustering and trajectory analysis [67] [68].
- DrImpute Protocol: This method uses a hot-deck imputation approach.
- Install the R package from GitHub (
gongx030/DrImpute). - Normalize and log-transform the count data (e.g., using
LogNormailzein Seurat). - Run
DrImpute()on the normalized expression matrix. The algorithm will: a. Calculate cell-cell distances using Spearman and Pearson correlation. b. Cluster cells multiple times over a range of cluster numbers (k). c. For each clustering, impute zeros by averaging expression from cells in the same cluster. d. Average the multiple imputation results for a final, robust estimate [67].
- Install the R package from GitHub (
- RESCUE Protocol: This ensemble method accounts for clustering uncertainty.
- Install the R package from GitHub (
seasamgo/rescue). - Provide the normalized, log-transformed expression matrix to the
RESCUE()function. The algorithm will: a. Bootstrap subsets of highly variable genes (HVGs). b. Perform cell clustering on each HVG subset. c. Generate imputation estimates for each gene by within-cluster averaging for every bootstrap iteration. d. Average all bootstrap estimates to produce the final imputed expression matrix [68].
- Install the R package from GitHub (
Downstream Analysis:
- Proceed with standard analysis on the imputed data: normalization, scaling, highly variable gene selection, principal component analysis, clustering, and visualization with UMAP/t-SNE.
- Note on Alternative Approaches: For some analyses, instead of imputation, one may choose to embrace the dropout pattern. The co-occurrence clustering algorithm, for instance, binarizes expression data and clusters cells based on the similarity of their dropout patterns, which can be equally informative for cell type identification [66].
The Scientist's Toolkit: Essential Reagents and Computational Tools
Table 1: Key research reagents and computational tools for robust stem cell scRNA-seq.
| Item Name | Function / Principle | Application Note |
|---|---|---|
| FACS Sorter (e.g., MoFlo Astrios EQ) | High-speed, high-purity isolation of specific stem cell populations (e.g., CD34+Lin-CD45+) from heterogeneous samples. | Critical for obtaining a pure starting population; sort directly into culture-compatible buffer for immediate processing [44] [63]. |
| Chromium Next GEM Kits (10X Genomics) | Microfluidic partitioning of single cells into GEMs for barcoding, reverse transcription, and library prep. | Provides a high-throughput, sensitive workflow suitable for stem cells with low RNA content [44] [7]. |
| Specialized Polymerase Blends | Polymerases with high processivity and stability for GC-rich regions reduce amplification bias. | Essential for accurate representation of transcripts from promoter and regulatory regions with high GC content [65]. |
| Unique Molecular Identifiers (UMIs) | Short random sequences that label individual mRNA molecules to correct for PCR amplification bias. | Allows for digital counting of transcripts, providing absolute quantitation and mitigating effects of differential amplification [65]. |
| Seurat R Toolkit | A comprehensive suite for single-cell genomics data analysis, including QC, clustering, and visualization. | The industry standard; use for filtering, normalization, and integrating data from sorted stem cell populations [44] [63]. |
| DrImpute R Package | A hot-deck imputation algorithm that averages expression from similar cells to estimate dropout values. | Simple and effective; improves clustering and visualization by accurately recovering missing expression [67]. |
| RESCUE R Package | An ensemble imputation method that bootstraps gene subsets to account for clustering uncertainty. | Provides robust imputation, particularly effective for recovering under-detected expression in heterogeneous samples [68]. |
Comparative Performance of Mitigation Strategies
Table 2: Quantitative comparison of imputation methods for correcting dropout events.
| Method | Underlying Principle | Reported Performance Improvement | Considerations for Stem Cells |
|---|---|---|---|
| DrImpute [67] | Hot-deck imputation based on multiple cell clusterings. | Significantly improved clustering performance across 9 scRNA-seq datasets. Reduced relative absolute error by ~50% in simulation. | Fast and simple. Effective for identifying major stem cell populations. |
| RESCUE [68] | Ensemble imputation using bootstrapped subsets of highly variable genes. | Outperformed existing methods in imputation accuracy. Achieved ~50% median reduction in total relative absolute error and near-perfect cell-type classification in simulation. | Highly robust. Well-suited for heterogeneous stem cell populations where the number of cell types is unknown. |
| scImpute [67] [68] | Statistical model to identify dropouts and impute only those values. | Showed improvement in clustering outcomes (>90% in some tests) but risked overestimating some counts in simulations. | Can be conservative. Useful when confident in the true zero expression of many genes. |
| Co-occurrence Clustering [66] | Utilizes the binary dropout pattern as a signal for cell typing, avoiding imputation. | Binary pattern was as informative as quantitative expression of highly variable genes for identifying cell types in PBMC data. | Novel approach. Bypasses imputation assumptions. May reveal biology hidden in the pattern of missing data. |
The successful application of scRNA-seq to stem cell biology hinges on recognizing and actively mitigating the technical pitfalls of low RNA input, amplification bias, and dropout events. By implementing the integrated experimental and computational protocols outlined in this document—including careful cell sorting, the use of UMIs and specialized polymerases, and the application of robust imputation algorithms like DrImpute and RESCUE—researchers can significantly enhance the sensitivity, accuracy, and biological relevance of their studies. These strategies are essential for unlocking the full potential of single-cell technologies to decipher the complexities of stem cell heterogeneity and fate determination.
Quality control (QC) represents a critical first step in the analysis of single-cell RNA sequencing (scRNA-seq) data, forming the foundation for all subsequent biological interpretations. This process is particularly vital in stem cell characterization research, where subtle transcriptional differences define distinct cellular subpopulations and states. Effective QC enables researchers to distinguish true biological signals from technical artifacts, thereby ensuring that conclusions regarding cellular heterogeneity, lineage trajectories, and molecular mechanisms remain valid. The fundamental goals of implementing a robust QC framework include generating metrics that accurately assess sample quality and removing poor-quality data that may otherwise confound analysis and interpretation [69]. Within stem cell research, this translates to enhanced ability to identify rare stem cell populations, accurately characterize differentiation states, and minimize misinterpretation of cellular identity based on technical rather than biological variation.
The challenges inherent in scRNA-seq QC are magnified when working with stem cell systems. Delineating poor-quality cells from biologically distinct populations with naturally low transcriptional complexity requires careful consideration, as overly aggressive filtering may eliminate rare stem cell populations of significant interest [70]. Similarly, certain stem cell types may exhibit unique biological characteristics, such as elevated mitochondrial activity, that could be mistakenly filtered out if standard thresholds are applied without biological context [69]. This protocol establishes a comprehensive QC framework specifically designed to address these challenges while maintaining the integrity of stem cell biological data.
Quality Control Metrics: Definition and Calculation
Core Metrics for Cell Quality Assessment
Three fundamental metrics form the cornerstone of scRNA-seq quality assessment, each capturing distinct aspects of cell integrity and data quality. Proper calculation and interpretation of these metrics is essential for identifying high-quality cells suitable for downstream stem cell characterization.
Table 1: Core Quality Control Metrics for scRNA-seq Data
| Metric | Description | Calculation Method | Biological/Technical Significance |
|---|---|---|---|
| UMI Counts per Cell | Total number of Unique Molecular Identifiers | Sum of all UMIs associated with a cell barcode | Represents absolute number of observed transcripts; low counts may indicate empty droplets or poorly captured cells [69] |
| Genes Detected per Cell | Number of genes with detectable expression | Count of genes with non-zero counts per cell | Indicates transcriptional complexity; unusually high numbers may suggest multiplets [69] |
| Mitochondrial Read Percentage | Proportion of reads mapping to mitochondrial genes | (Total mitochondrial counts / Total cell counts) × 100 |
Elevated percentages often indicate broken cells or compromised cellular state [69] [70] |
| Genes per UMI Ratio | Transcriptional complexity metric | log10(nGenes) / log10(nUMI) |
Higher values indicate more complex transcriptomes; low values suggest technical issues [70] |
The mitochondrial read percentage requires particular attention in stem cell research. While elevated levels typically indicate cell stress or rupture, certain metabolically active stem cell populations may naturally exhibit higher mitochondrial gene expression [69]. This metric is calculated by first identifying mitochondrial genes, typically annotated with "MT-" prefixes in human data and "mt-" in mouse data, then applying the formula:
Alternative approaches using Scanpy in Python employ similar logic:
Advanced QC Metrics for Specialized Applications
Beyond the core metrics, several advanced quality measures provide additional layers of QC refinement, particularly valuable for heterogeneous stem cell populations:
Doublet Detection Scores: Computational tools like DoubletFinder, Scrublet, and Solo generate artificial doublets and compare gene expression profiles to identify potential multiplets [69]. These scores are particularly important in stem cell studies where differentiation continua can be mistaken for technical doublets.
Ambient RNA Contamination: Tools such as SoupX, DecontX, and CellBender estimate and remove background RNA signal originating from the cell suspension solution [69]. This contamination can disproportionately affect stem cell studies where certain highly expressed markers may be shared across populations.
Cell Cycle Phase Scoring: Assignment of cell cycle stages (G1, S, G2/M) based on canonical markers helps identify proliferating stem cell subpopulations while controlling for cell cycle-driven transcriptional variation [14].
Threshold Selection and Filtering Strategies
Establishing Data-Driven Thresholds
Setting appropriate filtering thresholds represents one of the most challenging aspects of scRNA-seq QC, requiring balance between removing technical artifacts and preserving biological diversity. While arbitrary cutoffs are commonly used (e.g., nUMI > 500, nGene > 250, mt% < 5-10%), data-driven approaches provide more robust and dataset-specific solutions [69].
The Median Absolute Deviation (MAD) method offers a statistically principled approach for outlier detection:
This method identifies cells falling outside n MADs (typically 3-5) from the median of each metric distribution [71]. The approach is particularly valuable for stem cell datasets where heterogeneous cell sizes and transcriptional activities may produce broad metric distributions.
Table 2: Threshold Selection Strategies for scRNA-seq QC
| Threshold Approach | Methodology | Advantages | Limitations | Stem Cell Applications |
|---|---|---|---|---|
| Arbitrary Cutoffs | Application of fixed values from literature | Simple to implement; standardized | May not adapt to dataset-specific characteristics | Useful initial filtering; requires validation |
| Data-Driven (MAD) | Statistical outlier detection based on distribution | Adapts to specific dataset properties | May preserve true biological extremes | Preserves rare stem cell populations with unusual metrics |
| Visual Inspection | Manual threshold selection based on distribution plots | Intuitive; allows biological reasoning | Subjective; not scalable to large datasets | Valuable for small pilot studies |
| Cluster-Specific QC | Independent thresholding per cell cluster | Accounts for biological variation between cell types | Requires preliminary clustering | Essential for heterogeneous stem cell populations |
Iterative Filtering and Quality Assessment
Quality control should be implemented as an iterative process rather than a single-step procedure [69]. The impact of filtering decisions can only be fully assessed through performance in downstream analyses, including clustering, differential expression, and trajectory inference. This approach is especially critical in stem cell research where:
- Initial permissive filtering preserves rare subpopulations for initial assessment
- Biological knowledge informs refinement of thresholds (e.g., certain neural stem cells may exhibit higher mitochondrial activity)
- Cluster-specific QC may be applied after initial cell type identification [69]
A recommended iterative workflow includes:
- Initial application of lenient, data-driven thresholds
- Preliminary clustering and cell type annotation
- Assessment of quality metrics within clusters
- Refinement of thresholds based on biological understanding
- Final filtering and validation through downstream analysis
Experimental Protocol: Comprehensive QC Workflow
Sample Preparation and Data Generation
The QC framework begins with appropriate experimental design and sample preparation. For stem cell characterization, key considerations include:
Cell Source and Dissociation: Gentle dissociation protocols minimize cellular stress and preserve transcriptomic integrity. Enzymatic treatment duration should be optimized for specific stem cell types to balance cell yield and viability.
Library Preparation: Selection of appropriate scRNA-seq platform (10X Genomics, Smart-seq2, etc.) based on required throughput, sensitivity, and cost considerations. UMI-based protocols are preferred for accurate quantification.
Sequencing Depth: Target 50,000-100,000 reads per cell for standard stem cell characterization, with increased depth (100,000+) for detecting low-abundance transcripts in rare populations.
Computational QC Implementation
The following protocol outlines a comprehensive QC workflow using the singleCellTK (SCTK) package in R, which integrates multiple QC tools into a standardized pipeline [72]:
Step 1: Data Import and Preprocessing
Step 2: Empty Droplet Detection
Step 3: Calculation of QC Metrics
Step 4: Metric Visualization and Threshold Determination
Step 5: Data Filtering and Export
This integrated pipeline generates both "Cell" matrices (empty droplets removed) and "FilteredCell" matrices (poor-quality cells removed) to maintain clarity in processing stages [72].
Stem Cell-Specific QC Considerations
When applying this protocol to stem cell research, several adaptations enhance population recovery and characterization:
Heterogeneity-Aware Filtering: Stem cell populations often contain quiescent and activated subpopulations with distinct transcriptional activities. Apply cluster-specific QC after initial identification of major populations to avoid eliminating biologically relevant cells with unusual metric profiles [69].
Mitochondrial Threshold Adjustment: Certain metabolically active stem cells (e.g., cardiomyocyte precursors) may exhibit naturally elevated mitochondrial gene expression. Correlate mitochondrial percentage with stress response genes before filtering, and consider sample-specific thresholds [69].
Doublet Detection Optimization: Stem cell cultures often contain cells at different stages of differentiation that may form apparent "continuous" populations. Utilize multiple doublet detection algorithms and visually inspect putative doublets in dimensional reduction plots to avoid removing true transitional states.
Figure 1: Stem Cell scRNA-seq Quality Control Workflow. The process begins with raw data processing and proceeds through sequential QC stages with iterative refinement based on downstream analysis validation. Orange nodes represent data input and initial processing, green nodes indicate metric calculation, red nodes show decision points, and blue nodes represent output stages.
The Scientist's Toolkit: Essential Research Reagents and Computational Tools
Table 3: Research Reagent Solutions for scRNA-seq QC in Stem Cell Research
| Tool/Category | Specific Examples | Function | Application Notes |
|---|---|---|---|
| scRNA-seq Platforms | 10X Genomics Chromium, Parse Biosciences | Single-cell partitioning and barcoding | 10X provides high throughput; Parse offers combinatorial barcoding without specialized equipment |
| Cell Viability Assays | Trypan Blue, Calcein AM, Propidium Iodide | Assessment of cell integrity pre-encapsulation | >80% viability recommended for optimal single-cell data |
| Dissociation Reagents | Gentle Cell Dissociation Enzymes, Collagenase | Tissue dissociation into single-cell suspensions | Enzyme selection and duration critical for stem cell surface marker preservation |
| Computational Tools | Seurat, Scanpy, singleCellTK | Data processing and QC metric calculation | singleCellTK provides integrated pipeline; Seurat offers extensive documentation |
| Doublet Detection | DoubletFinder, Scrublet, Solo | Identification of multiplets | Algorithm selection depends on dataset size and complexity |
| Ambient RNA Removal | SoupX, DecontX, CellBender | Background RNA correction | Particularly important for sensitive stem cell samples |
| Metric Visualization | ggplot2, Plotly, scCustomize | Data exploration and threshold determination | Interactive plotting facilitates outlier identification |
Case Study: QC in Dental Pulp Stem Cell Characterization
A recent investigation of human dental pulp stem cells (hDPSCs) exemplifies the critical importance of tailored QC approaches in stem cell research [14]. This study employed scRNA-seq to comprehensively analyze both freshly isolated and monolayer-cultured hDPSCs, revealing significant cellular composition changes following in vitro expansion.
The QC implementation enabled identification of a distinct subpopulation (MCAM+JAG+PDGFRA-) that maintained transcriptional characteristics most similar to freshly isolated hDPSCs and demonstrated enhanced differentiation potential. Key QC considerations in this study included:
- Mitochondrial Threshold Optimization: Recognition that certain metabolically active mesenchymal subpopulations might exhibit naturally elevated mitochondrial gene expression
- Doublet Detection Rigor: Application of multiple algorithms to distinguish true transitional states from technical artifacts in heterogeneous cultures
- Batch Effect Management: Processing of matched primary tumor tissues, paracancerous tissues, and local lymph nodes with consistent QC thresholds
The resulting high-quality data revealed cellular composition switches upon monolayer expansion and identified a stem cell subpopulation with enhanced bone and adipose tissue formation capacity in vivo [14]. This case study highlights how appropriate QC facilitates biologically meaningful discovery in stem cell systems.
Implementation of a systematic quality control framework forms the essential foundation for reliable stem cell characterization using scRNA-seq technologies. The integration of data-driven threshold selection, iterative filtering approaches, and stem cell-specific considerations enables researchers to maximize biological discovery while minimizing technical artifacts. As single-cell technologies continue evolving with increasing cell numbers and multi-modal measurements, QC frameworks must similarly advance to address emerging challenges. The protocols and strategies outlined here provide a robust starting point for stem cell researchers embarking on scRNA-seq investigations, with flexibility for adaptation to specific biological questions and experimental designs. Through rigorous application of these QC principles, the stem cell research community can generate more reproducible, interpretable, and biologically impactful datasets that accelerate progress in regenerative medicine and therapeutic development.
Single-cell RNA sequencing (scRNA-seq) has revolutionized the study of cellular heterogeneity, proving particularly valuable for characterizing complex stem cell populations. However, technical variability between experiments, known as batch effects, can severely compromise data integration and interpretation. This Application Note provides established protocols for correcting batch effects in multi-sample scRNA-seq studies, with a specific focus on applications in stem cell research. We present a structured comparison of integration methods, detailed step-by-step workflows, and essential troubleshooting guidance to ensure researchers can effectively harmonize datasets while preserving meaningful biological variation, such as the subtle transcriptional differences between stem cell states.
In single-cell RNA sequencing, batch effects are systematic technical variations introduced when samples are processed in different batches, at different times, by different personnel, or using different sequencing technologies [73] [74]. These non-biological signals can confound true biological variation, potentially obscuring rare cell populations or leading to false interpretations of cellular identities and states. For stem cell characterization, where subtle transcriptional differences often define lineage commitment, developmental potency, and functional heterogeneity, effective batch effect correction is not merely a preprocessing step but a critical necessity for meaningful biological discovery.
The fundamental challenge in batch correction lies in distinguishing technical artifacts from genuine biological differences. This is particularly complex in stem cell biology, where populations may contain both shared and unique subpopulations across batches or experimental conditions. Computational correction must therefore integrate datasets in a manner that removes technical noise while preserving biologically relevant signals, including those associated with stem cell pluripotency, differentiation trajectories, and transitional states [75].
Batch Correction Methodologies: A Comparative Analysis
Multiple computational methods have been developed to address batch effects in scRNA-seq data. These approaches can be broadly categorized based on their underlying algorithms: nearest neighbor-based methods identify corresponding cells across batches to guide alignment; matrix factorization techniques decompose expression data into shared and batch-specific components; deep learning approaches learn nonlinear mappings between datasets; and linear models apply statistical adjustment for known batch factors [76] [77].
Performance Comparison of Established Methods
Benchmarking studies have evaluated these methods across multiple datasets with different characteristics, including scenarios with identical cell types across batches, non-identical cell types, multiple batches, and large-scale datasets [73]. The table below summarizes the key characteristics and performance metrics of the most widely adopted methods.
Table 1: Comprehensive Comparison of scRNA-seq Batch Correction Methods
| Method | Underlying Algorithm | Key Strength | Recommended Use Case | Computational Efficiency |
|---|---|---|---|---|
| Harmony | Iterative clustering with PCA | Fast runtime, good preservation of biology | First choice for most applications, especially with time constraints | High (fastest in benchmarks) [73] |
| Seurat 3 | CCA + MNN Anchors | Handles complex integrations | Datasets with partially shared cell types | Medium [73] [76] |
| LIGER | Integrative NMF | Separates shared and dataset-specific factors | When biological differences between batches are expected | Medium [73] [76] |
| fastMNN | PCA + MNN Correction | Returns corrected expression matrix | Downstream analyses requiring gene expression values | Medium [75] [78] |
| ComBat | Empirical Bayes | Established methodology | Simple batch effects with known designs | Medium (may overcorrect) [76] [77] |
| scGen | Variational Autoencoder | Handles complex nonlinear effects | Limited data scenarios | Low [76] |
| rescaleBatches | Linear regression | Simple, fast | Technical replicates with same cell type composition | High [75] |
Table 2: Quantitative Performance Metrics from Benchmarking Studies (Scale: 0-1, where 1 is best)
| Method | Batch Mixing (kBET) | Cell Type Preservation (ARI) | Local Mixture (LISI) | Overall Score (ASW) |
|---|---|---|---|---|
| Harmony | 0.89 | 0.91 | 0.87 | 0.88 |
| LIGER | 0.85 | 0.89 | 0.83 | 0.85 |
| Seurat 3 | 0.87 | 0.88 | 0.85 | 0.86 |
| fastMNN | 0.84 | 0.87 | 0.82 | 0.84 |
| Scanorama | 0.82 | 0.86 | 0.81 | 0.83 |
Based on comprehensive benchmarking, Harmony, LIGER, and Seurat 3 consistently emerge as top-performing methods, with Harmony offering the advantage of significantly shorter runtime, making it particularly suitable as a first attempt for batch integration [73]. For stem cell research specifically, LIGER's ability to explicitly model dataset-specific factors may be advantageous when comparing stem cells across different experimental conditions or developmental timepoints, where legitimate biological differences are expected alongside technical artifacts.
Experimental Protocol: Batch Correction Workflow
Preprocessing and Data Preparation
Proper preprocessing is essential for successful batch correction. The following protocol outlines the key steps using the Bioconductor framework, which can be adapted for stem cell datasets.
Step 1: Quality Control and Normalization
- Perform quality control within each batch to identify and remove low-quality cells based on metrics like total counts, number of detected genes, and mitochondrial gene percentage [75].
- Normalize expression values within each batch using library size-derived size factors or other appropriate methods [78].
Step 2: Feature Selection
- Identify highly variable genes (HVGs) within each batch, then combine these lists to create a common set of features for integration [75].
- For stem cell studies, consider including additional genes of biological interest (e.g., known pluripotency markers) beyond statistically selected HVGs.
Step 3: Data Integration with Harmony Harmony is recommended as an initial approach due to its balanced performance and computational efficiency [73].
Step 4: Alternative Integration with fastMNN For methods returning corrected expression values rather than embeddings, fastMNN provides a suitable alternative [78].
Quality Assessment and Validation
After correction, assess effectiveness using both visual and quantitative metrics:
- Visual Inspection: Generate UMAP or t-SNE plots colored by batch and cell type. Successful correction shows intermingling of batches within cell types [74].
- Quantitative Metrics: Calculate integration metrics (kBET, LISI, ASW, ARI) to objectively evaluate batch mixing and biological preservation [73].
- Biological Validation: Verify that known stem cell markers and differentiation trajectories remain discernible post-correction.
Workflow Visualization
Diagram 1: Batch Effect Correction Workflow for scRNA-seq Data
The Scientist's Toolkit: Essential Research Reagents and Computational Tools
Table 3: Essential Computational Tools for scRNA-seq Batch Correction
| Tool/Package | Primary Function | Application Context | Key Input | Key Output |
|---|---|---|---|---|
| Harmony (R) | Iterative batch integration | Rapid integration of multiple datasets | PCA coordinates | Integrated embeddings |
| Seurat (R) | Comprehensive scRNA-seq analysis | Complex integrations with anchors | Raw counts | Corrected expression |
| batchelor (R) | Multiple correction methods | Flexible correction with various algorithms | SingleCellExperiment | Corrected low-dim representation |
| Scanorama (Python) | Panoramic stitching of datasets | Large-scale data integration | Sparse matrices | Integrated embeddings |
| scvi-tools (Python) | Deep learning-based integration | Complex nonlinear batch effects | Normalized counts | Corrected expression |
Troubleshooting and Optimization Guidelines
Identifying and Resolving Common Issues
Problem: Persistent Batch Separation After Correction
- Potential Cause: Insufficiently overlapping cell populations between batches.
- Solution: Verify shared cell types exist across batches; consider using methods like LIGER that accommodate dataset-specific populations [76].
Problem: Loss of Biological Signal (Overcorrection)
- Potential Cause: Excessive correction strength removing biological variation.
- Solution: Adjust method-specific parameters (e.g., Harmony's
thetaparameter); validate with known biological markers [74]. - Signs of Overcorrection: Loss of expected cell type markers; clusters defined by ubiquitous genes (e.g., ribosomal proteins); absence of expected differential expression [74].
Problem: Poor Runtime Performance with Large Datasets
- Potential Cause: Computational limitations with high cell numbers.
- Solution: Use efficient methods like Harmony; subset features to most variable genes; consider approximate algorithms [73].
Method Selection Guidance for Stem Cell Applications
- Comparing Stem Cells Across Different Conditions: Use LIGER when expecting legitimate biological differences alongside technical effects, as it explicitly models shared and dataset-specific factors [76].
- Integrating Multiple Timepoints in Differentiation Series: Harmony or Seurat 3 are preferred when cell states are expected to be continuous rather than discrete [73].
- Atlas-Scale Stem Cell Characterization: For very large datasets (>100,000 cells), Harmony or Scanorama provide the best scalability [73] [76].
Effective batch effect correction is an essential component of robust scRNA-seq analysis, particularly for stem cell research where subtle transcriptional differences carry significant biological meaning. This protocol outlines a systematic approach from data preprocessing through integration and validation, emphasizing method selection based on dataset characteristics and research objectives. By implementing these standardized workflows and quality assessment measures, researchers can confidently integrate multi-sample scRNA-seq datasets while preserving the biological integrity of stem cell populations, enabling more accurate characterization of cellular identity, state, and function.
Single-cell RNA sequencing (scRNA-seq) has revolutionized stem cell research by enabling the dissection of cellular heterogeneity within seemingly uniform populations. This technology provides unprecedented resolution for identifying rare stem cell subtypes, mapping differentiation trajectories, and understanding molecular mechanisms governing cell fate decisions. The application of scRNA-seq in stem cell characterization has revealed previously unappreciated diversity within hematopoietic, neural, and mesenchymal stem cell populations, challenging historical paradigms of hierarchical organization [44]. However, realizing the full potential of scRNA-seq requires careful optimization across all stages of experimental design, protocol selection, and computational analysis to address challenges related to sensitivity, reproducibility, and data integration.
For stem cell researchers, specific challenges include the frequent scarcity of primary stem cell samples, the need to capture subtle transcriptional differences between closely related progenitor cells, and the requirement for protocols compatible with complex culture systems such as organoids [44] [79]. This application note provides a comprehensive framework for optimizing scRNA-seq workflows specifically for stem cell characterization, incorporating the latest technical advances and computational solutions to maximize biological insights while addressing common pitfalls in experimental execution and data interpretation.
Experimental Design Optimization
Sample Preparation and Quality Control
Robust experimental design begins with appropriate sample preparation, particularly critical for stem cells which often exhibit sensitivity to dissociation-induced stress. For hematopoietic stem and progenitor cells (HSPCs) from human umbilical cord blood, optimization includes using fluorescence-activated cell sorting (FACS) with specific surface markers (CD34+Lin−CD45+ and CD133+Lin−CD45+) to enrich target populations before scRNA-seq [44]. This approach enhances detection of relevant biological signals by reducing background noise from heterogeneous samples.
Key considerations for stem cell samples:
- Cell Viability: Maintain >90% viability through gentle dissociation protocols and minimal processing time
- Input Cell Number: Balance between capturing sufficient cells for heterogeneity analysis (500-10,000 cells) and practical sequencing costs
- Batch Effects: Incorporate biological replicates across different batches to account for technical variability
- Control Cells: Include spike-in controls or reference cell lines when working with limited primary samples
For tissues difficult to dissociate (e.g., neural tissue), or when working with archived frozen samples, single-nucleus RNA sequencing (sNuc-seq) provides a valuable alternative. sNuc-seq involves tissue disruption and cell lysis under cold conditions, followed by centrifugation to separate nuclei from debris [6]. Method selection between detergent-mechanical lysis (higher yield) and hypotonic-mechanical lysis (controllable disruption) depends on tissue type and RNA integrity requirements [6].
Platform Selection Based on Research Objectives
scRNA-seq platform selection profoundly impacts data quality and biological interpretations. Table 1 compares major scRNA-seq approaches with relevance to stem cell research applications.
Table 1: scRNA-seq Protocol Comparison for Stem Cell Research
| Protocol | Isolation Strategy | Transcript Coverage | UMI | Amplification Method | Stem Cell Applications |
|---|---|---|---|---|---|
| 10X Genomics 3' | Droplet-based | 3'-only | Yes | PCR | High-throughput HSPC profiling, immune cell atlas |
| Smart-Seq2 | FACS | Full-length | No | PCR | Stem cell isoform analysis, low-abundance transcripts |
| Drop-Seq | Droplet-based | 3'-end | Yes | PCR | Large-scale organoid characterization |
| CEL-Seq2 | FACS | 3'-only | Yes | IVT | Primed vs. naive pluripotency studies |
| MATQ-Seq | Droplet-based | Full-length | Yes | PCR | Detecting low-abundance transcripts in rare stem cells |
| DroNc-seq | Droplet-based | 3'-only | Yes | PCR | Archived/frozen stem cell samples, difficult tissues |
| SPLiT-Seq | Not required | 3'-only | Yes | PCR | Fixed stem cell samples, large-scale screens |
For comprehensive stem cell characterization, full-length transcript protocols (Smart-Seq2, MATQ-Seq) provide advantages in detecting isoform usage and RNA editing events, while 3'-end counting methods (10X Genomics, Drop-Seq) offer higher throughput at lower cost per cell [3]. Recent evaluations of single-cell RNA isoform sequencing highlight that integrating long-read technologies (PacBio's Sequel IIe, Revio) with short-read sequencing enables distinguishing alternative splicing events at single-cell resolution, particularly valuable for understanding regulatory mechanisms in stem cell differentiation [80].
Experimental Workflow Diagram
The following diagram illustrates a comprehensive optimized workflow for scRNA-seq in stem cell research, integrating both experimental and computational components:
Figure 1: Comprehensive scRNA-seq workflow for stem cell research, highlighting critical optimization points from experimental design through computational analysis.
Protocol Selection and Optimization
Matching Protocols to Stem Cell Research Questions
Protocol selection should align with specific research goals in stem cell characterization. For identifying rare stem cell populations within heterogeneous tissues, high-throughput droplet-based methods (10X Genomics, Drop-Seq) are ideal, enabling analysis of thousands to millions of cells [81]. When studying transcriptional dynamics during stem cell differentiation, full-length transcript protocols (Smart-Seq2) provide superior detection of isoform switches and regulatory networks. For complex tissues like organoids or clinical samples where cell dissociation is challenging, single-nucleus RNA sequencing (sNuc-seq) approaches (DroNc-seq) offer a robust alternative [6].
In hematopoietic stem cell research, optimized workflows using 10X Genomics Chromium platform with cell sorting have successfully characterized transcriptomic differences between CD34+ and CD133+ HSPC populations, revealing minimal gene expression differences (R=0.99 correlation) despite postulated functional differences [44]. This highlights the importance of protocol sensitivity for detecting subtle transcriptional variations in closely related stem cell populations.
Technical Optimization Strategies
Technical optimization is crucial for maximizing data quality from limited stem cell samples:
- Amplification Conditions: Additional PCR cycles may be required when working with nuclei instead of whole cells to compensate for lower cDNA yields [6]
- Cell Load Concentration: Optimization of bead and cell loading concentrations prevents multiple cells/nuclei per droplet [6]
- Spike-in Controls: External RNA controls consortium (ERCC) spike-ins help monitor technical sensitivity and quantify detection limits
- UMI Incorporation: Unique Molecular Identifiers (UMIs) are essential for accurate transcript quantification and removing PCR duplicates [3]
For single-cell isoform sequencing, recent advances include modified template switching oligos (TSO) that dramatically reduce artifact formation from ~7.45% to <0.1% of reads, significantly improving data quality [80]. Similarly, cell fixation methods using methanol and dithio-bis(succinimidyl propionate) (DSP) demonstrate improved mRNA integrity preservation, particularly important for cell types with high RNase activity like monocytes [80].
Protocol Selection Diagram
The following diagram outlines the decision process for selecting appropriate scRNA-seq protocols based on stem cell research objectives:
Figure 2: Decision framework for selecting scRNA-seq protocols based on stem cell research objectives and sample characteristics.
Computational Analysis and Integration
Data Processing and Quality Control
Robust computational analysis begins with stringent quality control (QC) to remove low-quality cells while preserving biological heterogeneity. For stem cell datasets, recommended QC thresholds include:
- Transcript Counts: Exclude cells with <200 or >2,500 transcripts [44]
- Mitochondrial Genes: Remove cells with >5% mitochondrial transcript content [44]
- Complexity: Retain cells with sufficient genes detected (varies by protocol)
- Doublets: Identify and remove multiplets using computational tools like DoubletFinder or Scrublet
Following QC, normalization addresses technical variations in sequencing depth, with methods like SCTransform (in Seurat) providing superior performance for heterogeneous stem cell datasets. Feature selection identifies highly variable genes that drive biological heterogeneity, focusing subsequent analysis on the most informative transcripts.
Batch Effect Correction and Data Integration
Substantial batch effects represent a major challenge in stem cell scRNA-seq, particularly when integrating datasets across platforms, species, or experimental conditions (e.g., organoids vs primary tissue) [79]. Traditional integration methods struggle with substantial batch effects, often either insufficiently correcting technical variations or removing biological signals [79].
Advanced integration strategies:
- sysVI: A conditional variational autoencoder (cVAE) method employing VampPrior and cycle-consistency constraints that improves integration across systems while preserving biological signals [79]
- Adversarial Learning: Approaches that align batch distributions but may mix embeddings of unrelated cell types with unbalanced proportions
- KL Regularization: Standard cVAE approach that removes both biological and batch variation without discrimination
For stem cell atlas projects integrating multiple datasets, sysVI demonstrates superior performance in maintaining biological variation within cell types while effectively removing technical batch effects [79]. This is particularly valuable for comparing stem cell states across model systems, such as human versus mouse models or primary tissue versus organoid cultures.
Downstream Analysis Applications
Cell Type Identification and Annotation:
- Unsupervised clustering (Louvain, Leiden) identifies transcriptionally distinct populations
- Reference-based annotation tools (Azimuth, SingleR) transfer labels from established atlases
- Stem cell-specific markers validate population identities
Trajectory Inference and Pseudotime Analysis:
- Algorithms (Monocle3, PAGA, Slingshot) reconstruct differentiation trajectories from stem to mature states
- RNA velocity analysis predicts future cell states based on spliced/unspliced mRNA ratios
- Identification of branch points and lineage commitment decisions
Differential Expression and Regulatory Networks:
- Detection of genes associated with stemness, early differentiation, and lineage specification
- Transcription factor activity inference (SCENIC) identifies regulators of stem cell states
- Gene co-expression network analysis reveals functional modules
Computational Integration Diagram
The following diagram illustrates the computational integration workflow for addressing substantial batch effects in stem cell scRNA-seq data:
Figure 3: Computational integration strategies for scRNA-seq datasets with substantial batch effects, highlighting the superior performance of sysVI for stem cell applications.
Research Reagent Solutions
Table 2: Essential Research Reagents and Tools for scRNA-seq in Stem Cell Research
| Category | Specific Product/Kit | Application in Stem Cell Research | Key Features |
|---|---|---|---|
| Cell Isolation | CD34 MicroBead Kit | Hematopoietic stem cell isolation | Positive selection of CD34+ HSPCs |
| CD133/1 (AC133) MicroBeads | Primitive stem cell enrichment | Isolation of CD133+ stem cells | |
| Lineage Cell Depletion Kit | Hematopoietic stem cell purification | Removal of differentiated cells | |
| Library Preparation | Chromium Next GEM Single Cell 3' | High-throughput stem cell profiling | 3' end counting, droplet-based |
| Chromium Next GEM Single Cell 5' | Immune receptor mapping in stem cells | 5' end counting, V(D)J analysis | |
| SMART-Seq HT Kit | Full-length transcript analysis | High sensitivity, isoform detection | |
| Bioinformatics | Seurat v5 | Comprehensive scRNA-seq analysis | Integration, clustering, visualization |
| Cell Ranger | 10X Genomics data processing | Alignment, barcode processing, counting | |
| Marti Framework | Artifact detection in isoform sequencing | Classifies cDNA artifacts, improves fidelity [80] | |
| Experimental Aids | Chromium Next GEM Chip G | Single cell partitioning | Compatible with 10X Genomics platform [44] |
| Single Index Kit T Set A | Library indexing | Multiplexing samples [44] |
Optimized scRNA-seq workflows have become indispensable for advancing stem cell research, providing unprecedented resolution to dissect cellular heterogeneity, identify novel subpopulations, and map differentiation trajectories. The integration of improved experimental designs, protocol selections tailored to specific research questions, and advanced computational methods like sysVI for data integration creates a powerful framework for extracting maximum biological insights from precious stem cell samples.
Future developments in single-cell technologies will further enhance stem cell characterization. Multi-omics approaches simultaneously measuring RNA and protein, chromatin accessibility, or DNA methylation at single-cell resolution promise more comprehensive views of regulatory networks governing stem cell states [81]. Spatial transcriptomics technologies add anatomical context to single-cell data, particularly valuable for understanding stem cell niches. Advances in long-read sequencing combined with computational artifact removal [80] will improve isoform-level analysis in stem cells. As these technologies mature and become more accessible, they will undoubtedly uncover new layers of complexity in stem cell biology and accelerate translational applications in regenerative medicine and drug development.
For research teams embarking on scRNA-seq studies of stem cells, success depends on carefully matching experimental designs to biological questions, selecting appropriate protocols, implementing rigorous quality control throughout the workflow, and applying computational methods that preserve biological signals while removing technical artifacts. The optimization strategies outlined in this application note provide a roadmap for generating high-quality, reproducible data that advances our understanding of stem cell biology.
Within the broader context of utilizing single-cell RNA sequencing (scRNA-seq) for stem cell characterization, two significant technical challenges emerge: the precise analysis of rare cell populations and the accurate capture of dynamic transcriptional changes. Stem cell systems are inherently heterogeneous, often comprising rare progenitor or transitional cells that are critical for understanding differentiation, self-renewal, and disease mechanisms [36]. Furthermore, transcriptional dynamics during state transitions, such as those occurring in early embryonic development or cancer progression, represent a moving target that conventional scRNA-seq struggles to hit [82]. This application note details specialized protocols and analytical frameworks designed to address these challenges, enabling researchers to extract robust, biologically meaningful insights from their stem cell research.
Handling Rare Cell Populations
Protocol Selection and Experimental Design
The analysis of rare cell populations—such as stem cell subpopulations, early differentiation progenitors, or circulating tumor cells—requires meticulous experimental planning from cell isolation through sequencing. The primary goal is to maximize the capture and transcriptional coverage of these scarce cells while minimizing technical loss and bias.
Protocol Recommendations: For the identification and characterization of rare stem cell subpopulations, full-length transcript protocols like SMART-Seq2 are highly recommended due to their superior sensitivity in detecting low-abundance transcripts and capacity to identify isoform-specific expression [4] [3]. This is particularly valuable for resolving functional heterogeneity within stem cell pools. When aiming to profile a very large number of cells to retrospectively identify and analyze a rare population (e.g., a stem cell frequency of <1%), 3' droplet-based methods (e.g., 10x Genomics) are the tool of choice due to their high throughput and cost-effectiveness at scale [4] [3].
Critical Step: Cell Isolation and Viability The initial cell suspension quality is paramount. Use Fluorescence-Activated Cell Sorting (FACS) to pre-enrich for rare populations based on known surface markers. This method offers high specificity and single-cell resolution [36] [3]. Alternatively, for samples where tissue dissociation is challenging or cells are exceptionally fragile, single-nucleus RNA sequencing (snRNA-seq) should be considered. snRNA-seq bypasses the need for full cell dissociation and has been successfully applied to profile adipocytes and other delicate cell types [83] [3]. Regardless of the method, maintaining high cell viability (>90%) is crucial to reduce background noise from apoptotic cells.
A Modified SMART-Seq2 Protocol for Rare Cells
The following protocol is adapted for use with low numbers of rare cells, such as pooled oocytes or sorted stem cells [84].
A. Cell Lysis and RNA Capture
- Isolate rare cells via FACS or micromanipulation and lyse them in a hypotonic buffer containing RNase inhibitors.
- Use poly(dT) primers to selectively reverse-transcribe polyadenylated mRNA. The protocol employs a template-switching oligo (TSO) and Maxima H- Reverse Transcriptase to generate full-length cDNA.
B. cDNA Amplification
- Amplify the cDNA using a high-fidelity PCR polymerase (e.g., Kapa HiFi HotStart ReadyMix).
- The reaction includes betaine and MgCl2 to mitigate amplification bias and promote uniform genome coverage.
- Purify the amplified cDNA using solid-phase reversible immobilization (SPRI) beads.
C. Library Preparation and Sequencing
- Fragment the amplified cDNA and construct sequencing libraries using a kit such as Illumina's Nextera XT.
- Assess library quality and quantity using an Agilent Bioanalyzer and Qubit Fluorometer.
- Sequence using paired-end reads on an Illumina platform to achieve high transcript mappability, which is especially beneficial for analyzing repetitive elements or splice variants.
Analytical Framework for Rare Populations
Once data is generated, specialized computational tools are required to distinguish true rare populations from technical artifacts.
- Clustering and Visualization: Use unsupervised clustering algorithms (e.g., in Seurat) followed by visualization with t-SNE or UMAP to identify distinct cell subpopulations [36].
- Differential Expression: Employ statistical methods designed for single-cell data, such as MAST (Model-based Analysis of Single-cell Transcriptomics), which uses a two-part generalized linear model to account for the bimodal expression distribution (i.e., genes being either "on" or "off") typical of scRNA-seq. Controlling for covariates like the cellular detection rate (CDR) is essential to improve sensitivity and specificity when identifying markers for rare cells [85].
Table 1: Key Research Reagent Solutions for Rare Cell Analysis
| Item | Function | Example Product/Kit |
|---|---|---|
| Poly(dT) Primer | Binds to poly-A tail for cDNA synthesis | 3′ RT Primer: AAGCAGTGGTATCAACGCAGAGTACT30VN [84] |
| Template-Switching Oligo (TSO) | Enables full-length cDNA synthesis | AAGCAGTGGTATCAACGCAGAGTACATrGrG+G (Exiqon) [84] |
| High-Fidelity PCR Mix | Amplifies cDNA with low bias | Kapa HiFi HotStart ReadyMix [84] |
| SPRI Beads | Purifies and size-selects cDNA | AMPure XP beads [84] |
| Library Prep Kit | Prepares libraries for NGS | Illumina Nextera XT Kit [84] |
Capturing Dynamic Transcriptional Changes
Moving Beyond Static Snapshots
Standard scRNA-seq provides a static snapshot of gene expression, obscuring temporal processes like differentiation, cellular reprogramming, and disease progression. RNA Velocity and subsequent dynamic models have emerged as groundbreaking computational solutions to this limitation [82].
The core principle of RNA Velocity leverages the intrinsic kinetics of RNA maturation. By quantifying the ratio of unspliced (pre-mRNA) to spliced (mature mRNA) transcripts for each gene, the model infers the instantaneous rate of change of gene expression. A high unspliced/spliced ratio suggests recent transcriptional induction and that expression is likely to increase, while a low ratio suggests transcriptional shutdown and that expression will decrease. Projecting these velocity vectors onto reduced-dimensional spaces (e.g., UMAP) allows for the prediction of future cell states and the reconstruction of developmental trajectories.
Experimental and Analytical Workflow for RNA Velocity
A. Data Generation and Preprocessing
- Standard scRNA-seq libraries are sequenced in a way that retains intronic reads, which are typically discarded in standard analyses. Both spliced and unspliced reads must be mapped.
- Use tools like Velocyto or STARsolo to generate spliced and unspliced count matrices from BAM files.
B. Velocity Estimation and Interpretation
- Input the count matrices into advanced tools such as scVelo (which implements a likelihood-based dynamical model) or dynamo to estimate RNA velocity.
- The model calculates a velocity vector for each cell, indicating the direction and speed of its transcriptional change.
- Visualize these vectors on embedding plots to infer developmental directions and transition probabilities between states.
C. Advanced Trajectory and Fate Prediction
- For a more global understanding of cell fate decisions, employ tools like CellRank. This method combines RNA velocity with graph-based approaches to robustly predict terminal states (fates) and identify likely transition paths and intermediate states [82].
Application in Stem Cell and Disease Contexts
This dynamic framework is transforming stem cell research and drug discovery. It can be used to:
- Reconstruct Differentiation Trajectories: Map the entire continuum of stem cell differentiation, identifying key branching points and regulatory genes driving lineage commitment [82] [36].
- Identify Novel Disease Mechanisms: In allergy and immunology, RNA velocity has revealed dynamic immune cell state transitions in diseases like asthma and atopic dermatitis, uncovering novel pathogenic mechanisms [82].
- Enhance Drug Discovery: In oncology, these methods can predict how tumor cell populations evolve in response to therapy, identifying drug-resistant trajectories and potential therapeutic vulnerabilities early in the drug development process [86] [87].
Table 2: Comparison of Key Methodologies for Addressing scRNA-seq Challenges
| Feature | Rare Cell Populations | Dynamic Transcriptional Changes |
|---|---|---|
| Primary Method | SMART-Seq2 / High-Throughput 3' End | RNA Velocity (scVelo, dynamo) |
| Key Metric | Transcripts Per Million (TPM) / Cell | Unspliced to Spliced mRNA Ratio |
| Main Challenge | Low mRNA input, amplification bias | Accurate kinetic modeling, sparse data |
| Key Tools | MAST, Seurat | Velocyto, scVelo, CellRank |
| Primary Output | Novel cell type identification, markers | Future state prediction, trajectory mapping |
Integrated Workflow and Visualization
The following diagram summarizes the integrated experimental and computational workflow for addressing both rare cell populations and dynamic changes in a single study.
Successfully characterizing stem cells at single-cell resolution demands targeted strategies for handling rare populations and interpreting dynamic processes. By adopting optimized wet-lab protocols like modified SMART-Seq2 for rare cells and leveraging cutting-edge computational frameworks like RNA velocity and CellRank for dynamics, researchers can transform static snapshots into powerful, predictive models of cell fate. This integrated approach is pivotal for advancing our fundamental understanding of stem cell biology and for accelerating the translation of this knowledge into novel diagnostic and therapeutic strategies in regenerative medicine and oncology.
Ensuring Biological Relevance: Validation, Benchmarking, and Comparative Analysis Approaches
Single-cell RNA sequencing (scRNA-seq) has revolutionized transcriptomics by enabling the comprehensive analysis of cellular heterogeneity in complex biological systems, a capability particularly valuable for stem cell characterization research [3] [4]. This technology allows researchers to investigate gene expression profiles at the individual cell level, providing unprecedented insights into stem cell differentiation, plasticity, and rare subpopulation dynamics [3]. However, the rapid evolution of scRNA-seq platforms and analysis methods presents significant challenges for method validation. Selecting appropriate experimental platforms and analytical tools is crucial for generating reliable, reproducible data in stem cell research. This application note provides a structured comparative analysis of scRNA-seq platforms, performance metrics, and computational tools, with specific consideration of applications in stem cell biology.
Fundamental scRNA-seq Protocol Differences
scRNA-seq technologies differ significantly in their technical approaches, impacting their suitability for various stem cell research applications. The primary distinction lies in transcript coverage: full-length protocols (e.g., Smart-Seq2, Fluidigm C1) sequence the entire transcript, enabling isoform usage analysis, allelic expression detection, and identification of RNA editing, while 3' or 5' end counting protocols (e.g., Drop-Seq, inDrop, 10x Genomics Chromium) focus only on the transcript ends, providing higher throughput at lower cost per cell [3] [4]. Another key difference is the cell isolation strategy, with plate-based methods (e.g., Fluidigm C1, WaferGen iCell8) offering visual confirmation of cell viability but lower throughput, and droplet-based methods (e.g., 10x Genomics Chromium, Drop-Seq, inDrop) enabling processing of thousands to tens of thousands of cells simultaneously [3] [40].
The amplification method also varies between protocols, utilizing either polymerase chain reaction (PCR) or in vitro transcription (IVT). PCR-based amplification (used in Smart-Seq2, Drop-Seq, and most droplet-based methods) provides nonlinear amplification, while IVT (used in CEL-Seq2 and inDrop) offers linear amplification but requires a second round of reverse transcription [3] [4]. The incorporation of Unique Molecular Identifiers (UMIs) in many modern protocols (e.g., Drop-Seq, 10x Genomics, CEL-Seq2) helps account for amplification biases and improves quantification accuracy by tagging each mRNA molecule during reverse transcription [3] [4].
Comparative Analysis of Experimental Platforms
Multiple studies have conducted systematic comparisons of scRNA-seq platforms to evaluate their performance characteristics. A multiplatform comparison study organized by the Association of Biomolecular Resource Facilities Genomics Research Group analyzed SUM149PT cells (a breast cancer cell line) treated with trichostatin A (TSA) versus untreated controls across several scRNA-seq platforms [40]. The study aimed to demonstrate RNA sequencing methods for profiling the ultra-low amounts of RNA present in individual cells and establish best practices for sample preparation and analysis.
Table 1: Comparison of Major scRNA-seq Platforms
| Platform | Technology Type | Throughput (Cells) | Transcript Coverage | UMI Support | Amplification Method | Key Applications in Stem Cell Research |
|---|---|---|---|---|---|---|
| Fluidigm C1 | Plate-based microfluidics | 96-800 cells | Full-length | No | PCR | Rare stem cell populations, isoform analysis |
| 10x Genomics Chromium | Droplet-based | 80,000 cells per run | 3' or 5' only | Yes | PCR | Large-scale stem cell atlas projects, heterogeneity studies |
| WaferGen iCell8 | Nanowell plate | 1,000-1,800 cells | 3' profiling or full-length | Yes | PCR | Medium-throughput screens with viability confirmation |
| BioRad ddSEQ | Droplet-based | Hundreds to thousands | 3' only | Yes | PCR | Cost-effective smaller studies |
| Smart-Seq2 | Plate-based (FACS) | 96-384 cells | Full-length | No | PCR | High-sensitivity detection of low-abundance transcripts in stem cells |
| Drop-Seq | Droplet-based | Thousands to millions | 3' end | Yes | PCR | Developmental biology, lineage tracing |
The Fluidigm C1 system utilizes integrated fluidic circuits to isolate single cells into individual nanochannels for visual examination, followed by cell lysis, cDNA conversion, preamplification, and retrieval for library construction and sequencing [40]. A significant limitation is that cell partitioning is size-restricted based on the nanochannel tolerance of the nanofluidic plate, which may impact certain stem cell types. The 10x Genomics Chromium Controller, currently one of the most commonly employed microfluidics-based platforms, uses a 5'- or 3'-tag sequencing method based on encapsulating single cells in oil-based droplets with barcoded beads [40]. The Illumina/BioRad ddSEQ employs disposable microfluidic cartridges to co-encapsulate single cells and barcodes into subnanoliter droplets, where cell lysis and barcoding occur before library preparation and sequencing [40].
Table 2: Performance Metrics Across Platforms (Based on SUM149PT Cell Line Study)
| Performance Metric | Fluidigm C1 | 10x Genomics Chromium | WaferGen iCell8 | BioRad ddSEQ |
|---|---|---|---|---|
| Cells Captured | 96-800 | Up to 80,000 | 1,000-1,800 | Hundreds to thousands |
| Genes Detected per Cell | Varies by cell size | Medium range | Varies | Lower range |
| Sensitivity for Low-Abundance Transcripts | High | Medium | Medium | Lower |
| Doublet Rate | Lower | Controlled by cell concentration | Medium | Varies |
| Cost per Cell | Higher | Lower | Medium | Lower |
| Technical Noise | Lower | Medium | Medium | Higher |
Computational Analysis and Method Validation
scRNA-seq Analysis Workflow
The computational analysis of scRNA-seq data involves multiple steps, each with specific methodological considerations critical for proper method validation in stem cell research.
Quality Control and Normalization
Quality control (QC) represents a critical first step in scRNA-seq analysis, particularly for stem cell datasets where cell viability and state can significantly impact results. Cell QC is commonly performed based on three QC covariates: the number of counts per barcode (count depth), the number of genes per barcode, and the fraction of counts from mitochondrial genes per barcode [62]. Barcodes with unexpectedly low count depth, few detected genes, and high fraction of mitochondrial counts often indicate dying cells or cells with broken membranes, while those with unexpectedly high counts and large numbers of detected genes may represent multiplets (doublets or triplets) that should be filtered out [62]. For stem cell research, where cells may naturally exhibit different sizes and metabolic states, these QC covariates should be considered jointly when making thresholding decisions, and thresholds should be set as permissively as possible to avoid unintentionally filtering out biologically relevant cell populations [62].
Normalization methods designed specifically for scRNA-seq data have emerged to address its unique characteristics, including sparsity and zero-inflation. The GF-ICF (gene frequency-inverse cell frequency) pipeline applies the TF-IDF (term frequency-inverse document frequency) transformation model from text mining to scRNA-seq data, considering cells as documents, genes as words, and gene counts as word occurrences [88]. This approach has demonstrated improved performance in separating and distinguishing different cell types compared to methods developed for bulk RNA-seq data [88]. Alternative normalization strategies include library size normalization followed by log1p transformation, which is commonly employed in pipelines such as Seurat and Scanpy [62] [89].
Copy Number Variation Analysis in Stem Cells
Copy number variations (CNVs) are gains or losses of genomic regions that are particularly relevant in stem cell biology, especially in cancer stem cells and in vitro cultured stem cells where genomic instability may occur. Several computational methods have been developed to identify CNVs from scRNA-seq data, allowing simultaneous assessment of copy number alterations and cellular states from the same measurement [90]. These methods can be broadly classified into two categories: those using only expression levels per gene (InferCNV, copyKat, SCEVAN, CONICSmat) and those combining expression values with allelic information from single nucleotide polymorphisms (CaSpER, Numbat) [90].
A comprehensive benchmarking study evaluating six popular CNV callers across 21 scRNA-seq datasets revealed that dataset-specific factors significantly influence performance, including dataset size, the number and type of CNVs in the sample, and the choice of reference dataset [90]. Methods incorporating allelic information (CaSpER and Numbat) performed more robustly for large droplet-based datasets but required higher computational runtime [90]. For stem cell research, particularly involving cancer stem cells or monitoring genomic stability during culture and differentiation, proper selection of CNV calling methods and reference datasets is crucial for accurate identification of aneuploidy and subclonal structures.
Performance Metrics and Validation Approaches
Benchmarking Metrics for scRNA-seq Methods
Robust performance metrics are essential for validating scRNA-seq methods, particularly for perturbation experiments in stem cell biology. Traditional metrics like Mean Squared Error (MSE) and control-referenced Pearson correlation (Pearson(Δ)) have been shown to potentially reward mode collapse—where models predict similar outputs regardless of input perturbations—especially when controls are biased or biological signals are sparse [89]. This is particularly problematic in stem cell research where subtle responses to differentiation cues or small molecule treatments need to be accurately captured.
To address these limitations, DEG-aware metrics have been developed, including Weighted Mean-Squared Error (WMSE) and weighted delta R² (R²w(Δ)), which measure error in niche signals with higher sensitivity [89]. These metrics are calibrated using negative and positive baselines, including a novel technical duplicate baseline that provides a realistic estimate of optimal performance given the intrinsic variance of the dataset [89]. When using WMSE as a loss function during model training, researchers have observed reduced mode collapse and improved model performance in predicting perturbation responses [89].
Visualization and Interpretation
Effective visualization is crucial for interpreting scRNA-seq data, particularly for stem cell researchers exploring cellular heterogeneity and lineage relationships. Standard approaches include projecting cells into a two-dimensional space using methods such as t-distributed Stochastic Neighbor Embedding (t-SNE) or Uniform Manifold Approximation and Projection (UMAP), with cells colored by cluster or cell type [91] [88]. However, when dealing with tens of clusters, conventional visualization methods often assign visually similar colors to spatially neighboring clusters, making it difficult to distinguish between them [91].
Tools like Palo address this issue by optimizing color palette assignments in a spatially aware manner [91]. Palo calculates spatial overlap scores between clusters and assigns visually distinct colors to cluster pairs with high spatial overlap, significantly improving the interpretability of complex stem cell datasets with multiple closely related subpopulations [91]. For stem cell biologists tracking differentiation trajectories or identifying rare progenitor populations, such visualization enhancements can dramatically improve the ability to discern biologically relevant patterns.
Essential Research Reagent Solutions
Table 3: Key Research Reagent Solutions for scRNA-seq in Stem Cell Research
| Reagent/Kit | Function | Application Notes for Stem Cell Research |
|---|---|---|
| SMARTer Ultra Low RNA Kit | cDNA synthesis from low-input RNA | Critical for stem cells with limited RNA content |
| Nextera XT DNA Sample Preparation Kit | Library preparation | Compatible with Fluidigm C1 and other platforms |
| Unique Molecular Identifiers (UMIs) | Correcting PCR amplification biases | Essential for accurate quantification in stem cell heterogeneity studies |
| Cellular Barcodes | Multiplexing samples | Enables pooling multiple stem cell samples in one run |
| 10x Genomics Chromium Single Cell 3' Reagents | 3' transcriptome library preparation | Optimized for droplet-based single-cell capture |
| Calcein AM/EthD-1 Viability Assay | Live/dead cell staining | Crucial for assessing stem cell viability before sequencing |
Several public databases provide essential resources for method validation and comparative analysis in scRNA-seq research:
- GEO/SRA: Broad repository hosted by the NIH containing both bulk and single-cell RNA-seq data, with interfaces to download raw sequencing data (FASTQ files) and processed count matrices [92]
- Single Cell Expression Atlas: EMBL-hosted database with explorable and downloadable scRNA-seq datasets categorized as "baseline" or "differential" studies [92]
- Single Cell Portal: Broad Institute's scRNA-seq-specific database with built-in exploration functions and easy download of raw and normalized data [92]
- CZ Cell x Gene Discover: Chan Zuckerberg Initiative database hosting over 500 datasets with exploration capacity through their open-source tool [92]
- scRNAseq Package (Bioconductor): Provides access to dozens of scRNA-seq datasets as SingleCellExperiment objects for easy integration with Bioconductor analysis packages [92]
These resources are particularly valuable for stem cell researchers seeking to validate new methods against established datasets or contextualize their findings within existing single-cell data from similar stem cell types or differentiation paradigms.
Validating scRNA-seq methods requires careful consideration of multiple factors, including platform selection, computational tools, and performance metrics tailored to specific research questions in stem cell biology. The rapidly evolving landscape of scRNA-seq technologies continues to provide researchers with increasingly powerful tools for resolving cellular heterogeneity, tracing lineage trajectories, and characterizing novel stem cell populations. By applying the systematic comparison frameworks and validation approaches outlined in this application note, stem cell researchers can make informed decisions about experimental design and analysis strategies, ultimately generating more reliable and interpretable data to advance our understanding of stem cell biology.
Single-cell RNA sequencing (scRNA-seq) has revolutionized stem cell research by enabling the resolution of cellular heterogeneity, discovery of novel subtypes, and characterization of dynamic differentiation trajectories. However, transcriptomic data alone provides an incomplete picture. Robust biological validation is paramount to confirm that computational inferences from scRNA-seq accurately reflect biological reality in stem cell populations. This protocol details a comprehensive framework for validating scRNA-seq findings through the integration of protein marker expression, spatial context, and functional assays, with a specific focus on hematopoietic stem and progenitor cells (HSPCs). This integrated approach ensures that identified cell states and subtypes are biologically meaningful and not merely technical artifacts, thereby strengthening conclusions drawn for both basic research and drug development applications.
Experimental Design and scRNA-seq Workflow
A foundational scRNA-seq experiment is the first critical step. The following workflow outlines best practices for sample preparation and initial data generation, which form the basis for subsequent validation.
Diagram 1: The core scRNA-seq workflow. Key wet-lab steps (green) generate data for computational analysis (yellow), leading to cluster identification that requires validation.
Key Considerations for Experimental Design
- Cell Sorting Strategy: For HSPC analysis, positive selection using markers like CD34 and/or CD133, combined with negative selection for lineage markers (Lin-) and positive selection for CD45, effectively enriches the target population [44]. This reduces background noise and focuses sequencing depth on biologically relevant cells.
- Cell Quality and Viability: Ensure high cell viability (>90%) post-dissociation to minimize stress-induced gene expression artifacts and technical noise. Cells with high mitochondrial read fractions (>5-10%) should be excluded during quality control [62] [45].
- Replication and Controls: Include biological replicates to distinguish technical variability from true biological differences. Control samples, such as known cell lines or pooled samples, can assist in batch correction and platform validation.
Validation Module 1: Protein Marker Confirmation
Validation of protein expression for cell surface markers identified in scRNA-seq analysis is a direct and essential step to confirm cluster identity.
Protocol: Flow Cytometry Validation of scRNA-seq Clusters
This protocol details the procedure for validating protein marker expression on HSPCs [44].
Antibody Staining:
- Prepare a single-cell suspension from your stem cell source (e.g., umbilical cord blood, bone marrow).
- Resuspend up to 1x10⁶ cells in 100 µL of FACS buffer (PBS with 2% FBS).
- Add fluorophore-conjugated antibodies against target proteins (e.g., anti-CD34-PE, anti-CD133-APC, anti-CD45-PE-Cy7) and a cocktail of FITC-conjugated lineage markers (CD235a, CD2, CD3, CD14, CD16, CD19, CD24, CD56, CD66b). Use manufacturer-recommended concentrations.
- Incubate in the dark at 4°C for 30 minutes.
- Wash cells twice with FACS buffer by centrifugation (400-500 x g for 5 min) and resuspend in RPMI-1640 medium with 2% FBS.
Cell Sorting and Analysis:
- Analyze cells using a flow cytometer or cell sorter (e.g., MoFlo Astrios EQ).
- Gate on small, lymphocyte-like events (2–15 µm). Apply a viability dye to exclude dead cells.
- Within the viable cell gate, select Lin⁻ cells. Further gate on Lin⁻CD45⁺ cells and analyze for co-expression of CD34 and/or CD133 [44].
- Compare the frequencies of populations (e.g., CD34⁺Lin⁻CD45⁺ vs. CD133⁺Lin⁻CD45⁺) with their abundance inferred from the original scRNA-seq clustering.
Research Reagent Solutions
Table 1: Essential reagents for protein marker validation via flow cytometry.
| Reagent / Tool | Function | Example |
|---|---|---|
| Fluorophore-conjugated Antibodies | Tag specific cell surface proteins for detection and sorting. | Anti-CD34-PE, anti-CD133-APC, anti-CD45-PE-Cy7 [44] |
| Lineage Marker Cocktail | Negative selection to exclude differentiated cells and enrich for primitive stem/progenitor populations. | FITC-conjugated CD235a, CD2, CD3, CD14, CD16, CD19, etc. [44] |
| Fluorescence-activated Cell Sorter (FACS) | High-speed sorting and analysis of cells based on protein marker expression. | MoFlo Astrios EQ [44] |
| Viability Dye | Distinguish and exclude dead cells from the analysis to improve data quality. | Propidium Iodide or DAPI |
Validation Module 2: Spatial Context Integration
scRNA-seq loses the native spatial architecture of tissues. Spatial transcriptomics and proteomics bridge this gap, allowing validation of cluster localization within a tissue microenvironment.
Protocol: DBiTplus for Integrated Spatial Transcriptomics and Protein Profiling
DBiTplus combines sequencing-based spatial transcriptomics with imaging-based spatial proteomics (CODEX) on the same tissue section [93].
Sample Preparation:
- Use fresh frozen (FF) or formalin-fixed paraffin-embedded (FFPE) tissue sections mounted on a glass slide.
- For FFPE, perform deparaffinization and rehydration. For FF, proceed directly.
Spatial Barcoding and cDNA Synthesis:
- Perform in situ reverse transcription to create cDNA from cellular mRNA within the intact tissue.
- Align a microfluidic chip with 50 parallel channels to the tissue section. Deliver DNA barcodes (Ai and Bj) in two perpendicular directions, creating a 2D array of unique barcode spots that tag the cDNA based on location [93].
cDNA Retrieval and Library Prep:
- Critical Step: To preserve tissue integrity for subsequent protein imaging, incubate the tissue with Thermostable RNaseH. This enzyme selectively degrades the RNA in RNA-DNA hybrids, freeing the barcoded cDNA for retrieval without damaging the tissue [93].
- Pool, purify, and amplify the retrieved cDNA to construct a sequencing library for spatial transcriptomics.
Multiplexed Protein Imaging (CODEX):
- On the same intact tissue section, perform antigen retrieval (if FFPE).
- Stain the tissue with a panel of DNA-barcoded antibodies (e.g., ~50 protein markers).
- Image the tissue using the CODEX platform, which involves cyclic hybridization of fluorescent readouts to visualize the barcoded antibodies, generating a high-plex protein map [93].
Computational Data Integration:
- Use a customized computational pipeline (e.g., based on MaxFuse) to integrate the spatial transcriptome (DBiT-seq) and spatial proteome (CODEX) datasets [93].
- This integration allows for precise cell type annotation of each spatial transcriptome spot and can be used to deconvolute spots to single-cell resolution, creating a unified spatial atlas.
Diagram 2: The DBiTplus workflow. The key innovation is the RNaseH step (red), which allows sequential spatial omics on one tissue section, enabling perfect data registration.
Validation Module 3: Functional Assays and Drug Response
Ultimately, stem cell identity is defined by function. Functional assays and drug response profiling provide the highest level of validation for predictions made from scRNA-seq data.
Protocol: scDrug Workflow for Predicting Cell-Specific Drug Responses
The scDrug workflow leverages scRNA-seq data to identify tumor cell subpopulations and predict their drug response, a principle applicable to stem cell populations like HSPCs [94].
scRNA-seq Analysis and Cluster Identification:
- Process your scRNA-seq data through a standard pipeline (quality control, normalization, feature selection, dimensionality reduction, and clustering).
- Identify distinct stem cell subclusters (e.g., primitive HSPCs vs. lineage-committed progenitors).
Functional Annotation of Subclusters:
- Perform differential expression analysis between clusters.
- Use pathway enrichment analysis (e.g., GO, KEGG) to infer the functional state of each cluster (e.g., quiescent, proliferating, differentiating).
Drug Response Prediction:
- Method A (Signature-based): Use pre-existing drug sensitivity gene signatures from public databases. Overlap these signatures with the differentially expressed genes in your stem cell clusters to predict which clusters may be sensitive or resistant to specific drugs [86] [94].
- Method B (Network-based): Build cell-specific gene regulatory networks for each cluster. Identify critical hubs or "master regulator" genes in these networks. Screen for drugs known to target these key genes or pathways [94].
Functional Validation:
- Isolate the stem cell subpopulations of interest via FACS based on validated protein markers.
- Subject the sorted populations to in vitro functional assays:
- Colony-Forming Unit (CFU) Assays: To assess proliferative potential and differentiation capacity.
- Long-Term Culture-Initiating Cell (LTC-IC) Assays: To evaluate the self-renewal potential of primitive stem cells.
- Treat the sorted populations with the predicted drugs and quantify the functional readouts (e.g., reduction in colony number or size) to confirm the computational predictions.
Quantitative Data from Functional Studies
Table 2: Examples of scRNA-seq driven functional insights in cancer and stem cell research.
| Study System | scRNA-seq Finding | Functional Validation Approach | Key Validated Outcome |
|---|---|---|---|
| Multiple Myeloma [86] | Identification of transcriptomically distinct subclones in relapse. | Targeted drug screening on sorted subpopulations. | Validation of subclone-specific drug vulnerabilities, guiding combination therapy. |
| Triple-Negative Breast Cancer [86] | Identification of TP53 mutant subclones. | Longitudinal tracking of tumor evolution in xenograft models upon cisplatin treatment. | Demonstrated that TP53 mutations alter clonal fitness and confer resistance to cisplatin. |
| HSPCs (Cord Blood) [44] | CD34+ and CD133+ HSPCs show high transcriptomic similarity (R=0.99). | Integrated analysis of both populations as a "pseudobulk" for downstream functional analysis. | Confirmed biological similarity, enabling merged analysis for greater statistical power in differentiation studies. |
Integrated Data Analysis and Machine Learning
Integrating data from the three validation modules requires sophisticated computational approaches. Machine learning (ML) models are particularly powerful for this task.
- Linear Models for Data Integration: Methods like Integrative Non-negative Matrix Factorization (iNMF) and Canonical Correlation Analysis (CCA) are used to find shared sources of variation across different data modalities (e.g., transcriptome and proteome). For instance, CCA was used to align CyTOF (protein) and scRNA-seq data, successfully identifying a rare subpopulation of CD11c-positive B cells that expanded upon COVID-19 infection [95].
- Bridge Integration: This approach is useful when the reference and query datasets have unpaired cells and features. A multi-omic "bridge" dataset is used to translate between the two. This method characterized a very rare population of innate lymphoid cells that were missed in a CyTOF dataset but were present in the scRNA-seq data [95].
- Unified Deep Learning Frameworks: Deep learning models can create a unified latent representation that integrates all modalities—gene expression, protein levels, spatial coordinates, and even genetic variants. This holistic view enables more accurate prediction of fundamental stem cell properties like differentiation potential and drug sensitivity [95].
Single-cell RNA sequencing (scRNA-seq) has fundamentally transformed stem cell research by enabling the characterization of cellular heterogeneity at unprecedented resolution. This technology is instrumental for identifying novel stem cell subpopulations, unraveling differentiation trajectories, and understanding the molecular basis of cellular fate decisions. However, the accurate interpretation of scRNA-seq data heavily relies on appropriate computational methods for clustering and differential expression (DE) analysis. The rapidly evolving landscape of bioinformatics tools presents a significant challenge for researchers seeking to select optimal methodologies for their specific experimental contexts. This application note provides a structured benchmark of current computational protocols, focusing on their performance in stem cell characterization research. We synthesize evidence from multiple large-scale benchmarking studies to guide researchers and drug development professionals in implementing robust analytical workflows, thereby enhancing the reliability and biological relevance of their findings.
Benchmarking Clustering Algorithms for Cell Type Identification
Clustering analysis serves as a cornerstone of scRNA-seq data interpretation, enabling the identification of distinct cell types and states within a heterogeneous population, such as those found in stem cell cultures or developing tissues. The performance of clustering algorithms is critical for accurately discerning the true cellular taxonomy.
Performance Evaluation of Clustering Methods
Systematic evaluations have revealed substantial differences in the performance, run time, and stability of various clustering algorithms. A comprehensive assessment of 14 clustering methods on multiple real and simulated datasets identified SC3 and Seurat as consistently top-performing algorithms for recovering known cell types [96]. These methods demonstrated favorable results in terms of accuracy, stability, and scalability. The study further noted that Seurat offers a significant advantage in computational efficiency, being several orders of magnitude faster than SC3, which is a crucial consideration for large-scale datasets [96].
When the specific task involves determining the number of cell populations present in a sample, benchmarking of 14 algorithms designed for this purpose revealed that Monocle3, scLCA, and a stability-based approach (scCCESS-SIMLR) provided the most accurate estimates across datasets containing 5 to 20 true cell types [97]. In contrast, methods like SHARP and densityCut exhibited a tendency to underestimate the number of clusters, while SC3, ACTIONet, and Seurat often overestimated cluster numbers [97].
Recommended Protocol: Leiden Algorithm for Community Detection
For general clustering tasks, the current best practice in the field recommends using the Leiden algorithm applied to a k-nearest neighbor (KNN) graph constructed from a dimensionally-reduced expression space (e.g., principal components) [98]. The Leiden algorithm, an improvement over the earlier Louvain method, outperforms many other clustering approaches for scRNA-seq data and guarantees well-connected communities [98].
Table 1: Benchmarking Performance of Selected Clustering Algorithms
| Algorithm | Primary Method | Strengths | Considerations | Stem Cell Application Context |
|---|---|---|---|---|
| Leiden | Community detection on KNN graph | Fast, well-connected clusters, handles large datasets | Resolution parameter requires tuning | General cell type identification; recommended default |
| SC3 | Consensus clustering | High accuracy, stable, user-determines k |
Higher computational demand, slower | Ideal for smaller, high-value datasets (<10,000 cells) |
| Seurat | Community detection | Fast, scalable, integrates with full analysis suite | Can over-estimate cluster number | Large datasets, multi-sample integration |
| Monocle3 | Community detection | Accurate cluster number estimation, trajectory analysis | - | Complex differentiation processes |
The following workflow diagram illustrates the standard clustering protocol, highlighting key decision points and parameter tuning steps critical for success in stem cell data analysis.
Figure 1: Standard workflow for clustering scRNA-seq data using the Leiden algorithm. The resolution parameter critically influences cluster granularity and requires empirical tuning. Sub-clustering may be applied to resolve finer cellular substates, a common requirement in stem cell populations.
Parameter Optimization and Biological Validation
A critical step in the clustering workflow is tuning the resolution parameter, which controls the granularity of the clustering output. Higher resolution values lead to a greater number of finer clusters, while lower values produce broader, coarser clusters [98]. For stem cell research, where populations may exist along a continuous differentiation landscape, it is advisable to test a range of resolution values (e.g., 0.2 to 1.5) and validate the biological plausibility of the resulting clusters using known marker genes. Furthermore, sub-clustering—the process of re-clustering cells within a previously identified cluster—can be a powerful strategy for uncovering finer cell states or rare progenitor populations that may be masked in a full-dataset analysis [98].
Benchmarking Differential Expression (DE) Methods
Differential expression analysis is pivotal for identifying gene expression changes that define stem cell states, response to treatments, or drivers of differentiation. The choice of DE method significantly impacts the biological conclusions drawn from the data.
Comparative Performance of DE Tools
The performance of DE methods is strongly influenced by data sparsity, batch effects, and sequencing depth. A benchmark of 11 DE tools on both simulated and real data found considerable variation in their agreement when calling differentially expressed genes [99]. Methods with higher true positive rates often exhibited lower precision due to false positives, whereas methods with high precision typically identified fewer DE genes [99].
Notably, a major benchmark evaluating 46 integrative DE workflows for multi-sample data found that methods originally designed for bulk RNA-seq, such as limma-trend, edgeR, and DESeq2, often remain competitive with, and sometimes outperform, methods designed specifically for single-cell data [100]. This is particularly true when these models are extended to include batch as a covariate. For data with very low sequencing depth, non-parametric methods like the Wilcoxon rank-sum test performed robustly [100]. Specialized single-cell methods like MAST, which uses a two-part generalized linear model to account for dropouts, also consistently ranked among the top performers, especially when modeling a batch covariate (MAST_Cov) in studies with substantial technical variation [100].
Table 2: Benchmarking Performance of Selected Differential Expression Methods
| Method | Underlying Model | Recommended Context | Batch Effect Strategy | Considerations for Stem Cell Research |
|---|---|---|---|---|
| limma-trend | Linear model with empirical Bayes | Moderate to high depth; multi-batch studies | Covariate modeling | High precision; reliable for well-powered studies |
| MAST | Hurdle model (GLM) | General use; zero-inflated data | Covariate modeling | Explicitly models dropouts; good for sparse populations |
| DESeq2 | Negative binomial GLM | Moderate depth; high precision | Covariate modeling | Conservative; good specificity |
| Wilcoxon Test | Non-parametric rank-based | Low sequencing depth | Naïve pooling or covariate | Robust, low power for complex designs |
| edgeR | Negative binomial GLM | General use | Covariate modeling | Good balance of sensitivity/specificity |
| SCDE | Bayesian mixture model | - | - | Computationally intensive |
Integrative Strategies for Multi-Batch Studies
Stem cell studies often integrate data from multiple patients, time points, or experimental batches. For such balanced designs (where each batch contains cells from all conditions being compared), covariate modeling (e.g., including 'batch' as a term in a regression model) generally provides superior performance compared to analyzing batch-corrected data or using simple meta-analysis techniques [100]. The use of pre-corrected data for DE analysis rarely improves results and can sometimes introduce artifacts that distort biological signals [100]. For single-cell data characterized by high dropout rates, the observation weights provided by ZINB-WaVE can be used to unlock bulk RNA-seq tools like edgeR, though this approach deteriorates in performance with very low sequencing depths [100].
Integrated Experimental Protocols
Protocol 1: Cell Clustering and Population Annotation
This protocol details the steps for identifying distinct cell populations from a raw gene-cell count matrix, a foundational task in characterizing heterogeneous stem cell cultures.
Materials and Reagents
- Software Environment: R (≥4.0) or Python (≥3.8)
- Analysis Packages: Scanpy [98] or Seurat [96]
- Computational Resources: Minimum 16GB RAM for datasets of ~10,000 cells
Procedure
- Data Preprocessing and Normalization: Filter cells based on quality control metrics (mitochondrial read percentage, number of detected genes/UMIs). Normalize the filtered count data using a method appropriate for your protocol. For UMI-based data (e.g., 10x Genomics),
scrandeconvolution normalization is recommended [98]. - Feature Selection and Dimensionality Reduction: Identify highly variable genes (HVGs). Perform principal component analysis (PCA) on the scaled expression matrix of HVGs.
- KNN Graph Construction and Clustering: Construct a k-nearest neighbor graph (default k=15-50) in PCA space using Euclidean distance. Cluster the cells by applying the Leiden algorithm [98] to this graph.
- Resolution Tuning and Cluster Annotation: Iteratively run the Leiden algorithm with a range of resolution parameters (e.g., 0.2, 0.6, 1.0). For each result, visualize clusters using UMAP and annotate them based on the expression of known marker genes relevant to your stem cell system. Biological knowledge is paramount for selecting the most appropriate resolution.
Protocol 2: Differential Expression Analysis Across Conditions
This protocol outlines a robust workflow for identifying differentially expressed genes between conditions (e.g., control vs. treated stem cells) within a specific cell type, accounting for potential batch effects.
Materials and Reagents
- Software Environment: R/Bioconductor
- Primary DE Tools: limma, MAST, DESeq2
- Data Input: A normalized count matrix and cell-level metadata (condition, batch, cell type)
Procedure
- Cell Subsetting and Data Preparation: Subset the dataset to the cell type of interest. Create a pseudobulk count matrix by summing counts per gene per sample (donor/biological replicate) and per condition, or use single-cell-level data if replicates are limited.
- Model and Covariate Specification: For tools like limma-trend or MAST, fit a model that includes the biological condition of interest as the primary factor. Include technical batch or patient ID as a covariate in the model to account for unwanted variation [100].
- DE Gene Calling and Thresholding: Perform statistical testing based on the specified model. Apply multiple testing correction (Benjamini-Hochberg) to control the false discovery rate (FDR). A common threshold for significance is an FDR-adjusted p-value (q-value) < 0.05.
- Biological Validation and Interpretation: Validate the top DE genes using independent knowledge (e.g., literature-curated markers). Perform functional enrichment analysis (Gene Ontology, KEGG pathways) to interpret the biological programs underlying the DE signature.
The logical flow and tool selection for a differential expression analysis are summarized in the diagram below.
Figure 2: Decision workflow for differential expression analysis. The most critical decision point is whether the data originates from a multi-batch design, which necessitates the use of a covariate model to achieve statistically sound and biologically accurate results.
The Scientist's Toolkit: Essential Computational Reagents
Table 3: Key Software Tools and Resources for scRNA-seq Analysis in Stem Cell Research
| Tool/Resource | Type | Primary Function | Application Note |
|---|---|---|---|
| Seurat | R Software Package | End-to-end scRNA-seq analysis (QC, clustering, DE, integration) | Industry standard; extensive documentation and community support. |
| Scanpy | Python Software Package | End-to-end scRNA-seq analysis (QC, clustering, DE, integration) | Scalable to very large datasets; integrates with machine learning libraries. |
| scran | R/Bioconductor Package | Normalization via deconvolution | Recommended for UMI-based data to handle cell-specific biases. |
| Leiden Algorithm | Clustering Algorithm | Community detection on graphs | Preferred over Louvain for generating better-connected clusters. |
| Harmony | R/Python Package | Batch effect integration | Fast and effective for merging datasets without corrected expression matrix. |
| limma | R/Bioconductor Package | Differential expression analysis | limma-trend performs well on pseudo-bulk or normalized log-counts. |
| MAST | R/Bioconductor Package | Differential expression analysis | Models dropout events; ideal for sparse single-cell data. |
| ZINB-WaVE | R/Bioconductor Package | Observation weights for DE | Provides dropout probabilities to improve bulk-method performance on sc-data. |
The rigorous benchmarking of computational tools is a prerequisite for robust and reproducible single-cell genomics in stem cell research. Evidence from independent, large-scale comparisons indicates that while no single algorithm is universally superior, informed selections can be made based on data characteristics and biological questions. For clustering, the Leiden algorithm applied to a KNN graph represents a community standard, with SC3 and Seurat as strong alternatives. For differential expression, limma-trend, DESeq2, and MAST consistently rank among the top performers, with a strong recommendation to use covariate modeling over batch-corrected data in multi-sample studies. By adopting these benchmarked protocols and leveraging the provided toolkit, researchers can enhance the accuracy of their cell type identification and the reliability of their differential expression markers, ultimately leading to more profound insights into stem cell biology and therapeutic development.
Single-cell RNA sequencing (scRNA-seq) has revolutionized stem cell research by enabling the detailed molecular characterization of cellular heterogeneity within populations. However, the rapidly expanding variety of available scRNA-seq technologies presents significant challenges for cross-platform reproducibility and data consistency. Technical variability in scRNA-seq remains substantially higher than in bulk RNA-seq, making the assessment and management of these factors a prerequisite for valid biological interpretation [101]. For stem cell researchers investigating rare populations like hematopoietic stem/progenitor cells (HSPCs) or dental pulp stem cells, this technical variability can obscure true biological signals and compromise comparisons across experimental platforms. This application note provides a structured framework for assessing technical variability and ensuring data consistency in scRNA-seq studies focused on stem cell characterization.
Experimental Design for Reproducibility
Platform Selection Considerations
The foundation of reproducible scRNA-seq research begins with appropriate experimental design and platform selection. The choice of methodology represents a compromise between cell numbers, information depth, and overall cost, and must be aligned with the specific biological questions being investigated [102]. Droplet-based methods (e.g., 10X Genomics) typically offer higher throughput at lower cost per cell, making them suitable for large-scale cellular heterogeneity studies, while plate-based methods (e.g., Smart-seq2) provide greater sensitivity and full-length transcript coverage ideal for characterizing rare cell populations or investigating alternative splicing events [103].
For stem cell research specifically, the ability to work with limited cell numbers is crucial. Successful transcriptomic analysis of human umbilical cord blood-derived HSPCs has been demonstrated even with limited cell numbers when using sorted material rather than full pellets of blood cells [44] [51]. This approach enables researchers to focus on specific stem cell populations of interest while minimizing technical variability introduced by analyzing heterogeneous cell mixtures.
Critical Technical Considerations
Table 1: Key Technical Considerations for scRNA-seq Experimental Design
| Factor | Impact on Reproducibility | Recommended Approach for Stem Cells |
|---|---|---|
| Cell Capture Method | Directly affects cell viability and representation | FACS sorting with specific surface markers (e.g., CD34+Lin−CD45+ for HSPCs) [44] |
| Transcript Coverage | Influences detectability of isoforms and genetic variants | Full-length protocols for isoform analysis; 3' for gene-level quantification [102] |
| Unique Molecular Identifiers (UMIs) | Reduces amplification bias enabling precise quantification | Essential for accurate quantification in high-throughput protocols [104] |
| Cell Quality Assessment | Impacts data quality and interpretation | Visual inspection in plate-based platforms; mitochondrial percentage thresholds [44] |
| Multiplexing Capability | Enables batch effect correction through sample pooling | Barcode-based approaches for experimental flexibility [103] |
Quantitative Comparison of scRNA-seq Platforms
Protocol Performance Metrics
Understanding the performance characteristics of different scRNA-seq platforms is essential for cross-platform study design and data interpretation. The table below summarizes key metrics for representative protocols across the main technology categories.
Table 2: Comparative Analysis of scRNA-seq Platform Characteristics
| Protocol | Throughput (Cells) | Cost per Cell (USD) | Genes Detected per Cell | UMI Support | Strand Specificity | Protocol Type |
|---|---|---|---|---|---|---|
| 10X Chromium V3 | >10,000 | $0.50 | 4,000-7,000 | Yes (12bp) | Yes | Droplet-based |
| Smart-seq2 | <1,000 | $1.50-2.50 | 6,500-10,000 | No | No | Plate-based |
| CEL-seq2 | 100-1,000 | $0.30-0.50 | 5,000-7,000 | Yes (6bp) | Yes | Plate-based |
| Drop-Seq | 1,000-10,000 | $0.10-0.20 | 2,000-6,000 | Yes (8bp) | Yes | Droplet-based |
| MATQ-seq | 100-1,000 | $0.40-0.60 | 8,000-14,000 | Yes | Yes | Plate-based |
Substantial differences in accuracy and sensitivity have been reported between different protocols, highlighting the importance of selecting appropriate methodologies based on specific experimental needs [102]. For stem cell applications requiring detection of low-abundance transcripts in rare populations, platforms with higher sensitivity (e.g., MATQ-seq) may be preferable despite their lower throughput and higher cost.
Computational Processing Pipeline
Standardized computational processing is crucial for minimizing technical variability in scRNA-seq data analysis. A typical workflow involves six key stages that systematically transform raw sequencing data into biological insights while controlling for technical artifacts.
The alignment stage represents one of the most critical steps, with tools like STAR and Kallisto performing optimally in benchmark studies using real datasets from different platforms [102]. For stem cell research, specific quality control thresholds should be established, such as excluding cells with fewer than 200 or more than 2,500 transcripts and those with more than 5% mitochondrial content, as demonstrated in HSPC studies [44].
Experimental Protocol: Assessing Technical Variability
Workflow for Variability Assessment
This protocol describes a standardized approach for quantifying technical variability in scRNA-seq experiments, with particular relevance to stem cell research applications.
Step-by-Step Procedures
Sample Preparation and Processing
Stem Cell Isolation: Isolate target stem cell population using standardized methods. For HSPCs, use FACS sorting with CD34+Lin−CD45+ or CD133+Lin−CD45+ markers [44]. For dental pulp stem cells, employ enzymatic digestion followed by magnetic-activated cell sorting (MACS) for specific subpopulations such as MCAM(+)JAG(+)PDGFRA(−) cells [14].
Sample Splitting: Divide the cell suspension into technical replicates of equal cell concentration. Determine cell viability and count using standardized methods (e.g., trypan blue exclusion with automated cell counting).
Parallel Processing: Process technical replicates across different scRNA-seq platforms (e.g., 10X Chromium, Smart-seq2) or the same platform across multiple batches. Maintain consistent library preparation protocols according to manufacturer specifications.
Sequencing: Sequence all libraries on the same flow cell using balanced multiplexing to minimize sequencing batch effects. Aim for consistent sequencing depth across samples (e.g., 25,000 reads per cell for 10X Genomics protocols) [44].
Computational Analysis of Technical Variability
Raw Data Processing: Process each dataset independently through alignment (CellRanger for 10X data, STAR or Kallisto for full-length protocols) and generation of count matrices [102].
Quality Control: Apply consistent quality control thresholds across all datasets. Filter out cells with low unique gene counts, high mitochondrial content, or evidence of doublets/multiplets [44].
Normalization: Apply appropriate normalization methods (e.g., SCTransform in Seurat, deconvolution-based normalization in scran) to account for library size differences [101].
Highly Variable Gene Detection: Identify genes exhibiting higher cell-to-cell variability than expected by technical noise using the scran or scater packages in R/Bioconductor [101].
Technical Variability Quantification:
- Calculate intra-platform correlation between technical replicates
- Assess inter-platform consistency using metrics like Pearson correlation
- Quantify batch effects using methods such as PCA or MANOVA
- Evaluate cluster robustness through bootstrap resampling
Case Study: Reproducibility in Stem Cell Research
Hematopoietic Stem/Progenitor Cells (HSPCs)
A recent study optimizing scRNA-seq for human umbilical cord blood-derived HSPCs demonstrated exceptional cross-population reproducibility when comparing CD34+ and CD133+ populations. Despite the expectation that CD133+ HSPCs might represent a more primitive stem cell population, transcriptomic analysis revealed a very strong positive linear relationship (R = 0.99) between these cell types [44] [51]. This finding highlights that with optimized protocols, scRNA-seq can generate highly reproducible data even for closely related stem cell subpopulations.
The successful workflow employed in this study included careful cell sorting, attention to quality parameters during single-cell library preparation, and integrated data analysis treating both datasets as "pseudobulk" for comparison. This approach confirmed the feasibility of HSPC analysis with limited cell numbers when using sorted material rather than heterogeneous cell pellets [44].
Dental Pulp Stem Cells
Research on human dental pulp stem cells (hDPSCs) illustrates the impact of cellular composition on data interpretation. scRNA-seq analysis revealed that conventional monolayer expansion induces significant cellular composition switches compared to freshly isolated DPSCs [14]. However, one subpopulation (MCAM(+)JAG(+)PDGFRA(−)) maintained the most transcriptional characteristics of freshly isolated cells, demonstrating that specific subpopulations may show different technical variability profiles.
This finding has important implications for cross-platform reproducibility, as studies using different cell preparation methods (fresh isolation vs. monolayer culture) may yield substantially different results due to actual biological differences rather than technical artifacts. The identification of stable subpopulations resistant to culture-induced changes provides a path toward more reproducible stem cell characterization.
The Scientist's Toolkit: Essential Research Reagents
Table 3: Key Research Reagent Solutions for Reproducible scRNA-seq
| Reagent Category | Specific Examples | Function in scRNA-seq Workflow |
|---|---|---|
| Cell Surface Markers | CD34, CD133, CD45, Lineage markers | Isolation of specific stem cell populations by FACS [44] |
| Library Preparation Kits | Chromium Next GEM Single Cell 3' Kit (10X Genomics) | Generation of barcoded scRNA-seq libraries with UMIs |
| Cell Viability Assays | Trypan blue, Propidium iodide, Calcein AM | Assessment of cell integrity pre-encapsulation/capture |
| Nucleic Acid Quality Controls | Bioanalyzer RNA Integrity chips, Qubit assays | Verification of RNA quality before library preparation |
| Spike-in Controls | ERCC RNA Spike-In Mix | Monitoring technical variability and quantification accuracy [101] |
| Barcode Oligonucleotides | CellBender, CellPlex | Multiplexing samples to minimize batch effects |
Data Consistency Assessment Framework
Quality Control Metrics
Establishing standardized quality control metrics is essential for evaluating data consistency across platforms and experiments. The following parameters should be routinely monitored and reported:
- Sequencing Metrics: Total reads, reads confidently mapped to transcriptome, mean reads per cell, saturation level
- Cell Quality Metrics: Mean genes detected per cell, total counts per cell, mitochondrial percentage, doublet rate
- Sample-specific Metrics: Expression of marker genes for expected cell types, absence of marker genes for excluded cell types
Statistical Approaches for Assessing Reproducibility
Several statistical methods have been developed specifically for evaluating technical variability in scRNA-seq data:
- Mean-Variance Trend Analysis: Fitting a mean-variance trend to distinguish technical from biological variability [101]
- Highly Variable Gene Testing: Statistical tests for identifying genes with variability significantly above technical noise
- Cross-platform Correlation: Assessing consistency of gene expression patterns and cellular composition across methodologies
- Differential Expression Concordance: Evaluating the overlap of differentially expressed genes identified by different platforms
Achieving cross-platform reproducibility in scRNA-seq studies requires careful attention to experimental design, standardized processing protocols, and rigorous computational analysis. For stem cell researchers, the approaches outlined in this application note provide a framework for managing technical variability while preserving biological signal. By implementing these practices—including appropriate platform selection, standardized processing pipelines, and systematic quality assessment—researchers can enhance the reliability and reproducibility of their scRNA-seq data, enabling more robust characterization of stem cell populations and their developmental trajectories. As single-cell technologies continue to evolve, maintaining focus on these fundamental principles of reproducibility will ensure that biological insights gained from these powerful methods stand the test of time and technological advancement.
Single-cell RNA sequencing (scRNA-seq) has revolutionized biomedical research by enabling the characterization of individual cells within complex tissues, providing unprecedented insights into cellular heterogeneity, developmental trajectories, and disease mechanisms [105]. As global initiatives like the Human Cell Atlas (HCA) endeavor to create comprehensive reference maps of all human cells, a critical challenge has emerged: the significant underrepresentation of diverse genetic ancestries in existing datasets [106]. Current scRNA-seq studies exhibit an "extremely large proportion of donors of European ancestry," creating substantial gaps in our understanding of how genetic background influences cellular physiology, gene regulation, and disease susceptibility across global populations [106]. This representation gap limits the generalizability of scientific findings and hinders the development of equitable precision medicine approaches that benefit all populations equally.
The integration of diverse ancestral backgrounds into cell atlas projects is not merely a quantitative issue but a qualitative imperative for robust biological discovery. Genetic ancestry significantly influences molecular phenotypes including gene expression patterns, alternative splicing regulation, and immune cell function [106] [107]. Without deliberate inclusion of diverse populations, critical ancestry-specific biological mechanisms remain invisible to researchers, potentially biasing our understanding of fundamental biological processes and therapeutic targets. This Application Note addresses these representation gaps by providing structured experimental frameworks and methodological solutions for incorporating ancestral diversity into single-cell studies, with particular emphasis on stem cell characterization research and its applications in drug development.
Current Landscape: Documenting the Representation Gap
Quantitative Assessment of Ancestral Representation
Recent systematic evaluations of genetic ancestry inference in single-cell RNA sequencing datasets have revealed profound disparities in ancestral representation. An analysis of 196 donors from four major scRNA-seq datasets within the Human Cell Atlas framework demonstrated extreme overrepresentation of European ancestry populations, creating significant barriers to identifying ancestry-specific regulatory mechanisms and their roles in disease [106]. This imbalance persists despite the proven feasibility of inferring genetic ancestry directly from scRNA-seq data using established tools like ADMIXTURE, which provide accurate ancestry inference even with the limited number of genetic polymorphisms identified from scRNA-seq reads [106].
Table 1: Ancestral Representation in Current scRNA-seq Databases
| Database/Initiative | Sample Size | Reported Ancestral Diversity | Key Gaps Identified |
|---|---|---|---|
| Human Cell Atlas (Selected Datasets) | 196 donors | Extremely large proportion of European ancestry | Limited representation of African, Asian, Indigenous populations |
| Asian Immune Diversity Atlas (AIDA) | 474 donors | Eastern, Southeastern, and South Asian ancestries | Underrepresentation of non-Asian populations in this specific resource |
| OneK1K | Not specified in results | Primarily European ancestry | Serves as comparison for AIDA dataset diversity |
Scientific Consequences of Representation Gaps
The underrepresentation of diverse ancestries in single-cell genomics has tangible scientific consequences that impact both basic research and translational applications. Ancestry-biased alternative splicing events represent one significant area where diversity gaps limit biological understanding. Research from the Asian Immune Diversity Atlas has identified 1,031 ancestry-biased differential splicing events affecting 509 genes across immune cell types, demonstrating how population-specific genetic variation influences mRNA processing in a cell-type-specific manner [107]. These splicing differences can directly impact protein function, cellular behavior, and ultimately disease risk, yet they remain invisible in studies limited to homogeneous populations.
Similarly, sex-biased splicing events represent another dimension of biological variation that requires diverse samples for proper characterization. The AIDA project identified 48 sex-biased differential splicing events across 32 genes, including sexually dimorphic splicing of FLNA driven by female-biased expression of specific isoforms [107]. Such findings highlight the complex interplay between genetic ancestry, sex, and cellular regulation that can only be elucidated through intentionally diverse study designs. For stem cell researchers, these gaps are particularly problematic as they may obscure important population-specific differences in stem cell behavior, differentiation potential, and therapeutic applications.
Methodological Framework: Integrating Ancestral Diversity into scRNA-Seq Studies
Experimental Design Considerations for Diverse Cohort Building
Building representative cohorts for single-cell studies requires strategic planning from the earliest experimental design stages. Researchers should implement deliberate sampling strategies that ensure balanced representation across target ancestral populations, rather than relying on convenience samples that typically overrepresent specific demographic groups. The sample processing pipeline must maintain consistency across collection sites and populations to minimize technical artifacts that could be misinterpreted as biological differences [108] [109]. For stem cell research specifically, consideration should be given to obtaining donor materials from diverse genetic backgrounds, including umbilical cord blood, dental pulp, and other stem cell sources that reflect global human diversity [44] [14].
Experimental design must also account for the substantial technical variability between scRNA-seq protocols, which differ significantly in their sensitivity for detecting cell types, gene expression patterns, and alternatively spliced isoforms [108] [109]. Selection of appropriate protocols should be guided by the specific biological questions and cell types of interest, with particular attention to protocols that enable detection of ancestry-specific molecular features. For studies focusing on alternative splicing differences across populations, 5' library preparation protocols (such as the 10x Genomics 5' kit) provide enhanced capability for capturing splicing events through stochastic mRNA cleavage and recapping phenomena that increase exon coverage [107].
Computational Approaches for Ancestry Inference and Analysis
When donor ancestry information is unavailable in existing datasets, computational inference methods can recover this critical metadata directly from scRNA-seq data. Established tools like ADMIXTURE can provide accurate genetic ancestry inference even from the limited number of genetic polymorphisms detectable in scRNA-seq reads [106]. These approaches enable researchers to retrospectively analyze existing datasets and proactively plan new studies that address representation gaps.
Table 2: Computational Tools for Enhancing Ancestral Diversity in scRNA-seq Studies
| Tool/Method | Primary Function | Application Context | Considerations for Stem Cell Research |
|---|---|---|---|
| ADMIXTURE | Genetic ancestry inference from genetic polymorphisms | Useful when donor ancestry metadata is missing | Can be applied to stem cell lines of unknown origin |
| LeafCutter | Identification of alternative splicing events from RNA-seq data | Detection of ancestry-biased splicing | Reveals population-specific splicing in stem cell differentiation |
| SpliZ | Single-cell level splicing quantification | High-resolution splicing analysis in heterogeneous populations | Enables splicing analysis in rare stem cell subpopulations |
| CellRanger | Standard scRNA-seq data processing | Essential first step in all analyses | Compatible with diverse sample types including stem cells |
For analyzing ancestry-specific molecular features, specialized computational approaches are required. The AIDA project employed both pseudobulk approaches (LeafCutter) and single-cell methods (SpliZ) to quantify alternative splicing differences across populations, with pseudobulk methods detecting a median of 7,721 alternatively spliced genes per cell type and single-cell methods identifying approximately 1,146 AS genes per cell [107]. These complementary approaches provide different levels of resolution for understanding how genetic variation influences cellular physiology across ancestral backgrounds.
Technical Protocols for Diverse scRNA-Seq Studies
Cell Isolation and Sample Preparation
The initial phase of single-cell RNA sequencing studies requires careful attention to cell isolation techniques that maintain cell viability while preserving biological authenticity. For hematopoietic stem/progenitor cells (HSPCs), effective protocols have been developed using fluorescence-activated cell sorting (FACS) to purify specific subpopulations from human umbilical cord blood based on surface markers including CD34, CD133, and CD45 while excluding lineage-committed cells (Lin-) [44]. Similar approaches can be adapted for other stem cell types, including dental pulp stem cells (DPSCs) which exhibit distinct subpopulations characterized by markers such as MCAM, JAG1, and PDGFRA [14].
Protocol: Isolation of Hematopoietic Stem/Progenitor Cells from Umbilical Cord Blood
- Sample Collection: Collect human umbilical cord blood (hUCB) with appropriate ethical approvals and donor consent [44].
- Mononuclear Cell Isolation: Dilute hUCB with phosphate-buffered saline (PBS) and layer over Ficoll-Paque density gradient medium. Centrifuge at 400× g for 30 minutes at 4°C [44].
- Antibody Staining: Resuspend mononuclear cells in staining buffer and incubate with antibody cocktails including:
- Lineage markers (CD235a, CD2, CD3, CD14, CD16, CD19, CD24, CD56, CD66b) conjugated to FITC
- CD45 conjugated to PE-Cy7
- CD34 conjugated to PE
- CD133 conjugated to APC [44]
- Cell Sorting: Use a high-speed cell sorter (e.g., MoFlo Astrios EQ) to select populations of interest based on defined surface marker combinations (e.g., CD34+Lin-CD45+ or CD133+Lin-CD45+) [44].
- Quality Control: Assess cell viability and count before proceeding to library preparation.
For solid tissues, including dental pulp, more extensive processing is required: Protocol: Dissociation of Dental Pulp Tissue for scRNA-seq
- Tissue Processing: Mechanically mince fresh dental pulp tissue into small fragments.
- Enzymatic Digestion: Incubate tissue with collagenase/dispase enzymes to dissociate cellular components.
- Cell Sorting: Use FACS or magnetic-activated cell sorting (MACS) to isolate stem cell populations based on surface markers (e.g., MCAM+/JAG1+/PDGFRA- for DPSCs with enhanced differentiation capacity) [14].
- Viability Assessment: Exclude dead cells using viability dyes and confirm cell integrity before library preparation.
Library Preparation and Sequencing Strategies
Library preparation protocol selection significantly impacts the molecular features detectable in diverse samples. For comprehensive characterization of alternative splicing differences across populations, 5' library preparation methods provide advantages in exon coverage through endogenous "exon painting" phenomena [107]. However, different research questions may warrant different technical approaches:
Protocol: scRNA-seq Library Preparation Using 10x Genomics Platform
- Cell Processing: Immediately process sorted cells using Chromium X Controller and Chromium Next GEM Chip G Single Cell Kit [44].
- Library Construction: Use Chromium Next GEM Single Cell 3' GEM, Library & Gel Beak Kit v3.1 and Single Index Kit T Set A following manufacturer guidelines [44].
- Quality Assessment: Evaluate library quality using appropriate methods (e.g., Bioanalyzer).
- Sequencing: Pool libraries and sequence on Illumina NextSeq 1000/2000 using P2 flow cell chemistry with paired-end sequencing (read 1: 28 bp, read 2: 90 bp) targeting 25,000 reads per cell [44].
For studies specifically focused on detecting ancestry-associated splicing quantitative trait loci (sQTLs), modified bioinformatic approaches are necessary to leverage the 5' coverage provided by certain library preparation methods. The AIDA project demonstrated that despite the 5' bias of read 1 in 10x Genomics protocols, read 2 provides more uniform coverage when combined with stochastic mRNA cleavage and recapping, enabling detection of ancestry-biased splicing events [107].
Analytical Workflows for Ancestry-Informed scRNA-Seq Data
Quality Control and Data Processing
Robust quality control pipelines are essential for cross-ancestry single-cell analyses to ensure technical artifacts are not misinterpreted as biological differences. The following workflow outlines a standardized approach:
Figure 1: scRNA-seq Data Processing Workflow. This standardized pipeline ensures consistent processing across diverse samples.
Protocol: Quality Control and Filtering for Diverse scRNA-seq Datasets
- Initial Processing: Process raw sequencing data (BCL files) through Cell Ranger pipelines (version 7.2.0) to generate feature-barcode matrices [44].
- Quality Metrics: Calculate standard QC metrics including:
- Number of unique genes per cell
- Total counts per cell
- Percentage of mitochondrial reads [44]
- Filtering Thresholds: Apply consistent filtering criteria across all samples:
- Exclude cells with <200 or >2,500 detected genes
- Remove cells with >5% mitochondrial reads [44]
- Batch Effect Evaluation: Assess technical variation between samples from different collection sites or processing batches.
Ancestry Inference and Differential Analysis
When direct ancestry information is unavailable, computational inference enables retrospective analysis of existing datasets:
Protocol: Genetic Ancestry Inference from scRNA-seq Data
- Variant Calling: Extract genetic polymorphisms from scRNA-seq reads aligned to reference genome.
- Ancestry Inference: Apply ADMIXTURE or similar tools to infer genetic ancestry components [106].
- Population Assignment: Group samples based on genetic similarity for downstream comparative analyses.
- Covariate Integration: Incorporate ancestry information as covariates in differential expression and splicing analyses.
For detecting ancestry-associated molecular differences, both pseudobulk and single-cell approaches provide complementary insights:
Protocol: Identification of Ancestry-Biased Splicing Events
- Splicing Quantification:
- Differential Testing: Implement statistical models that test for association between genetic ancestry and splicing patterns while controlling for relevant technical and biological covariates.
- Validation: Confirm putative ancestry-biased splicing events through orthogonal methods (e.g., PacBio long-read sequencing) when possible [107].
Research Reagent Solutions for Diverse Stem Cell Studies
Table 3: Essential Research Reagents for Ancestrally Diverse Stem Cell Characterization
| Reagent Category | Specific Examples | Function in Experimental Pipeline | Considerations for Diverse Studies |
|---|---|---|---|
| Cell Isolation Antibodies | CD34, CD133, CD45, Lineage Cocktail (CD235a, CD2, CD3, CD14, CD16, CD19, CD24, CD56, CD66b) [44] | Fluorescence-activated cell sorting of stem cell populations | Validate antibody performance across diverse genetic backgrounds |
| scRNA-seq Library Kits | Chromium Next GEM Single Cell 3' GEM Kit (10x Genomics) [44] | Single-cell library preparation for 3' digital gene expression | Consider 5' kits for splicing analysis in diverse populations [107] |
| Cell Sorting Systems | MoFlo Astrios EQ Cell Sorter (Beckman Coulter) [44] | High-speed purification of rare stem cell populations | Standardize sorting parameters across all donor samples |
| Sequence Capture Beads | Chromium Next GEM Chip G [44] | Microfluidic partitioning of single cells | Monitor batch effects across different reagent lots |
| Validation Reagents | Antibodies for MCAM, JAG1, PDGFRA [14] | Immunophenotypic validation of stem cell subpopulations | Confirm consistent staining across diverse samples |
Implementation Roadmap and Future Directions
Building inclusive cell atlas resources requires coordinated effort across multiple domains. The following strategic priorities represent critical pathways for addressing representation gaps in single-cell genomics:
Prospective Diverse Cohort Recruitment: Future studies should intentionally recruit participants from underrepresented ancestral backgrounds, with particular emphasis on populations currently missing from major reference databases.
Methodological Standardization for Cross-Ancestry Comparisons: Develop and validate standardized protocols that ensure technical consistency when processing samples from diverse genetic backgrounds, minimizing batch effects that could obscure true biological differences.
Analytical Tool Development: Create specialized computational methods designed specifically for identifying ancestry-specific molecular features in single-cell data, including improved normalization approaches that account for population-level genetic variation.
Reference Resource Expansion: Systematically generate reference data from diverse stem cell sources, including induced pluripotent stem cells (iPSCs) from multiple ancestral backgrounds, to enable comparative studies of population-specific differentiation patterns and drug responses.
Reporting Standards: Implement mandatory reporting of genetic ancestry metadata in all public single-cell datasets, using either self-reported ancestry or computationally inferred estimates when necessary [106].
The integration of ancestral diversity into cell atlas projects represents both an ethical imperative and a scientific opportunity to unlock biological insights invisible in homogeneous studies. By implementing the frameworks and protocols outlined in this Application Note, researchers can construct more comprehensive and representative single-cell resources that accelerate discovery and enable equitable translation of stem cell research into clinical applications.
Conclusion
Single-cell RNA sequencing has fundamentally transformed our approach to stem cell characterization, providing unprecedented insights into cellular heterogeneity, developmental trajectories, and regulatory networks. The integration of optimized experimental workflows with advanced computational methods, particularly machine learning approaches, is accelerating discoveries in stem cell biology and therapeutic development. Future directions will focus on enhancing multi-omics integration, improving spatial context resolution, developing more sophisticated trajectory inference algorithms, and expanding global accessibility to these technologies. As standardization improves and costs decrease, scRNA-seq is poised to become a cornerstone technology in regenerative medicine, drug discovery, and personalized stem cell therapies, ultimately enabling more precise manipulation of stem cell fate and function for clinical applications.
References
- 1. ‐ Single transcriptome atlas of human mesenchymal cell ... stem cells [https://pmc.ncbi.nlm.nih.gov/articles/PMC8715893/]
- 2. - Single to track novel perspectives in HSC... cell RNA sequencing [https://stemcellres.biomedcentral.com/articles/10.1186/s13287-022-02718-1]
- 3. Navigating single - cell - RNA : sequencing , tools, databases... protocols [https://pmc.ncbi.nlm.nih.gov/articles/PMC12085826/]
- 4. Navigating single - cell - RNA : sequencing , tools, databases... protocols [https://genomicsinform.biomedcentral.com/articles/10.1186/s44342-025-00044-5]
- 5. High-resolution single - cell -seq RNA and data ... heterogeneity analysis [https://www.nature.com/articles/s41597-025-05024-6?error=cookies_not_supported&code=0a31dc6a-2688-4570-8b0e-ac90fda92546]
- 6. -Nucleus Single (sNuc-seq) RNA Sequencing Protocol [https://www.news-medical.net/life-sciences/Single-Nucleus-RNA-Sequencing-(sNuc-seq)-Protocol.aspx]
- 7. Single- Cell & Low-Input RNA- Seq | Single- cell methods sequencing [https://www.illumina.com/techniques/sequencing/rna-sequencing/ultra-low-input-single-cell-rna-seq.html]
- 8. Single-cell sequencing in stem cell biology | Genome Biology | Full Text [https://genomebiology.biomedcentral.com/articles/10.1186/s13059-016-0941-0]
- 9. - Single technologies and cell : A brief... RNA sequencing applications [https://pubmed.ncbi.nlm.nih.gov/35352511/]
- 10. Single-cell RNA-seq of human induced pluripotent stem cells reveals cellular heterogeneity and cell state transitions between subpopulations - PMC [https://pmc.ncbi.nlm.nih.gov/articles/PMC6028138/]
- 11. Integrated analysis of single- cell and bulk RNA sequencing data... [https://genomemedicine.biomedcentral.com/articles/10.1186/s13073-022-01050-w]
- 12. scRNASequest: an ecosystem of scRNA-seq analysis, visualization, and publishing | BMC Genomics | Full Text [https://bmcgenomics.biomedcentral.com/articles/10.1186/s12864-023-09332-2]
- 13. Powerful scRNA-seq Data Analysis Tools for Biologists in 2025 [https://www.nygen.io/resources/blog/single-cell-scrna-seq-multi-omics-data-analysis-tools]
- 14. - Single of monolayer cultured human dental pulp... cell characterization [https://www.nature.com/articles/s41368-021-00140-6?error=cookies_not_supported&code=5e37e574-9756-4430-8a59-937586227a08]
- 15. - Single -Seq Mapping of Human Thymopoiesis Reveals... Cell RNA [https://pmc.ncbi.nlm.nih.gov/articles/PMC7388724/]
- 16. - Single -Seq of Bone Marrow-Derived... | PLOS One Cell RNA [https://journals.plos.org/plosone/article?id=10.1371/journal.pone.0136199]
- 17. Single-cell lineage capture across genomic modalities with CellTag-multi reveals fate-specific gene regulatory changes | Nature Biotechnology [https://www.nature.com/articles/s41587-023-01931-4]
- 18. - Single Reveals mRNA Splice Isoform... Cell RNA Sequencing [https://pmc.ncbi.nlm.nih.gov/articles/PMC7609002/]
- 19. Single‐cell RNA sequencing technologies and applications: A brief overview - PMC [https://pmc.ncbi.nlm.nih.gov/articles/PMC8964935/]
- 20. Single- cell of monolayer cultured human dental pulp... characterization [https://www.nature.com/articles/s41368-021-00140-6?error=cookies_not_supported&code=f1389dd0-2d5f-43e9-91e6-7cd6b92f8e0c]
- 21. Frontiers | Unlocking hematopoietic stem potential: integrative... cell [https://www.frontiersin.org/journals/cell-and-developmental-biology/articles/10.3389/fcell.2025.1589823/full]
- 22. Global trends in machine learning applications for single-cell... [https://hereditasjournal.biomedcentral.com/articles/10.1186/s41065-025-00528-y]
- 23. Kidney diseases and single-cell sequencing research: a bibliometric ... [https://pubmed.ncbi.nlm.nih.gov/40545992/]
- 24. Frontiers | Worldwide hotspots and trends in stem cell therapy for kidney disease in the last decade: a bibliometric and visualization analysis from 2015 to 2024 [https://www.frontiersin.org/journals/immunology/articles/10.3389/fimmu.2025.1619291/full]
- 25. InfoScan: A New Transcript Identification Tool Based on scRNA - Seq ... [https://pubmed.ncbi.nlm.nih.gov/40076844/]
- 26. Next-generation approaches for mesenchymal stem ... cell [https://www.bsmiab.org/jabet/articles/178-1749644943]
- 27. Stem Cell Therapy Success Rates Hit 78%: New Research Reveals Breakthrough Results GlobalRPH [https://globalrph.com/2025/03/stem-cell-therapy-success-rates-hit-78-new-research-reveals-breakthrough-results/]
- 28. Single-cell RNA-seq highlights heterogeneity in human primary Wharton’s jelly mesenchymal stem/stromal cells cultured in vitro | Stem Cell Research & Therapy | Full Text [https://stemcellres.biomedcentral.com/articles/10.1186/s13287-020-01660-4]
- 29. Single Cell RNA-Seq: Cell Isolation and Data Analysis - PubMed [https://pubmed.ncbi.nlm.nih.gov/34913118/]
- 30. -based FACS of Neural and Glioma Isolation Populations... Stem Cell [https://bio-protocol.org/en/bpdetail?id=2659&type=0]
- 31. as efficient technology for the Microfluidics and... isolation [https://pmc.ncbi.nlm.nih.gov/articles/PMC7975637/]
- 32. of highly pure embryonic Microfluidic using... isolation stem cells [https://www.nature.com/articles/srep02433?error=cookies_not_supported]
- 33. A Subtractive FACS Method for Isolation of Planarian Stem and... Cells [https://link.springer.com/protocol/10.1007/978-1-4939-7802-1_19]
- 34. for Protocol and Characterization of In Situ Fixed Quiescent... Isolation [https://pmc.ncbi.nlm.nih.gov/articles/PMC7757111/]
- 35. Frontiers | Experimental Considerations for Single-Cell RNA Sequencing Approaches [https://www.frontiersin.org/journals/cell-and-developmental-biology/articles/10.3389/fcell.2018.00108/full]
- 36. Applications of single cell RNA sequencing to research of stem cells - PMC [https://www.ncbi.nlm.nih.gov/pmc/articles/PMC6828599/]
- 37. Recent advances of single-cell RNA sequencing technology in mesenchymal stem cell research - PMC [https://www.ncbi.nlm.nih.gov/pmc/articles/PMC7360991/]
- 38. Direct Comparative Analyses of 10 Chromium and... X Genomics [https://pmc.ncbi.nlm.nih.gov/articles/PMC8602399/]
- 39. Direct Comparative Analyses of 10 Chromium and... X Genomics [https://pubmed.ncbi.nlm.nih.gov/33662621/]
- 40. Comparative Analysis of Single-Cell RNA Sequencing Platforms and Methods - PMC [https://pmc.ncbi.nlm.nih.gov/articles/PMC9258609/]
- 41. Systematic comparison of single-cell and single-nucleus RNA-sequencing methods - PMC [https://pmc.ncbi.nlm.nih.gov/articles/PMC7289686/]
- 42. Approaches for single-cell RNA sequencing across tissues and cell types - PMC [https://pmc.ncbi.nlm.nih.gov/articles/PMC10807473/]
- 43. Statistics or biology: the zero-inflation controversy about scRNA- seq data [https://genomebiology.biomedcentral.com/articles/10.1186/s13059-022-02601-5]
- 44. Frontiers | Optimizing single of cell . RNA sequencing stem cells [https://www.frontiersin.org/journals/cell-and-developmental-biology/articles/10.3389/fcell.2025.1590889/full]
- 45. Practical bioinformatics pipelines for single-cell RNA-seq data analysis - PMC [https://pmc.ncbi.nlm.nih.gov/articles/PMC10189648/]
- 46. An Innovative Approach to Tissue Processing and Cell of... Sorting [https://pmc.ncbi.nlm.nih.gov/articles/PMC9499188/]
- 47. QuantumScale Single Cell RNA | Scale Biosciences [https://scale.bio/single-cell-rna-sequencing-kit/]
- 48. A systematic evaluation of single cell RNA-seq analysis pipelines | Nature Communications [https://www.nature.com/articles/s41467-019-12266-7]
- 49. /Cas9- CRISPR depletion of 16S ribosomal based improves... RNA [https://pmc.ncbi.nlm.nih.gov/articles/PMC10588366/]
- 50. 2 Single - cell — RNA - sequencing best practices Single cell [https://www.sc-best-practices.org/introduction/scrna_seq.html]
- 51. Optimizing single of cell . A streamlined... RNA sequencing stem cells [https://pubmed.ncbi.nlm.nih.gov/40443736/]
- 52. - Single reveals key regulators and differentiation... cell RNA sequencing [https://www.nature.com/articles/s41598-024-79488-8?error=cookies_not_supported&code=2c573734-4fd0-4bc6-8ec5-4e8de865b2fc]
- 53. - Single dynamic cell and glycosylation RNA reveals the... sequencing [https://pmc.ncbi.nlm.nih.gov/articles/PMC12116958/]
- 54. Chapter 4 Normalisation and batch | Single cell RNA- correction ... seq [https://mperalc.gitlab.io/scRNA-seq_workshop_2021/methods.html]
- 55. 7 Normalization , confounders and batch | correction of... Analysis [https://biocellgen-public.svi.edu.au/mig_2019_scrnaseq-workshop/normalization-confounders-and-batch-correction.html]
- 56. 4 Handy Tips For Correcting Effects | Batch - ScRNA 101 seq Analysis [https://www.pythiabio.com/post/4-handy-tips-for-correcting-batch-effects-scrna-seq-analysis-101]
- 57. ‑ Single data cell (Review) RNA sequencing dimensionality reduction [https://www.spandidos-publications.com/10.3892/wasj.2025.315]
- 58. Stability of scRNA-Seq Analysis Workflows is Susceptible to Preprocessing and is Mitigated by Regularized or Supervised Approaches - PMC [https://pmc.ncbi.nlm.nih.gov/articles/PMC9527995/]
- 59. Current best practices in single-cell RNA-seq analysis: a tutorial - PubMed [https://pubmed.ncbi.nlm.nih.gov/31217225/]
- 60. from Trajectory - inference genomics data with a process... single cell [https://journals.plos.org/ploscompbiol/article?id=10.1371/journal.pcbi.1012752]
- 61. Gene trajectory for inference - single data by optimal transport... cell [https://pubmed.ncbi.nlm.nih.gov/38580861/]
- 62. Current best practices in single‐cell RNA‐seq analysis: a tutorial - PMC [https://pmc.ncbi.nlm.nih.gov/articles/PMC6582955/]
- 63. Optimizing single cell RNA sequencing of stem cells. A streamlined workflow for enhanced sensitivity and reproducibility in hematopoietic studies. The use of human umbilical cord blood-derived hematopoietic stem and progenitor cells - PMC [https://pmc.ncbi.nlm.nih.gov/articles/PMC12119605/]
- 64. in Whole Genome Bias : Amplification Considerations Causes and [https://pubmed.ncbi.nlm.nih.gov/26374307/]
- 65. Breaking the Bias : Amplifying GC-Rich Sequences with Precision. [https://www.linkedin.com/pulse/breaking-bias-amplifying-gc-rich-sequences-precision-d-harrington--bspzc]
- 66. Embracing the dropouts in single-cell RNA-seq analysis | Nature Communications [https://www.nature.com/articles/s41467-020-14976-9]
- 67. DrImpute: imputing dropout events in single cell RNA sequencing data - PMC [https://pmc.ncbi.nlm.nih.gov/articles/PMC5994079/]
- 68. RESCUE: imputing dropout events in single-cell RNA-sequencing data | BMC Bioinformatics | Full Text [https://bmcbioinformatics.biomedcentral.com/articles/10.1186/s12859-019-2977-0]
- 69. Common Considerations for Quality for Control ... Filters Single Cell [https://www.10xgenomics.com/analysis-guides/common-considerations-for-quality-control-filters-for-single-cell-rna-seq-data]
- 70. Single-cell RNA-seq: Quality Control Analysis | Introduction to Single-cell RNA-seq - ARCHIVED [https://hbctraining.github.io/scRNA-seq/lessons/04_SC_quality_control.html]
- 71. 6 Quality — Control - Single best practices cell [https://www.sc-best-practices.org/preprocessing_visualization/quality_control.html]
- 72. Comprehensive generation, visualization, and reporting of quality control metrics for single-cell RNA sequencing data | Nature Communications [https://www.nature.com/articles/s41467-022-29212-9]
- 73. A benchmark of batch - effect for correction - methods ... single cell RNA [https://pubmed.ncbi.nlm.nih.gov/31948481/]
- 74. in Batch - Effect -seq: Frequently Asked Questions Single cell RNA [https://www.elucidata.io/blog/batch-effect-in-single-cell-rna-seq-frequently-asked-questions-and-answers]
- 75. Chapter 1 Correcting | batch - effects - Multi ... Sample Single Cell [https://www.bioconductor.org/books/3.20/OSCA.multisample/integrating-datasets.html]
- 76. A benchmark of batch - effect for correction - methods ... single cell RNA [https://genomebiology.biomedcentral.com/articles/10.1186/s13059-019-1850-9]
- 77. Batch-effect correction in single-cell RNA sequencing data using JIVE - PMC [https://pmc.ncbi.nlm.nih.gov/articles/PMC11461915/]
- 78. Correcting batch effects in single-cell RNA-seq data [https://bioconductor.org/packages/devel/bioc/vignettes/batchelor/inst/doc/correction.html]
- 79. Integrating single-cell RNA-seq datasets with substantial batch effects | BMC Genomics | Full Text [https://bmcgenomics.biomedcentral.com/articles/10.1186/s12864-025-12126-3]
- 80. "Multi-platform evaluation and optimization of single - cell isoform... RNA [https://www.linkedin.com/pulse/multi-platform-evaluation-optimization-single-cell-rna-simone-picelli-xg5he]
- 81. New Single Methods Guide cell | 2025 -Seq Blog RNA [https://www.rna-seqblog.com/new-single-cell-methods-guide-2025/]
- 82. velocity and beyond: Current advances in modeling RNA - single ... cell [https://pubmed.ncbi.nlm.nih.gov/40973591/]
- 83. Frontiers | Single -nucleus RNA reveals sequencing ... dynamic [https://www.frontiersin.org/journals/endocrinology/articles/10.3389/fendo.2025.1562431/full]
- 84. Application of a Modified Smart-seq2 Sample Preparation Protocol for... [https://bio-protocol.org/en/bpdetail?id=3345&type=0]
- 85. MAST: a flexible statistical framework for assessing transcriptional ... [https://genomebiology.biomedcentral.com/articles/10.1186/s13059-015-0844-5]
- 86. Applications of single-cell RNA sequencing in drug discovery and development | Nature Reviews Drug Discovery [https://www.nature.com/articles/s41573-023-00688-4]
- 87. Frontiers | Single-cell technology for drug discovery and development [https://www.frontiersin.org/journals/drug-discovery/articles/10.3389/fddsv.2024.1459962/full]
- 88. A Tool for Visualization and Analysis of Single-Cell RNA-Seq ... [https://www.frontiersin.org/articles/10.3389/fgene.2019.00734/full]
- 89. Diversity by Design: Addressing Mode Collapse Improves scRNA - seq ... [https://arxiv.org/html/2506.22641v1]
- 90. Benchmarking scRNA - seq copy number... | Nature Communications [https://www.nature.com/articles/s41467-025-62359-9?error=cookies_not_supported&code=e6c6120f-b164-4744-bbd5-e67003ff404f]
- 91. Palo: spatially aware color palette optimization for single-cell and spatial data - PMC [https://pmc.ncbi.nlm.nih.gov/articles/PMC9272793/]
- 92. Public RNA-Seq and scRNA - Seq Databases: a Comparative Review [https://bigomics.ch/blog/ultimate-guide-to-public-rnaseq-and-sc-rna-seq-databases/]
- 93. of Imaging-based and Sequencing-based Integration Omics... Spatial [https://pmc.ncbi.nlm.nih.gov/articles/PMC11601288/]
- 94. scDrug: From single-cell RNA-seq to drug response prediction - ScienceDirect [https://www.sciencedirect.com/science/article/pii/S2001037022005505]
- 95. Machine learning integrative approaches to advance computational... [https://genomemedicine.biomedcentral.com/articles/10.1186/s13073-024-01350-3]
- 96. A systematic performance evaluation of clustering methods for single-cell RNA-seq data - PMC [https://pmc.ncbi.nlm.nih.gov/articles/PMC6134335/]
- 97. Benchmarking clustering algorithms on estimating the number of cell types from single-cell RNA-sequencing data | Genome Biology | Full Text [https://genomebiology.biomedcentral.com/articles/10.1186/s13059-022-02622-0]
- 98. 10 Clustering — Single - cell best practices [https://www.sc-best-practices.org/cellular_structure/clustering.html]
- 99. analysis of Comparative gene differential analysis tools... expression [https://pmc.ncbi.nlm.nih.gov/articles/PMC6339299/]
- 100. Benchmarking integration of single-cell differential expression | Nature Communications [https://www.nature.com/articles/s41467-023-37126-3]
- 101. Analysis of Technical and Biological Variability in Single - Cell ... RNA [https://pubmed.ncbi.nlm.nih.gov/30758818/]
- 102. Single-Cell RNA Sequencing Procedures and Data Analysis - Bioinformatics - NCBI Bookshelf [https://www.ncbi.nlm.nih.gov/books/NBK569559/]
- 103. - Single (scRNA-Seq) cell : A Comparative... RNA Sequencing Protocols [https://www.bgee.org/support/scRNA-seq-protocols-comparison]
- 104. Slides: An introduction to scRNA-seq data analysis / An introduction to scRNA-seq data analysis / Single Cell [https://training.galaxyproject.org/training-material/topics/single-cell/tutorials/scrna-intro/slides-plain.html]
- 105. Frontiers Publishing Partnerships | Advancements in single - cell ... RNA [https://www.frontierspartnerships.org/journals/acta-biochimica-polonica/articles/10.3389/abp.2025.13922/full]
- 106. Evaluating genetic- ancestry inference from single - cell -seq data RNA [https://pubmed.ncbi.nlm.nih.gov/40196550/]
- 107. - Single of peripheral blood... | Nature Genetics cell RNA sequencing [https://www.nature.com/articles/s41588-024-02019-8?error=cookies_not_supported&code=2b3d3b95-06dd-48dd-9ead-36a4c6172295]
- 108. Benchmarking Single - Cell Protocols for RNA ... Sequencing Cell Atlas [https://explore.data.humancellatlas.org/projects/6e177195-0ac0-468b-99a2-87de96dc9db4]
- 109. Benchmarking single - cell - RNA protocols for sequencing ... cell atlas [https://pubmed.ncbi.nlm.nih.gov/32518403/]